| Param | Original file | Final file |
|---|---|---|
| Filename | modeM0/AS1G08_083T03_9000002022_13648cztM0_level2.evt | modeM0/AS1G08_083T03_9000002022_13648cztM0_level2_quad_clean.evt |
| Size (bytes) | 448,983,360 | 76,020,480 |
| Size | 428.2 MB | 72.5 MB |
| Events in quadrant A | 3,150,385 | 469,160 |
| Events in quadrant B | 3,401,941 | 483,206 |
| Events in quadrant C | 3,345,015 | 472,043 |
| Events in quadrant D | 3,284,559 | 450,327 |
| Mode M0 | |||
|---|---|---|---|
| Quadrant | BADHDUFLAG | Total packets | Discarded packets |
| A | 0 | 12922 | 3 |
| B | 0 | 13792 | 2 |
| C | 0 | 13562 | 2 |
| D | 0 | 13445 | 2 |
| Mode M9 | |||
|---|---|---|---|
| Quadrant | BADHDUFLAG | Total packets | Discarded packets |
| A | 0 | 17 | 0 |
| B | 0 | 17 | 0 |
| C | 0 | 17 | 0 |
| D | 0 | 18 | 0 |
| Mode SS | |||
|---|---|---|---|
| Quadrant | BADHDUFLAG | Total packets | Discarded packets |
| A | 0 | 124 | 0 |
| B | 0 | 124 | 0 |
| C | 0 | 124 | 0 |
| D | 0 | 124 | 0 |
| Quadrant | Total seconds | Saturated seconds | Saturation percentage |
|---|---|---|---|
| A | 6121 | 33 | 0.539128% |
| B | 6121 | 55 | 0.898546% |
| C | 6121 | 35 | 0.571802% |
| D | 6121 | 40 | 0.653488% |
Noise dominated data is calculated using 1-second bins in cleaned event files. If a bin has >2000 counts, and if more than 50% of those come from <1% of pixels, then it is considered to be noise-dominated and hence unusable.
| Quadrant | # 1 sec bins | Bins with >0 counts | Bins with >2000 counts | High rate bins dominated by noise | Noise dominated (total time) | Noise dominated (detector-on time) | Marked lightcurve |
|---|---|---|---|---|---|---|---|
| A | 7472 | 6123 | 0 | 0 | 0.00% | 0.00% | 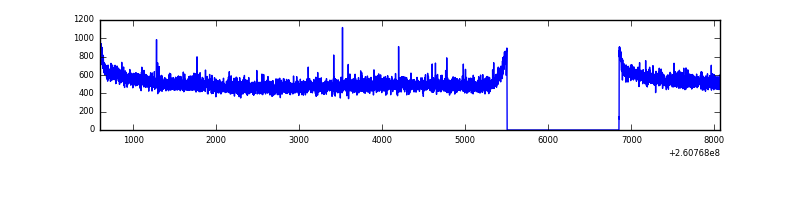 |
| B | 7472 | 6123 | 6 | 6 | 0.08% | 0.10% | 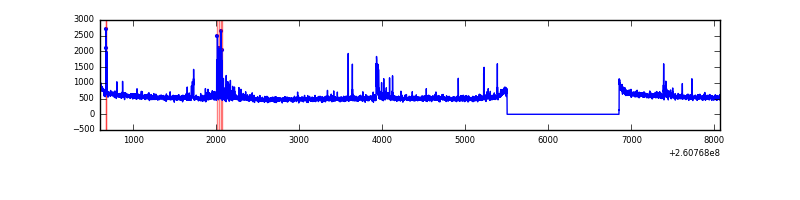 |
| C | 7472 | 6123 | 0 | 0 | 0.00% | 0.00% | 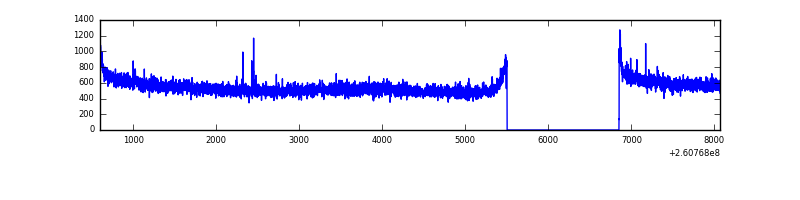 |
| D | 7472 | 6123 | 9 | 9 | 0.12% | 0.15% | 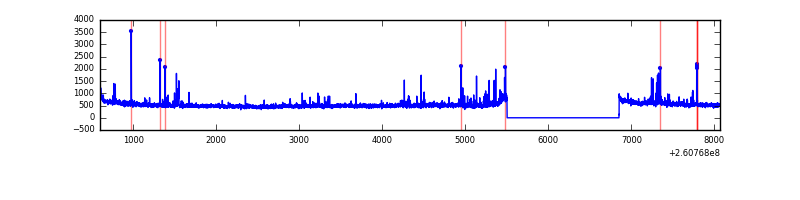 |
Top three noisy pixels from each quadrant. If the there are fewer than three noisy pixels in the level2.evt file, extra rows are filled as -1
| Pixel properties | Quadrant properties | ||||||
|---|---|---|---|---|---|---|---|
| Quadrant | DetID | PixID | Counts | Sigma | Mean | Median | Sigma |
| A | 1 | 162 | 9328 | 52.21 | 816 | 801 | 163.3 |
| A | 0 | 226 | 7339 | 40.03 | 816 | 801 | 163.3 |
| A | 12 | 194 | 6145 | 32.72 | 816 | 801 | 163.3 |
| B | 0 | 219 | 141704 | 927.41 | 825 | 809 | 151.9 |
| B | 12 | 111 | 17046 | 106.88 | 825 | 809 | 151.9 |
| B | 11 | 111 | 14544 | 90.41 | 825 | 809 | 151.9 |
| C | 3 | 233 | 185680 | 1006.67 | 808 | 817 | 183.6 |
| C | 13 | 61 | 5913 | 27.75 | 808 | 817 | 183.6 |
| C | 14 | 234 | 4227 | 18.57 | 808 | 817 | 183.6 |
| D | 8 | 195 | 161917 | 856.07 | 795 | 774 | 188.2 |
| D | 13 | 249 | 52131 | 272.83 | 795 | 774 | 188.2 |
| D | 2 | 136 | 41178 | 214.65 | 795 | 774 | 188.2 |
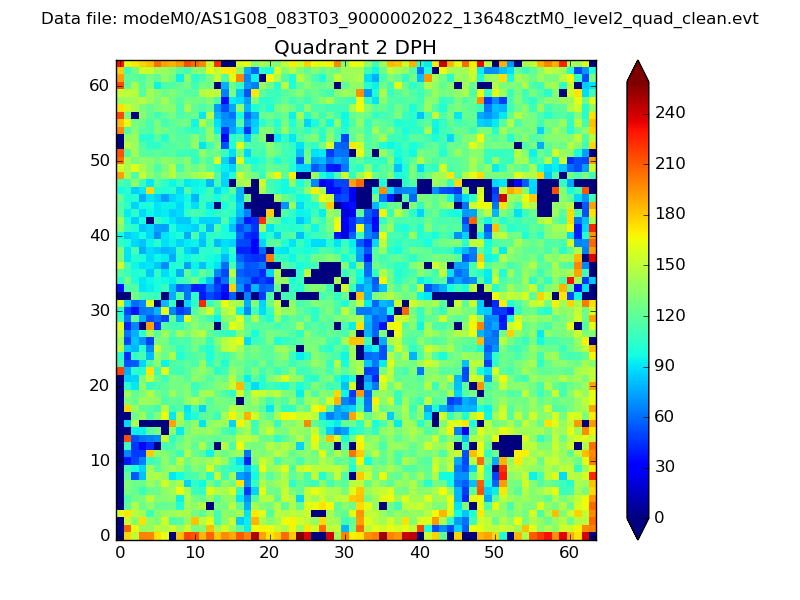
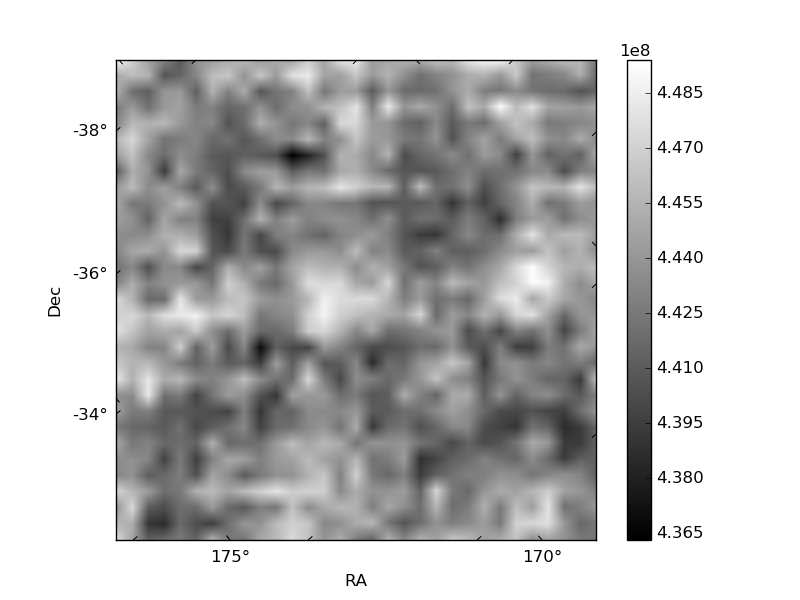
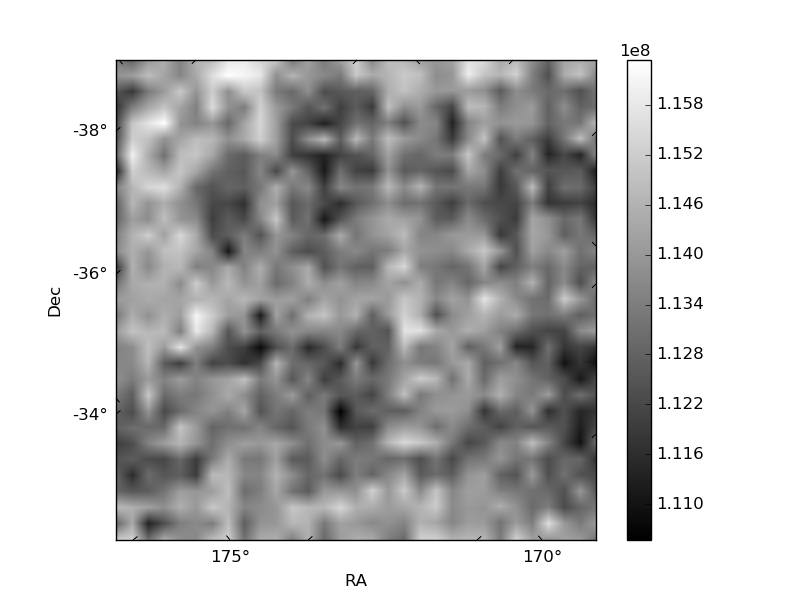
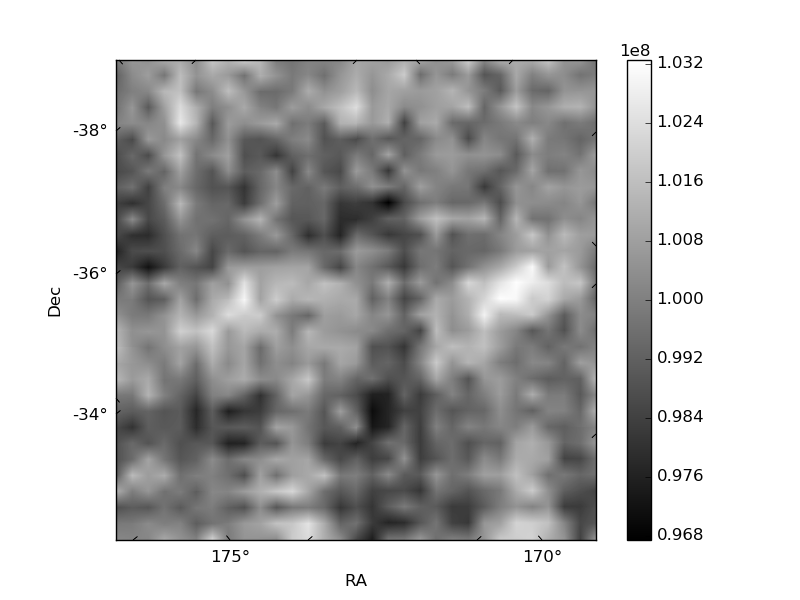
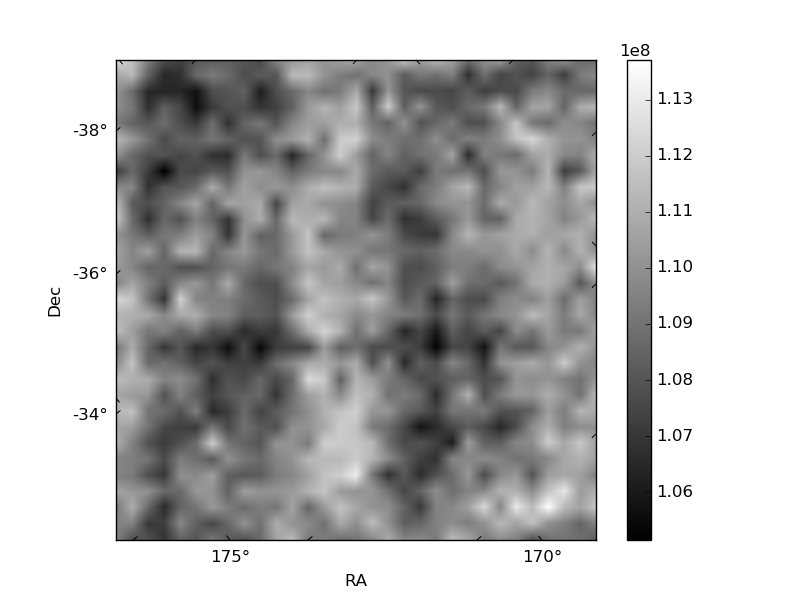
Histogram calculated using DETX and DETY for each event in the final _common_clean file
| Quadrant A | 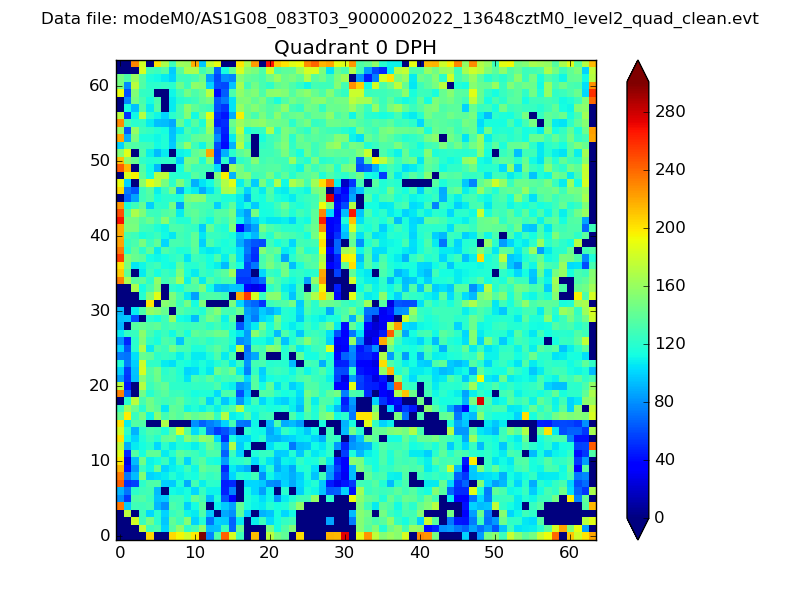 |
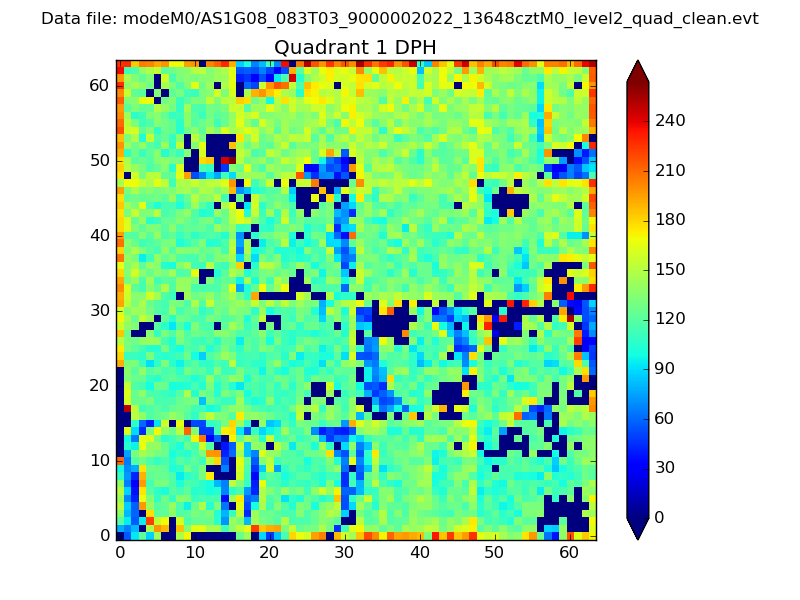 |
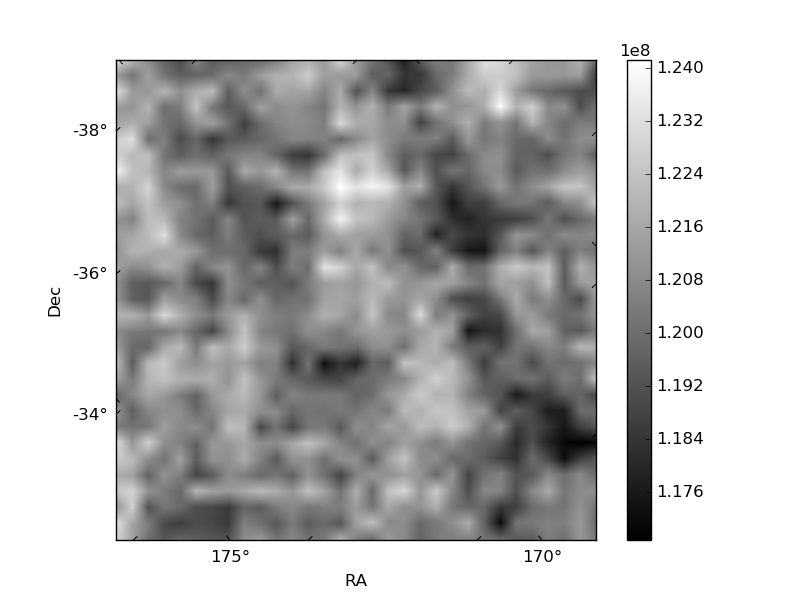
Quadrant B |
|---|---|---|---|
| Quadrant D | 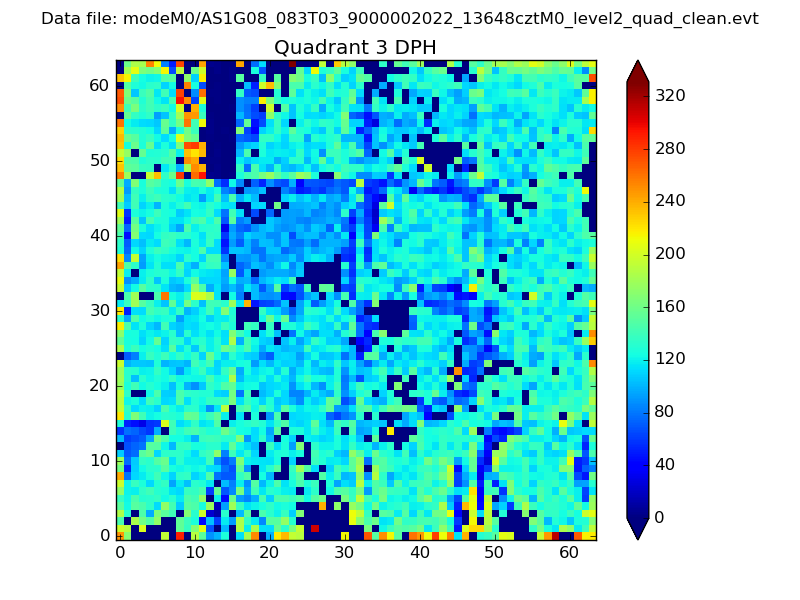 |
 |
Quadrant C |
| Plot type | Count rate plots | Images |
|---|---|---|
| Comparison with Poisson distribution Blue bars denote a histogram of data divided into 1 sec bins. Red curve is a Poisson curve with rate = median count rate of data. |
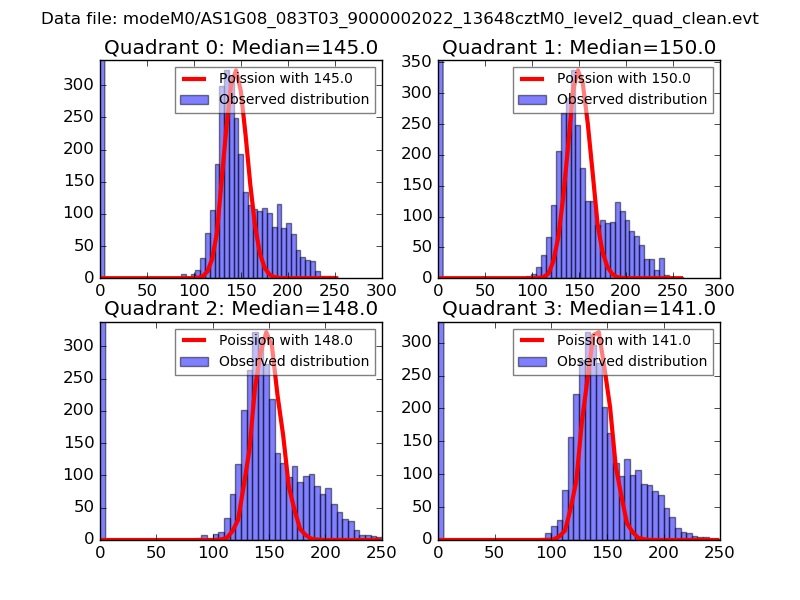 |
 |
| Quadrant-wise count rates Data is divided into 100 sec bins |
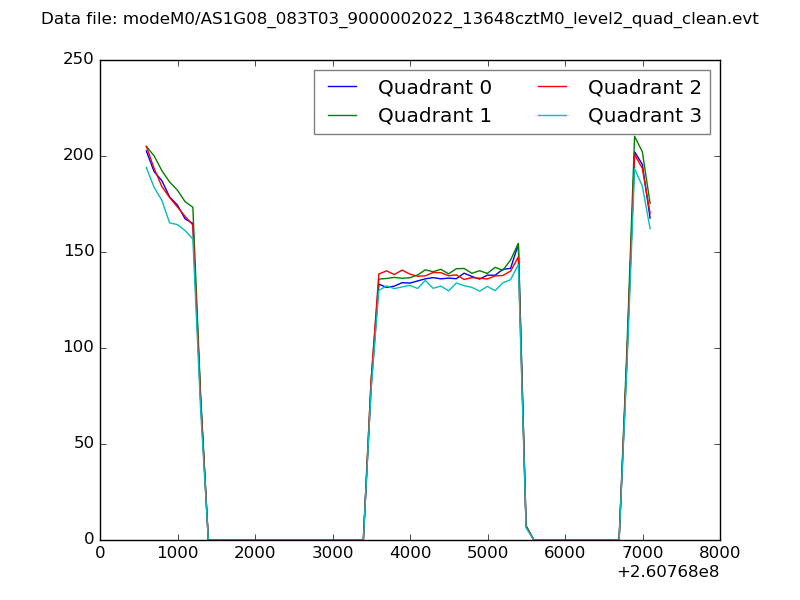 |
|
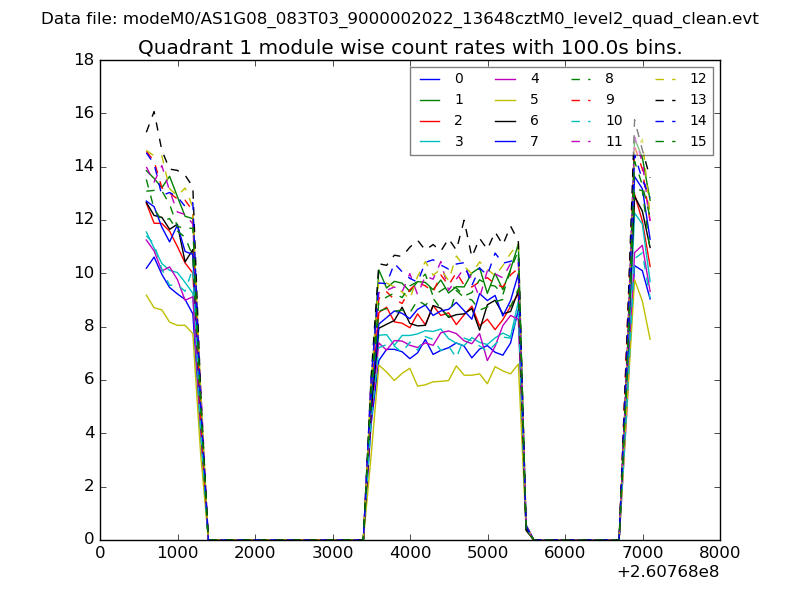
| Module-wise count rates for Quadrant A Data is divided into 100 sec bins |
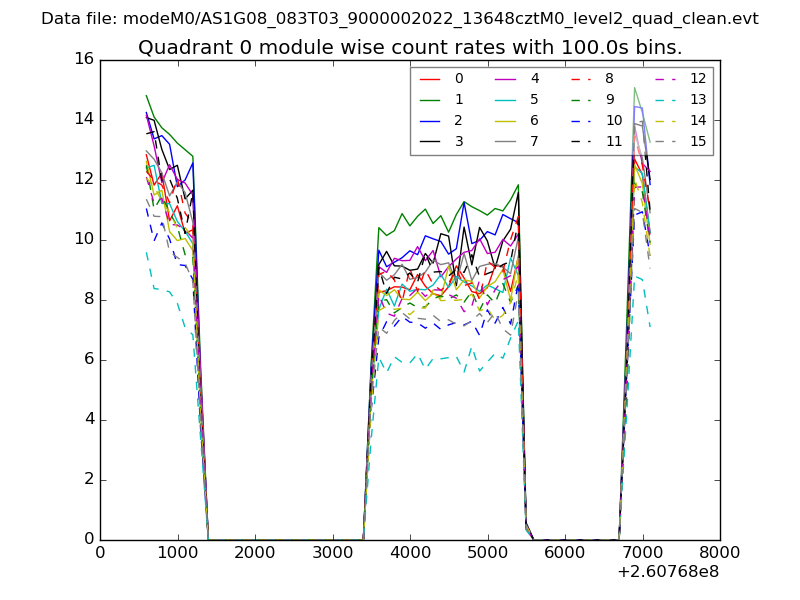 |
 |
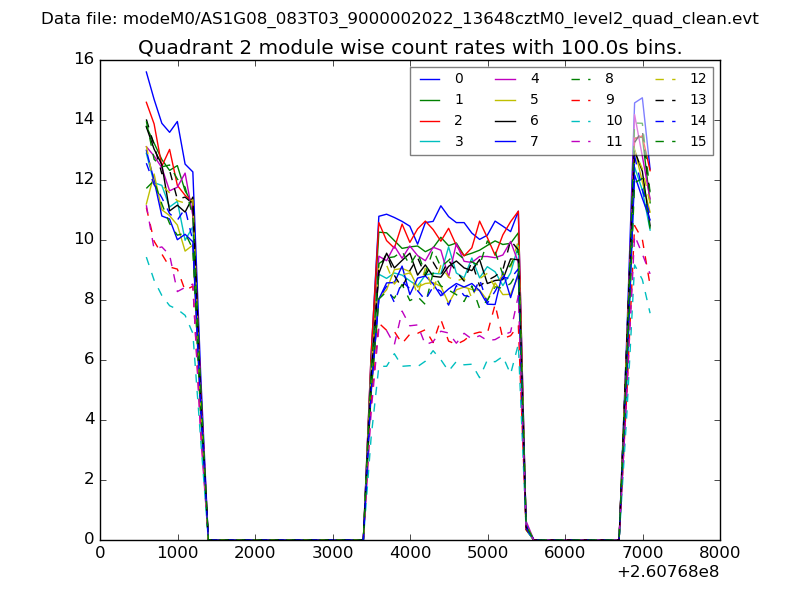
| Module-wise count rates for Quadrant B Data is divided into 100 sec bins |
 |
 |
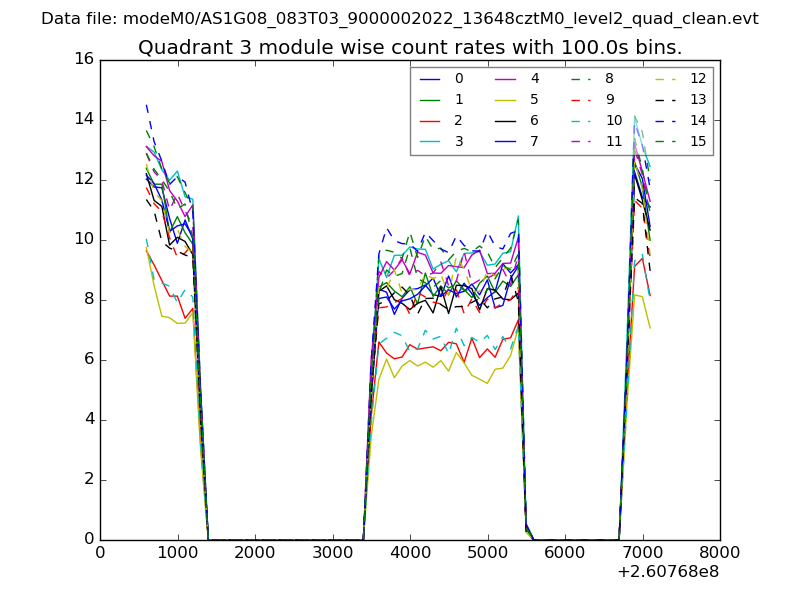
| Module-wise count rates for Quadrant C Data is divided into 100 sec bins |
 |
 |
| Module-wise count rates for Quadrant D Data is divided into 100 sec bins |
 |
 |
| Parameter | Plot |
|---|---|
| CZT HV Monitor | 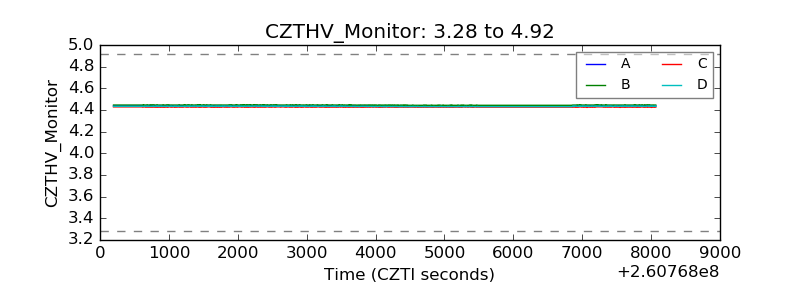 |
| D_VDD | 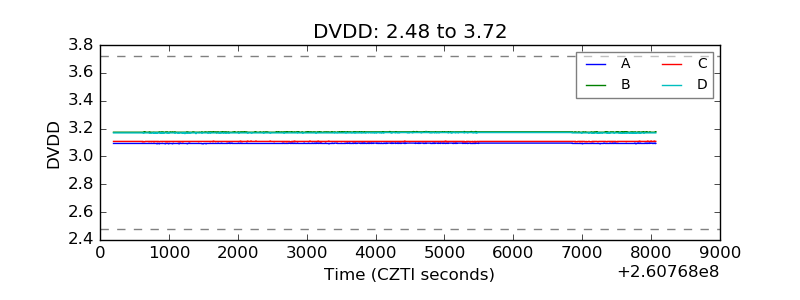 |
| Temperature 1 | 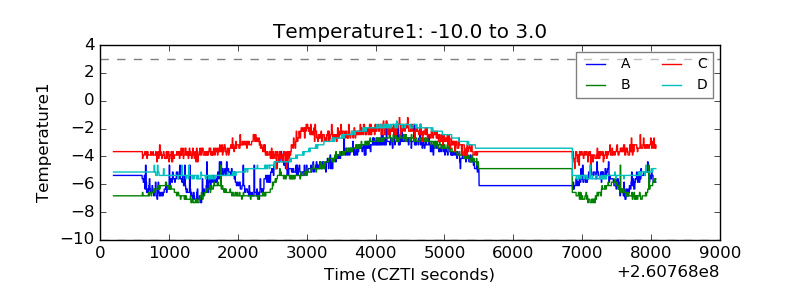 |
| Veto HV Monitor |  |
| Veto LLD | 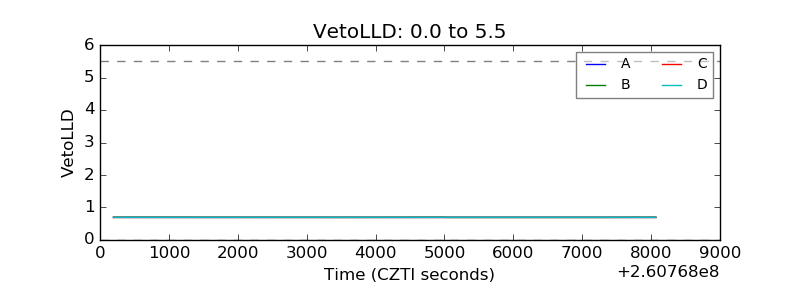 |
| Alpha Counter | 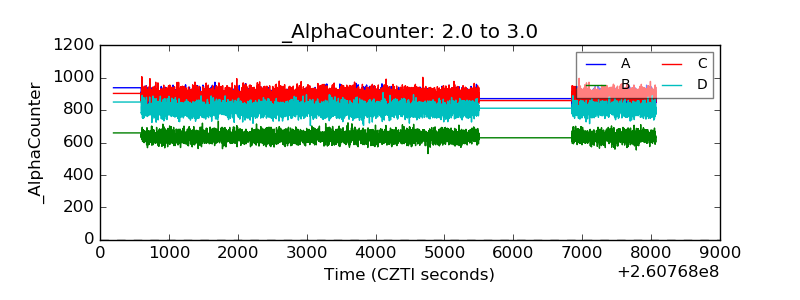 |
| _CPM_Rate | 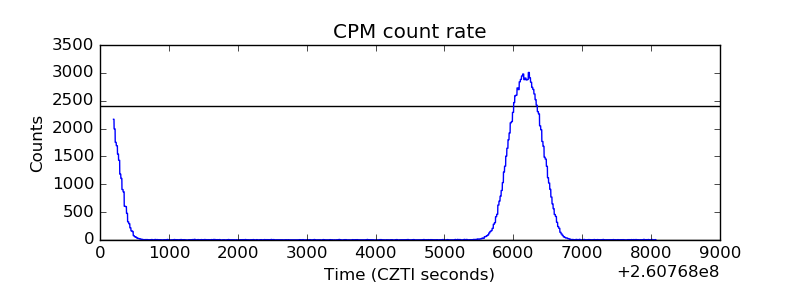 |
| CZT Counter | 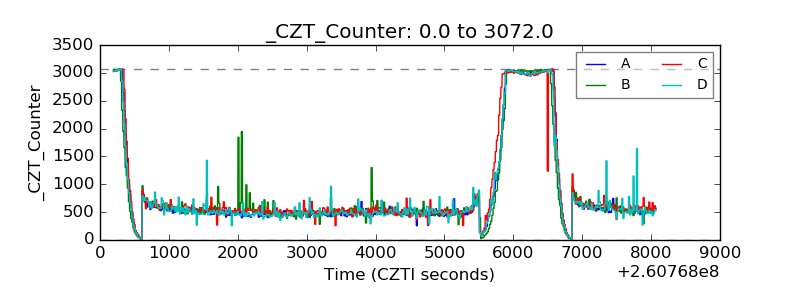 |
| +2.5 Volts monitor |  |
| +5 Volts monitor |  |
| _ROLL_ROT | 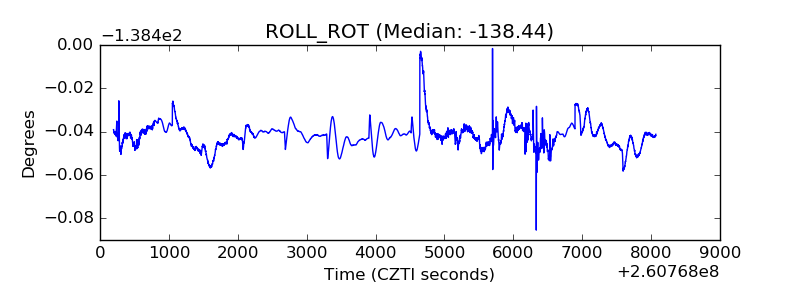 |
| _Roll_DEC | 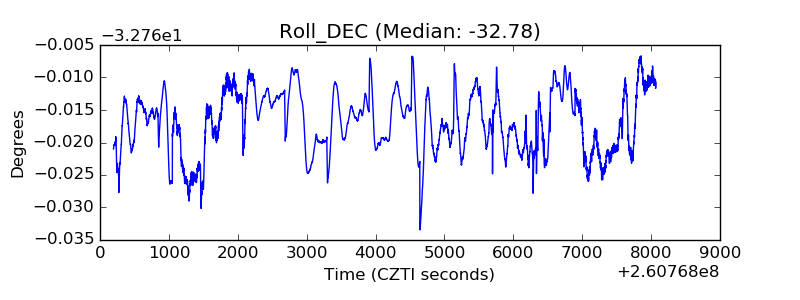 |
| _Roll_RA | 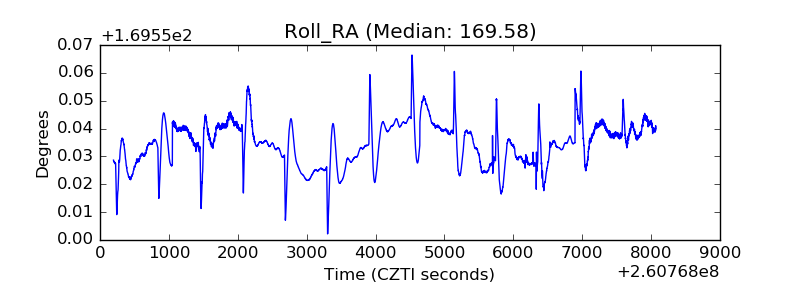 |
| Veto Counter | 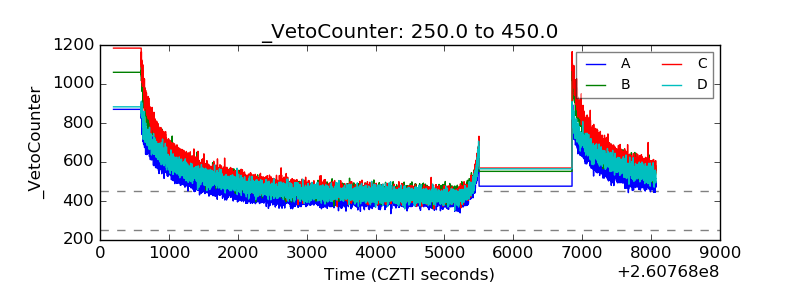 |