| Param | Original file | Final file |
|---|---|---|
| Filename | modeM0/AS1G08_083T03_9000002022_13650cztM0_level2.evt | modeM0/AS1G08_083T03_9000002022_13650cztM0_level2_quad_clean.evt |
| Size (bytes) | 468,596,160 | 68,607,360 |
| Size | 446.9 MB | 65.4 MB |
| Events in quadrant A | 3,297,989 | 412,060 |
| Events in quadrant B | 3,488,002 | 418,999 |
| Events in quadrant C | 3,433,805 | 411,733 |
| Events in quadrant D | 3,546,635 | 397,475 |
| Mode M0 | |||
|---|---|---|---|
| Quadrant | BADHDUFLAG | Total packets | Discarded packets |
| A | 0 | 13440 | 3 |
| B | 0 | 14023 | 2 |
| C | 0 | 13836 | 2 |
| D | 0 | 14149 | 2 |
| Mode M9 | |||
|---|---|---|---|
| Quadrant | BADHDUFLAG | Total packets | Discarded packets |
| A | 0 | 26 | 0 |
| B | 0 | 26 | 0 |
| C | 0 | 26 | 0 |
| D | 0 | 26 | 0 |
| Mode SS | |||
|---|---|---|---|
| Quadrant | BADHDUFLAG | Total packets | Discarded packets |
| A | 0 | 130 | 0 |
| B | 0 | 130 | 0 |
| C | 0 | 130 | 0 |
| D | 0 | 130 | 0 |
| Quadrant | Total seconds | Saturated seconds | Saturation percentage |
|---|---|---|---|
| A | 6257 | 107 | 1.710085% |
| B | 6257 | 143 | 2.285440% |
| C | 6257 | 108 | 1.726067% |
| D | 6257 | 103 | 1.646156% |
Noise dominated data is calculated using 1-second bins in cleaned event files. If a bin has >2000 counts, and if more than 50% of those come from <1% of pixels, then it is considered to be noise-dominated and hence unusable.
| Quadrant | # 1 sec bins | Bins with >0 counts | Bins with >2000 counts | High rate bins dominated by noise | Noise dominated (total time) | Noise dominated (detector-on time) | Marked lightcurve |
|---|---|---|---|---|---|---|---|
| A | 8928 | 6260 | 10 | 10 | 0.11% | 0.16% | 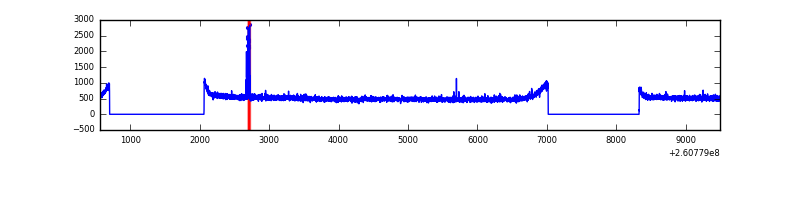 |
| B | 8928 | 6260 | 6 | 6 | 0.07% | 0.10% | 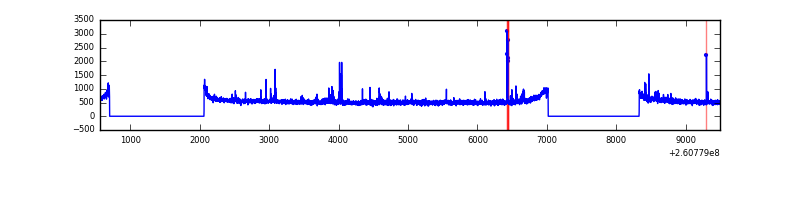 |
| C | 8928 | 6260 | 2 | 2 | 0.02% | 0.03% | 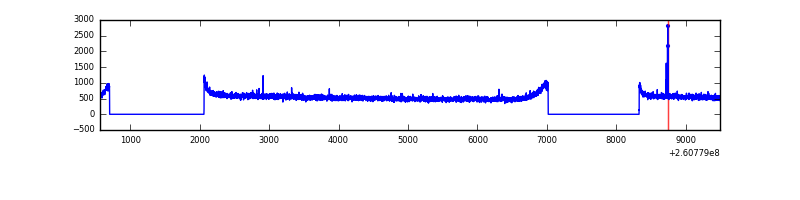 |
| D | 8928 | 6260 | 12 | 12 | 0.13% | 0.19% | 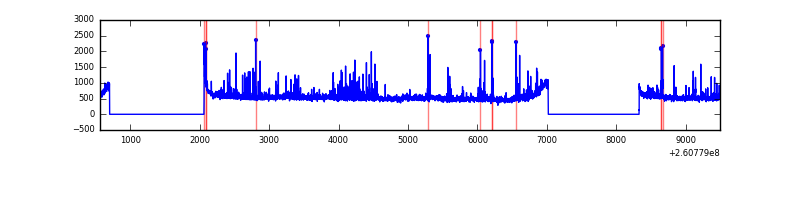 |
Top three noisy pixels from each quadrant. If the there are fewer than three noisy pixels in the level2.evt file, extra rows are filled as -1
| Pixel properties | Quadrant properties | ||||||
|---|---|---|---|---|---|---|---|
| Quadrant | DetID | PixID | Counts | Sigma | Mean | Median | Sigma |
| A | 12 | 96 | 45085 | 260.67 | 845 | 828 | 169.8 |
| A | 0 | 226 | 7633 | 40.08 | 845 | 828 | 169.8 |
| A | 12 | 194 | 6490 | 33.35 | 845 | 828 | 169.8 |
| B | 3 | 64 | 59969 | 372.55 | 847 | 828 | 158.7 |
| B | 0 | 219 | 51199 | 317.31 | 847 | 828 | 158.7 |
| B | 0 | 214 | 39878 | 245.99 | 847 | 828 | 158.7 |
| C | 3 | 233 | 188227 | 991.24 | 830 | 835 | 189.0 |
| C | 14 | 234 | 10967 | 53.59 | 830 | 835 | 189.0 |
| C | 13 | 61 | 5969 | 27.16 | 830 | 835 | 189.0 |
| D | 8 | 195 | 325782 | 1511.17 | 817 | 800 | 215.1 |
| D | 2 | 136 | 40656 | 185.33 | 817 | 800 | 215.1 |
| D | 13 | 249 | 34731 | 157.78 | 817 | 800 | 215.1 |
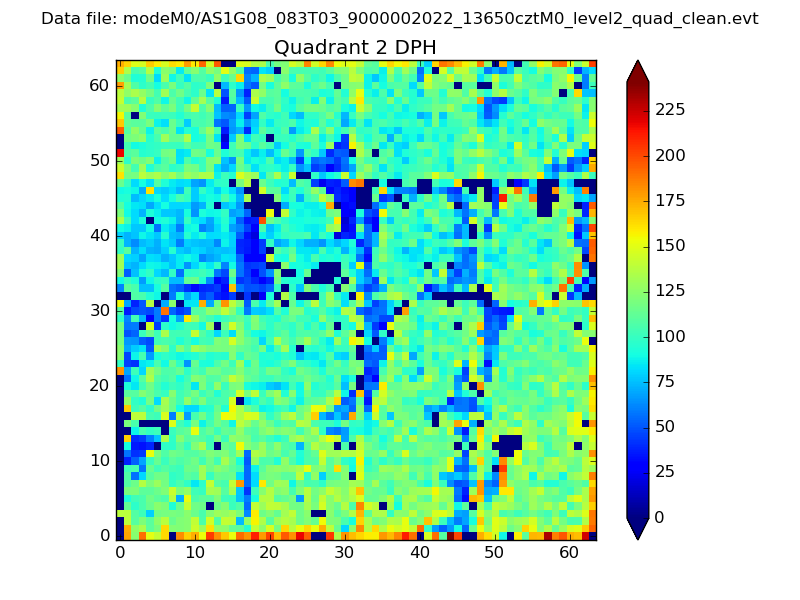
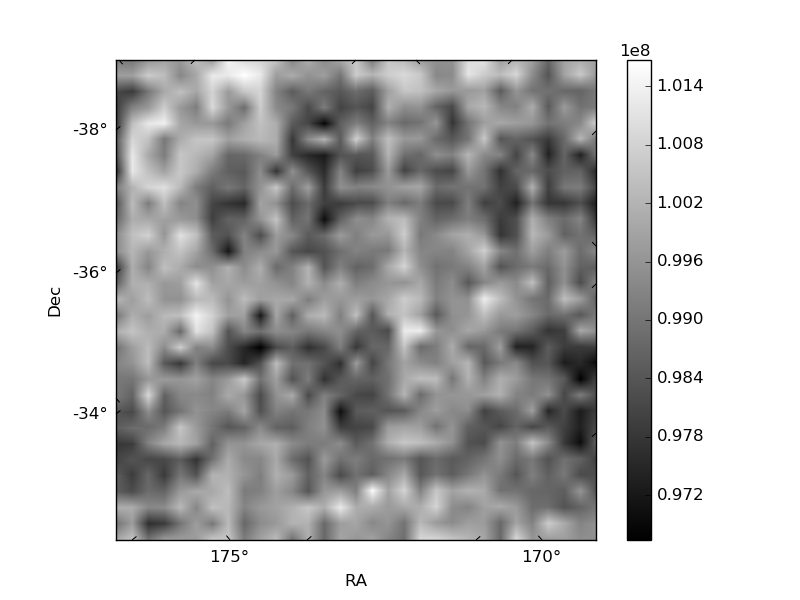
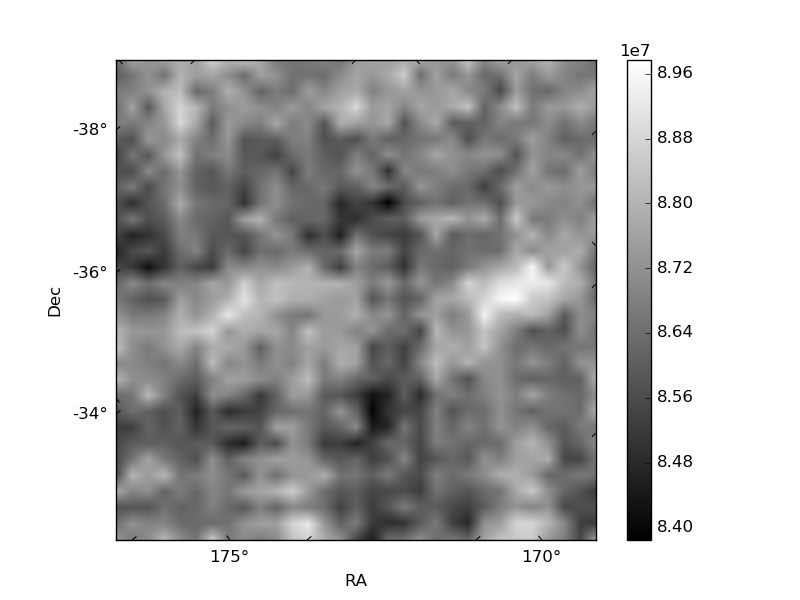
Histogram calculated using DETX and DETY for each event in the final _common_clean file
| Quadrant A | 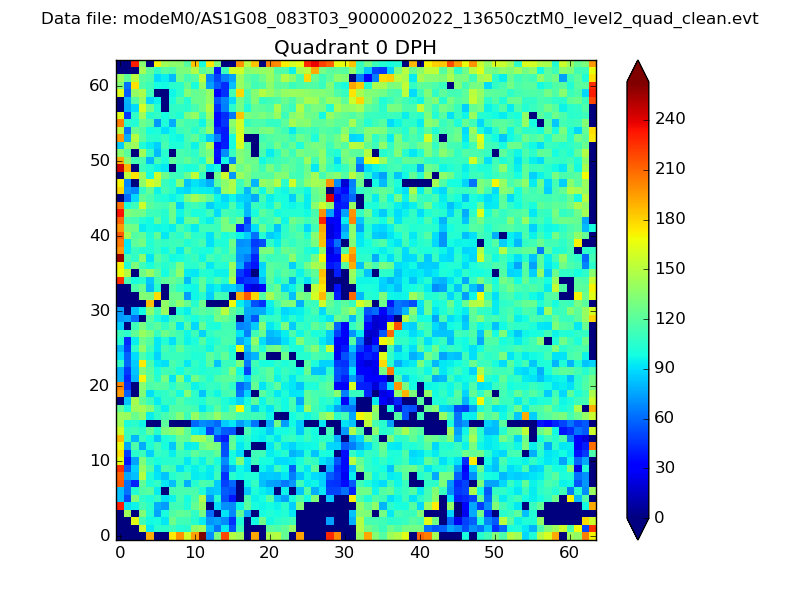 |
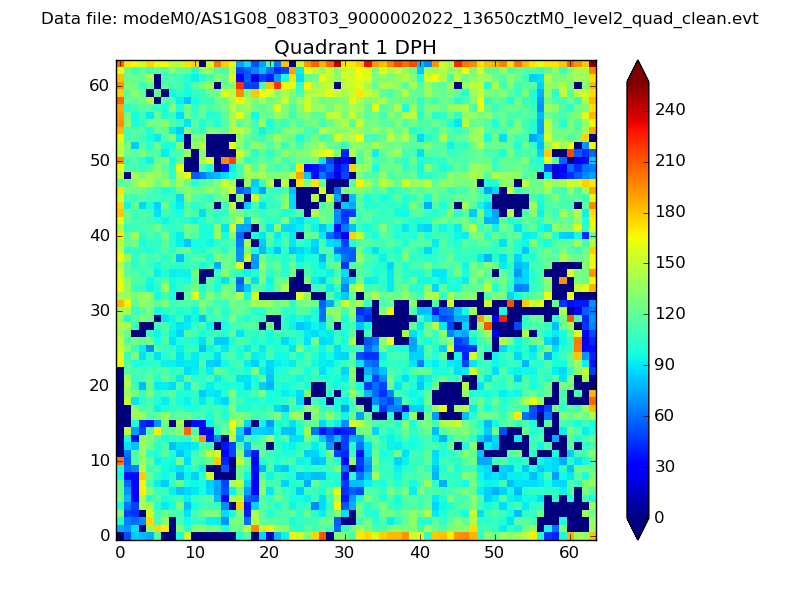 |
Quadrant B |
|---|---|---|---|
| Quadrant D | 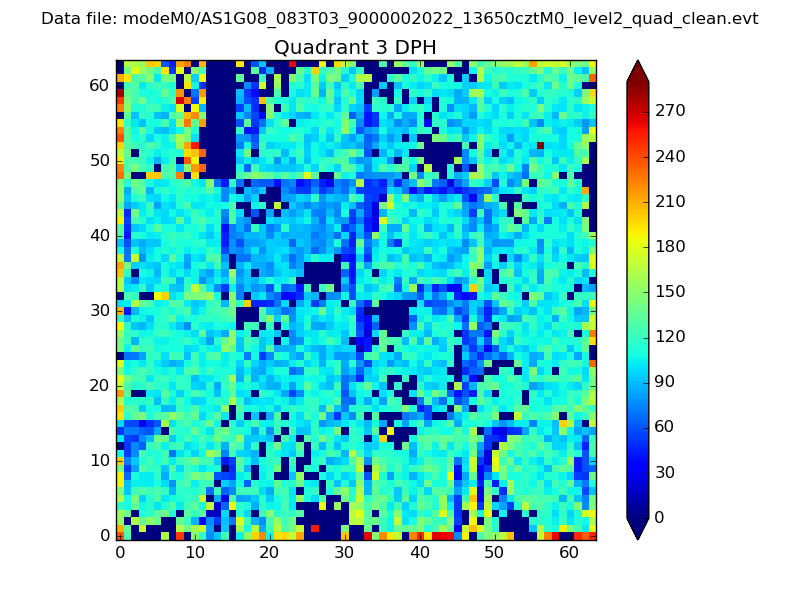 |
 |
Quadrant C |
| Plot type | Count rate plots | Images |
|---|---|---|
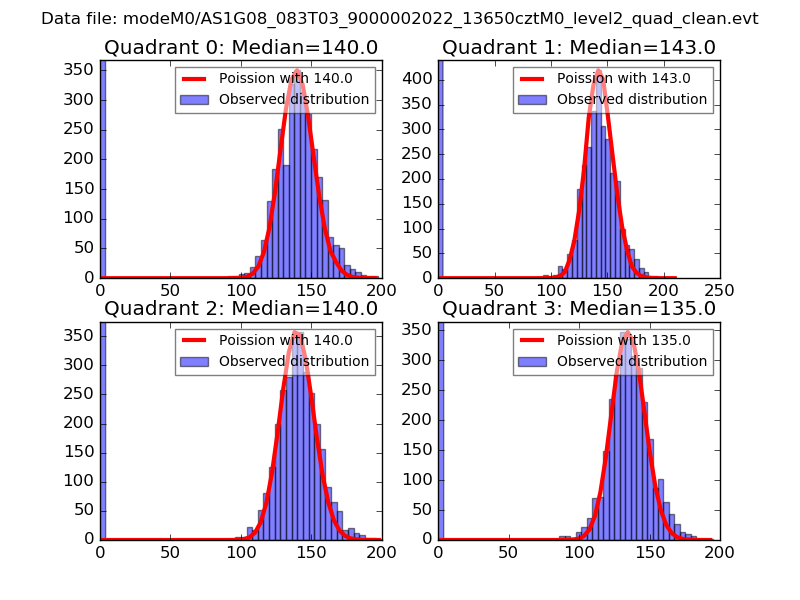
| Comparison with Poisson distribution Blue bars denote a histogram of data divided into 1 sec bins. Red curve is a Poisson curve with rate = median count rate of data. |
 |
 |
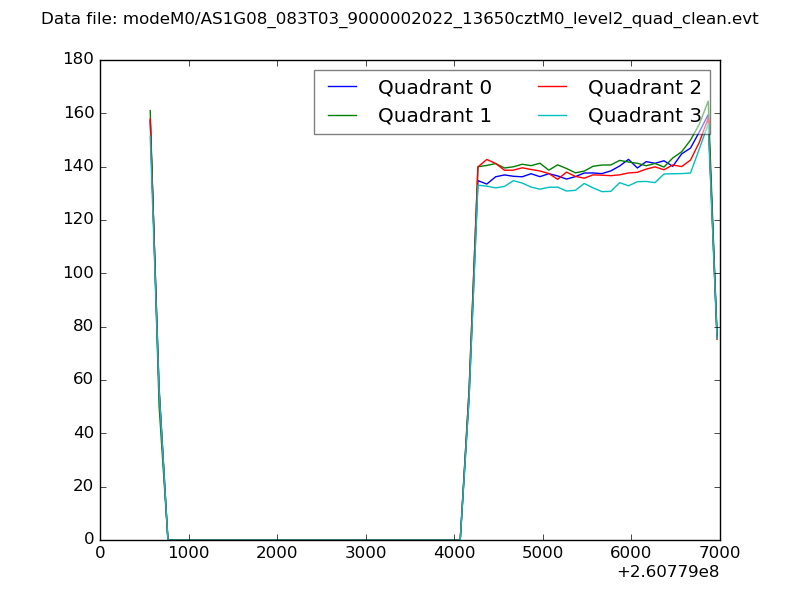
| Quadrant-wise count rates Data is divided into 100 sec bins |
 |
|
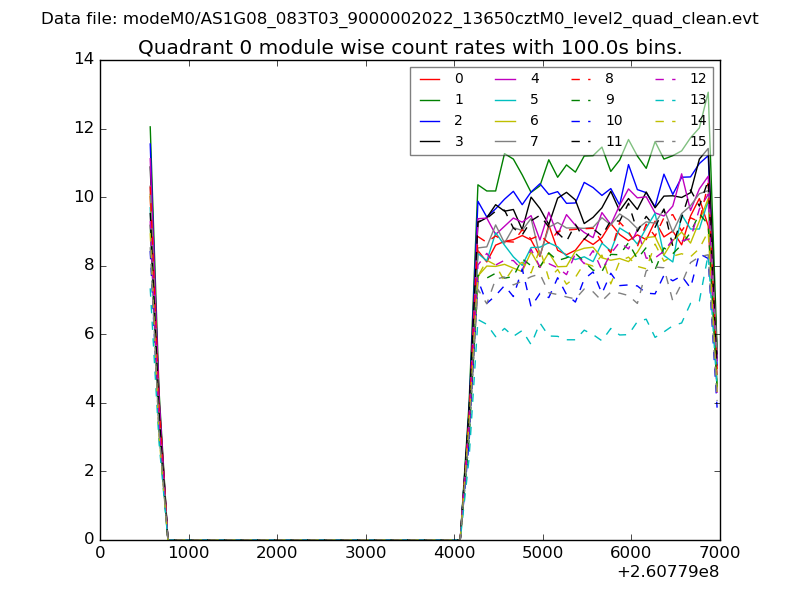
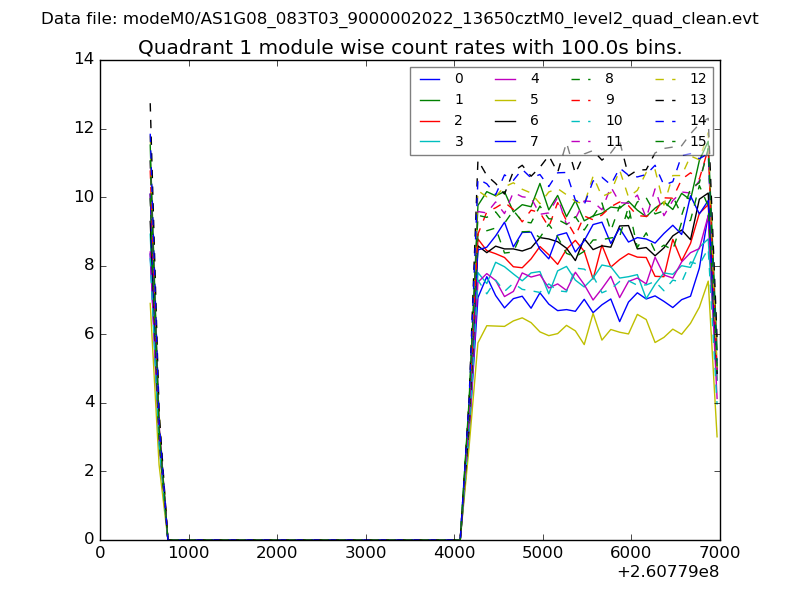
| Module-wise count rates for Quadrant A Data is divided into 100 sec bins |
 |
 |
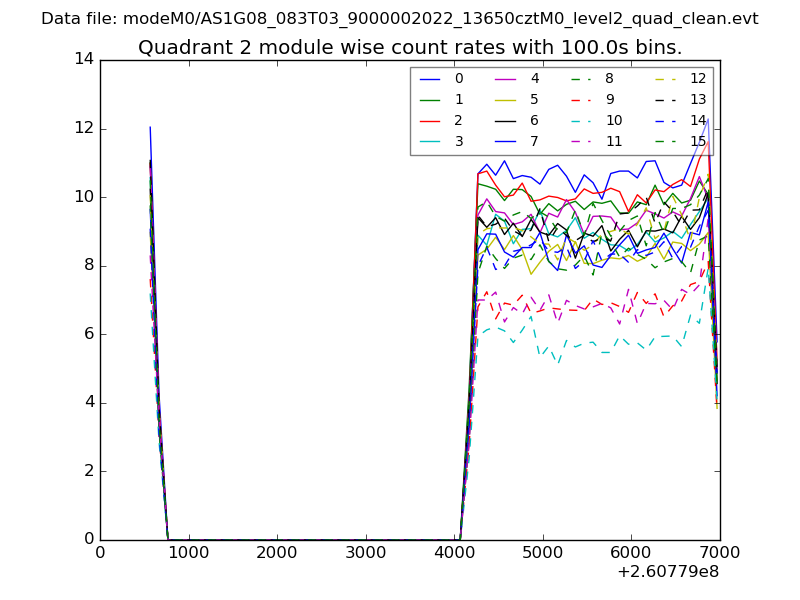
| Module-wise count rates for Quadrant B Data is divided into 100 sec bins |
 |
 |
| Module-wise count rates for Quadrant C Data is divided into 100 sec bins |
 |
 |
| Module-wise count rates for Quadrant D Data is divided into 100 sec bins |
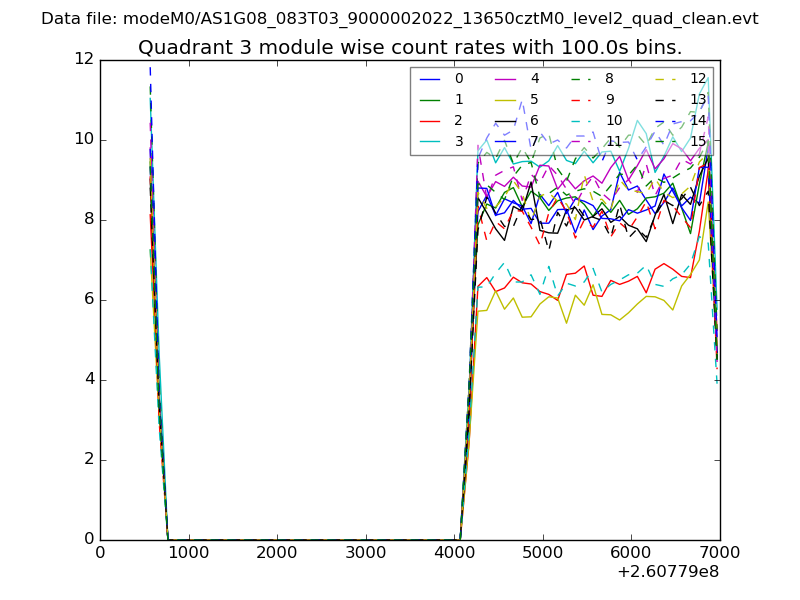 |
 |
| Parameter | Plot |
|---|---|
| CZT HV Monitor | 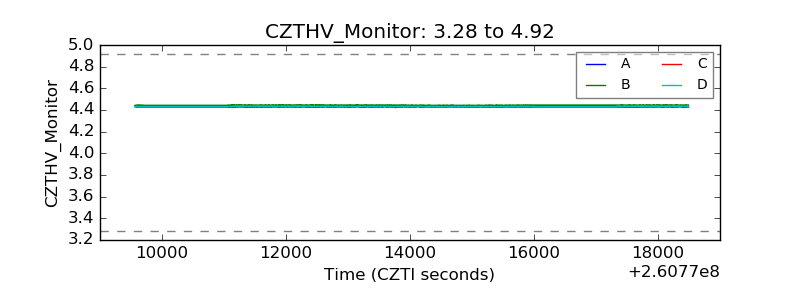 |
| D_VDD | 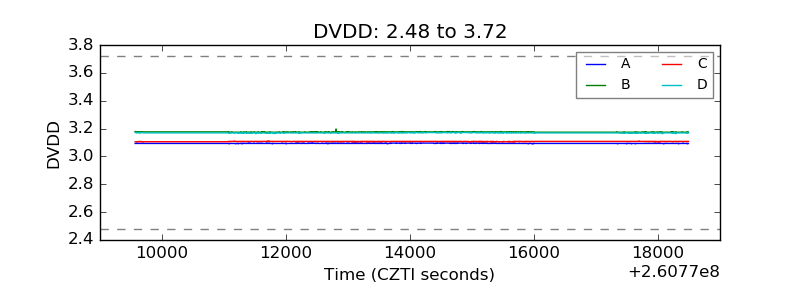 |
| Temperature 1 | 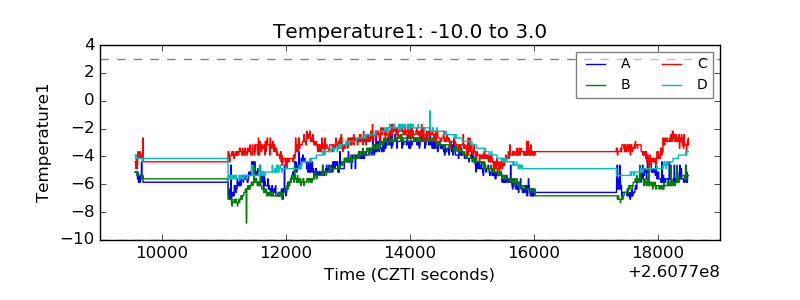 |
| Veto HV Monitor | 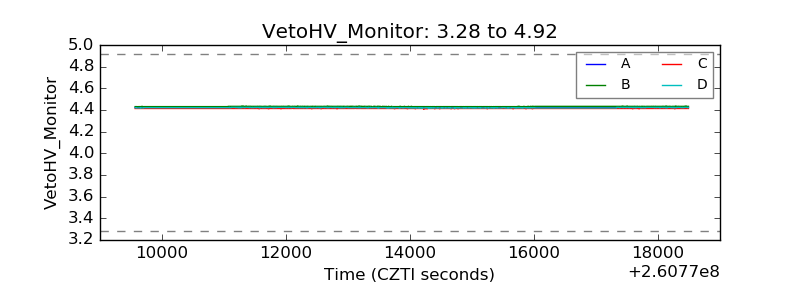 |
| Veto LLD | 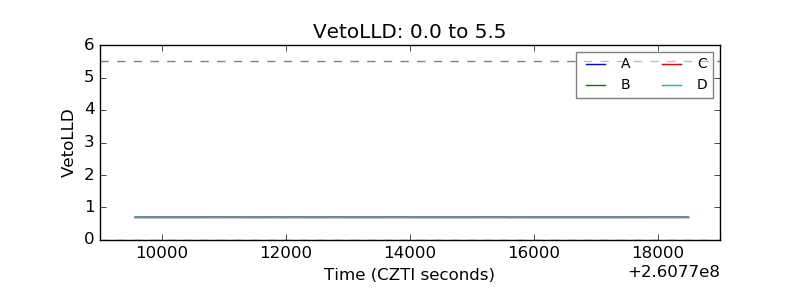 |
| Alpha Counter | 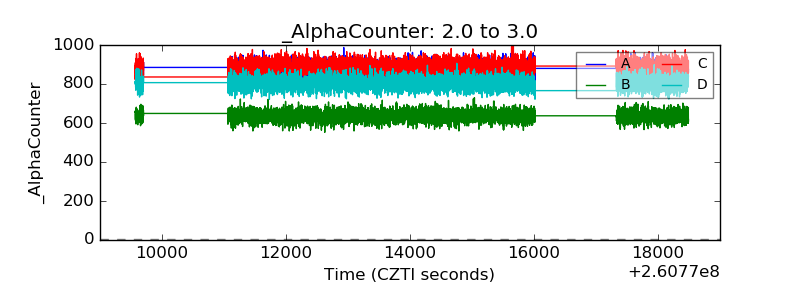 |
| _CPM_Rate | 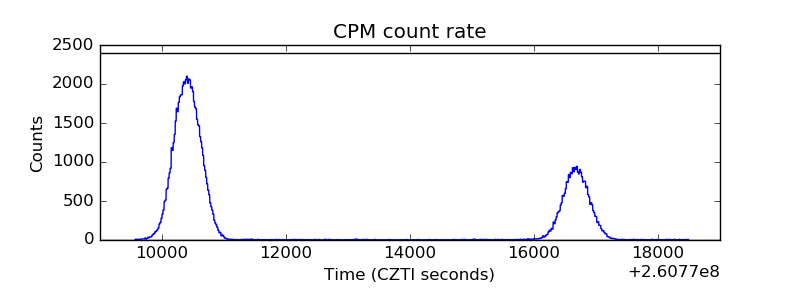 |
| CZT Counter | 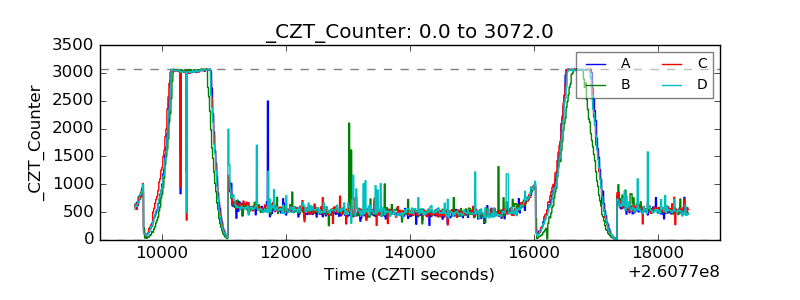 |
| +2.5 Volts monitor |  |
| +5 Volts monitor |  |
| _ROLL_ROT | 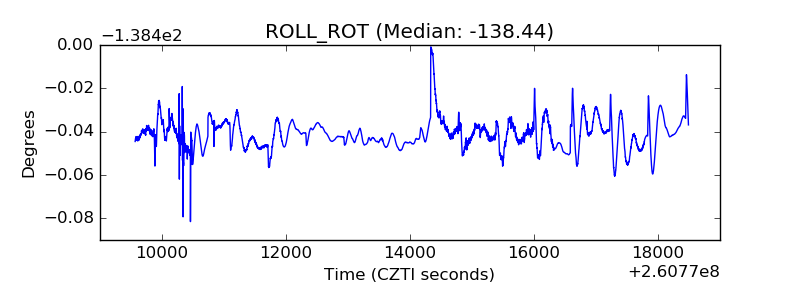 |
| _Roll_DEC |  |
| _Roll_RA | 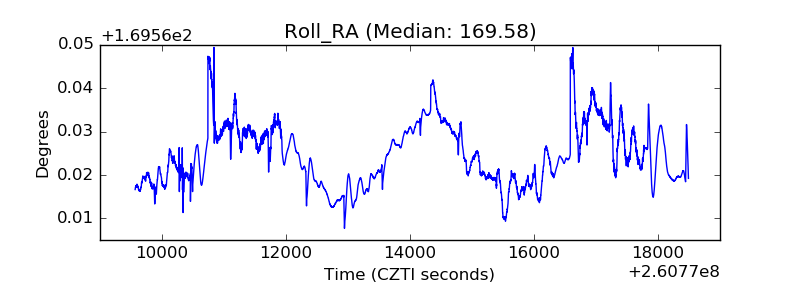 |
| Veto Counter | 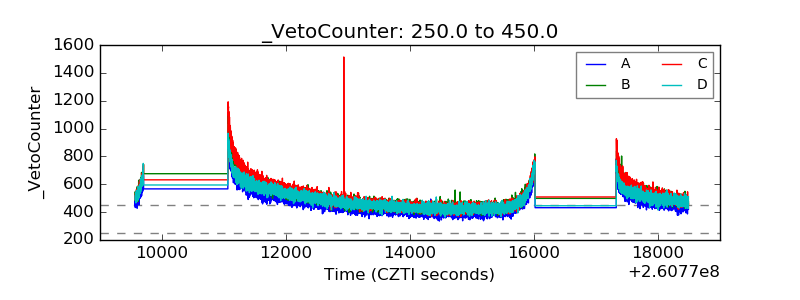 |