| Param | Original file | Final file |
|---|---|---|
| Filename | modeM0/AS1G08_083T03_9000002022_13651cztM0_level2.evt | modeM0/AS1G08_083T03_9000002022_13651cztM0_level2_quad_clean.evt |
| Size (bytes) | 466,744,320 | 76,680,000 |
| Size | 445.1 MB | 73.1 MB |
| Events in quadrant A | 3,282,074 | 467,420 |
| Events in quadrant B | 3,422,135 | 475,709 |
| Events in quadrant C | 3,388,947 | 466,548 |
| Events in quadrant D | 3,593,067 | 451,164 |
| Mode M0 | |||
|---|---|---|---|
| Quadrant | BADHDUFLAG | Total packets | Discarded packets |
| A | 0 | 13770 | 3 |
| B | 0 | 14137 | 2 |
| C | 0 | 14003 | 2 |
| D | 0 | 14549 | 2 |
| Mode M9 | |||
|---|---|---|---|
| Quadrant | BADHDUFLAG | Total packets | Discarded packets |
| A | 0 | 15 | 0 |
| B | 0 | 15 | 0 |
| C | 0 | 15 | 0 |
| D | 0 | 16 | 0 |
| Mode SS | |||
|---|---|---|---|
| Quadrant | BADHDUFLAG | Total packets | Discarded packets |
| A | 0 | 134 | 0 |
| B | 0 | 134 | 0 |
| C | 0 | 134 | 0 |
| D | 0 | 134 | 0 |
| Quadrant | Total seconds | Saturated seconds | Saturation percentage |
|---|---|---|---|
| A | 6614 | 104 | 1.572422% |
| B | 6614 | 111 | 1.678258% |
| C | 6614 | 91 | 1.375869% |
| D | 6614 | 101 | 1.527064% |
Noise dominated data is calculated using 1-second bins in cleaned event files. If a bin has >2000 counts, and if more than 50% of those come from <1% of pixels, then it is considered to be noise-dominated and hence unusable.
| Quadrant | # 1 sec bins | Bins with >0 counts | Bins with >2000 counts | High rate bins dominated by noise | Noise dominated (total time) | Noise dominated (detector-on time) | Marked lightcurve |
|---|---|---|---|---|---|---|---|
| A | 7640 | 6616 | 0 | 0 | 0.00% | 0.00% | 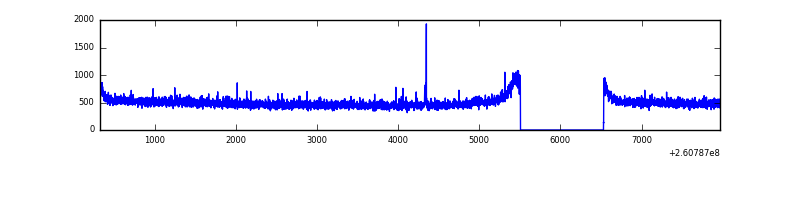 |
| B | 7640 | 6616 | 2 | 2 | 0.03% | 0.03% | 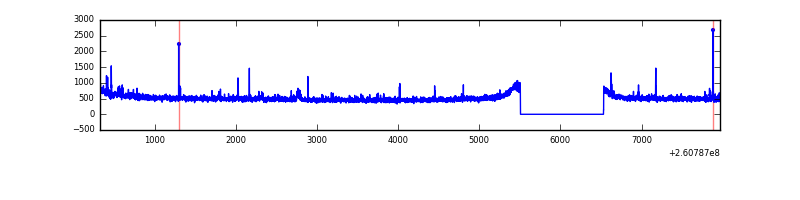 |
| C | 7640 | 6616 | 2 | 2 | 0.03% | 0.03% | 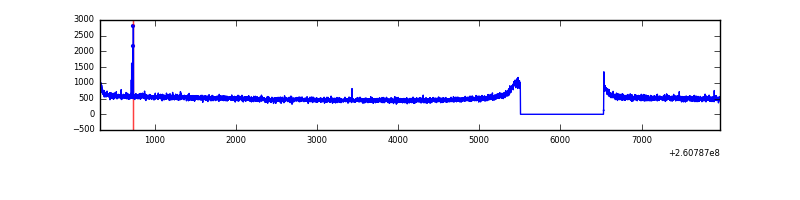 |
| D | 7640 | 6616 | 9 | 9 | 0.12% | 0.14% | 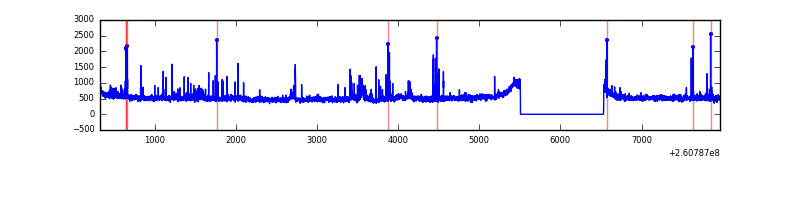 |
Top three noisy pixels from each quadrant. If the there are fewer than three noisy pixels in the level2.evt file, extra rows are filled as -1
| Pixel properties | Quadrant properties | ||||||
|---|---|---|---|---|---|---|---|
| Quadrant | DetID | PixID | Counts | Sigma | Mean | Median | Sigma |
| A | 1 | 162 | 9268 | 48.88 | 849 | 831 | 172.6 |
| A | 15 | 69 | 8349 | 43.55 | 849 | 831 | 172.6 |
| A | 0 | 226 | 7414 | 38.14 | 849 | 831 | 172.6 |
| B | 0 | 219 | 26118 | 156.38 | 848 | 828 | 161.7 |
| B | 0 | 214 | 23940 | 142.91 | 848 | 828 | 161.7 |
| B | 12 | 111 | 18992 | 112.32 | 848 | 828 | 161.7 |
| C | 3 | 233 | 152260 | 794.64 | 828 | 832 | 190.6 |
| C | 14 | 234 | 9701 | 46.54 | 828 | 832 | 190.6 |
| C | 13 | 61 | 6137 | 27.84 | 828 | 832 | 190.6 |
| D | 8 | 195 | 292457 | 1441.83 | 823 | 803 | 202.3 |
| D | 5 | 222 | 61691 | 301.01 | 823 | 803 | 202.3 |
| D | 2 | 136 | 43970 | 213.4 | 823 | 803 | 202.3 |
Histogram calculated using DETX and DETY for each event in the final _common_clean file
| Quadrant A | 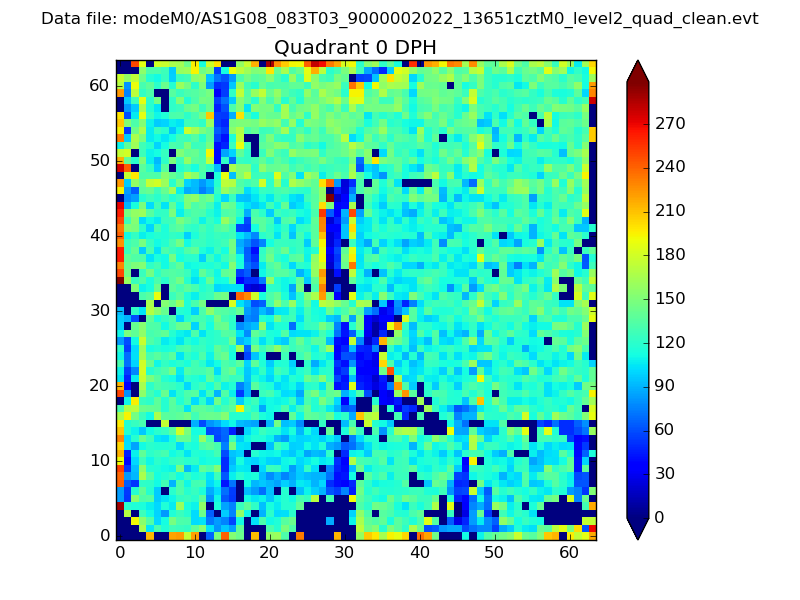 |
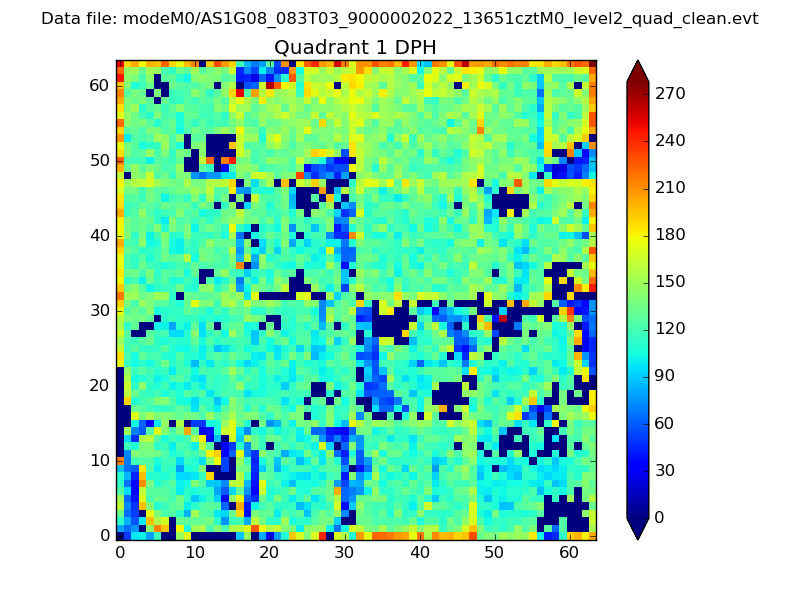 |
Quadrant B |
|---|---|---|---|
| Quadrant D | 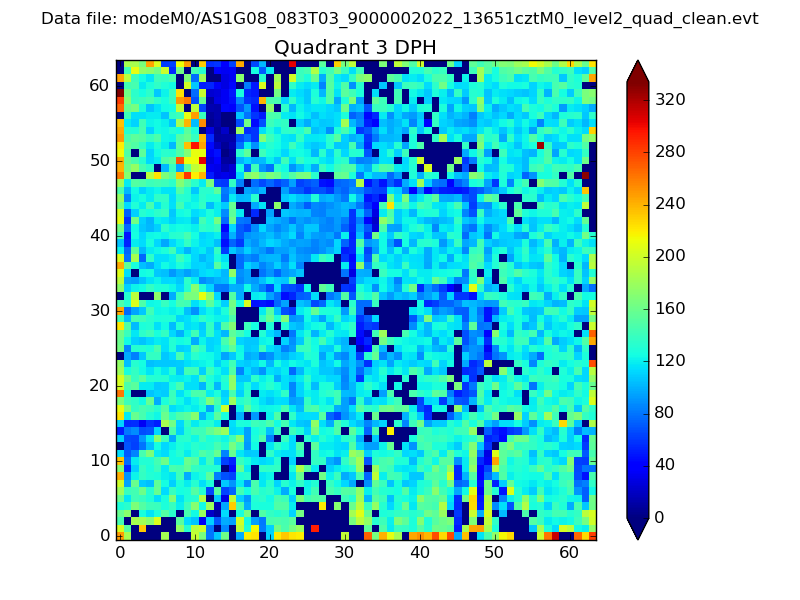 |
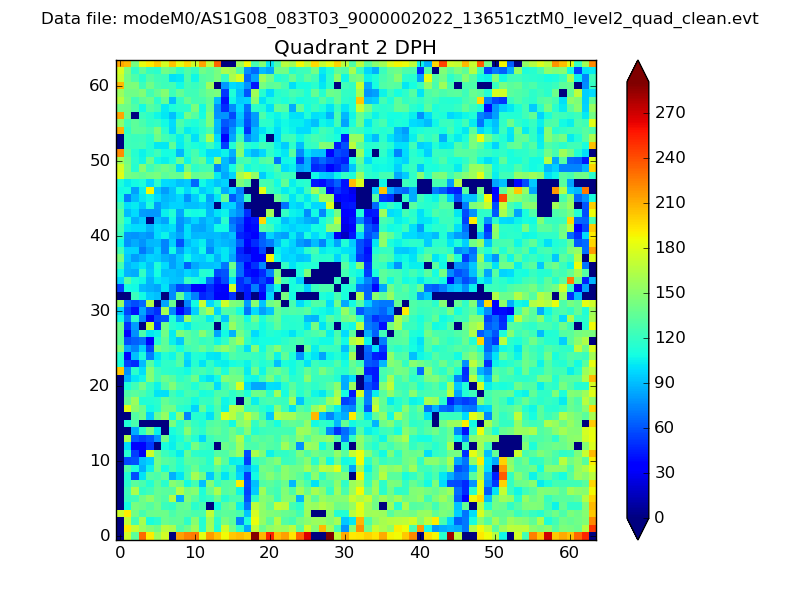 |
Quadrant C |
| Plot type | Count rate plots | Images |
|---|---|---|
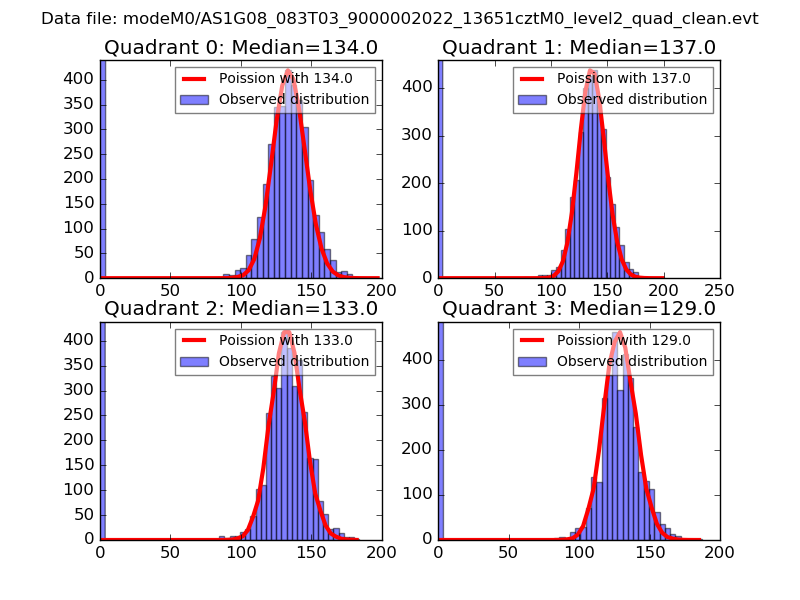
| Comparison with Poisson distribution Blue bars denote a histogram of data divided into 1 sec bins. Red curve is a Poisson curve with rate = median count rate of data. |
 |
 |
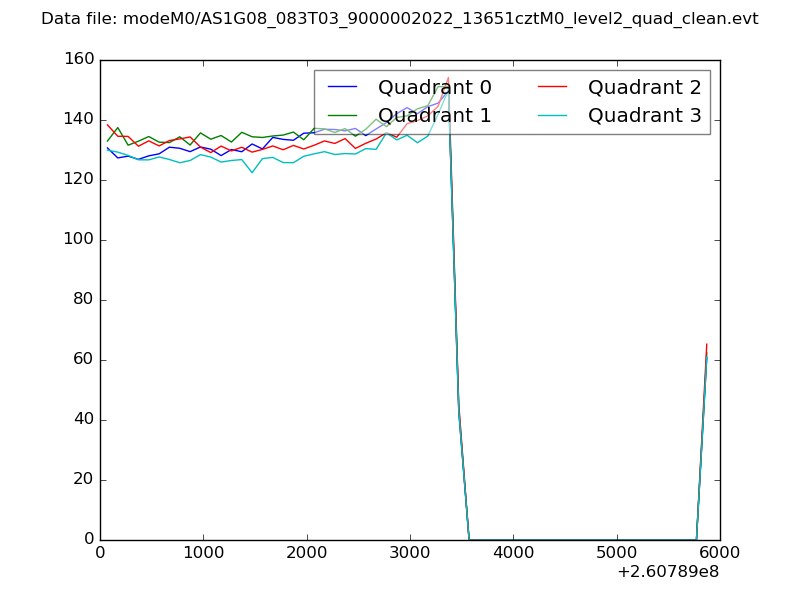
| Quadrant-wise count rates Data is divided into 100 sec bins |
 |
|
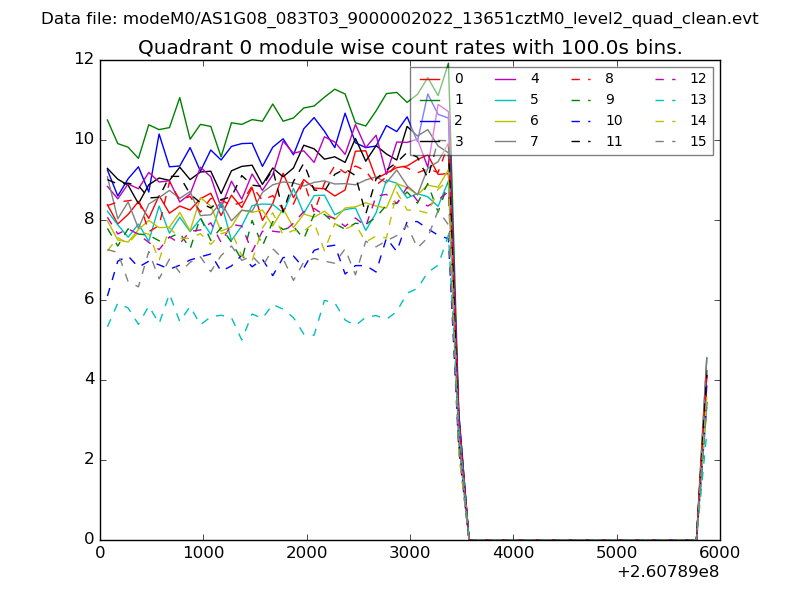
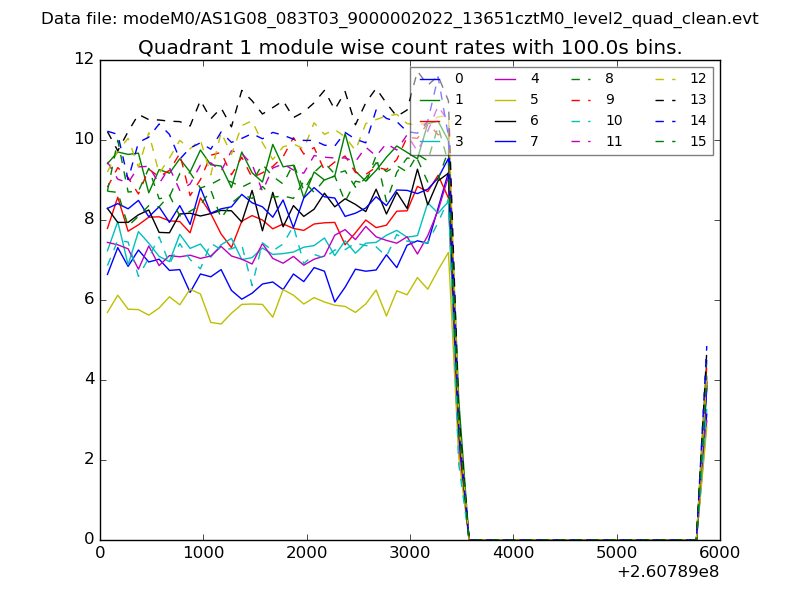
| Module-wise count rates for Quadrant A Data is divided into 100 sec bins |
 |
 |
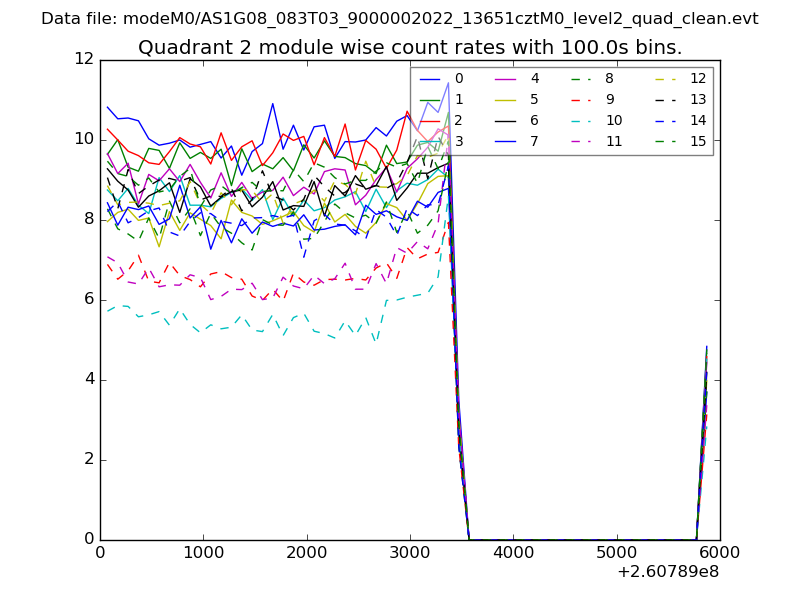
| Module-wise count rates for Quadrant B Data is divided into 100 sec bins |
 |
 |
| Module-wise count rates for Quadrant C Data is divided into 100 sec bins |
 |
 |
| Module-wise count rates for Quadrant D Data is divided into 100 sec bins |
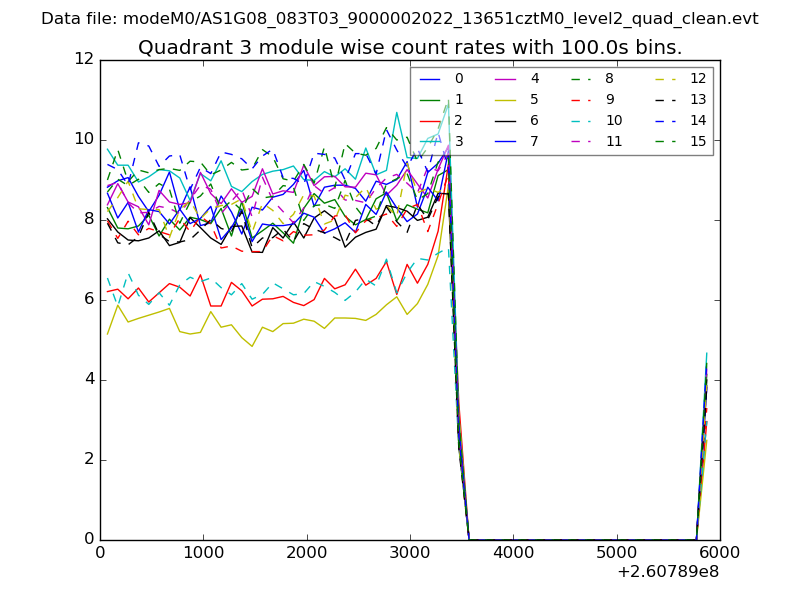 |
 |
| Parameter | Plot |
|---|---|
| CZT HV Monitor | 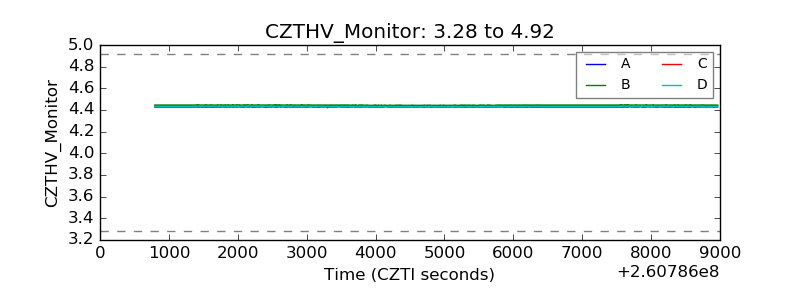 |
| D_VDD | 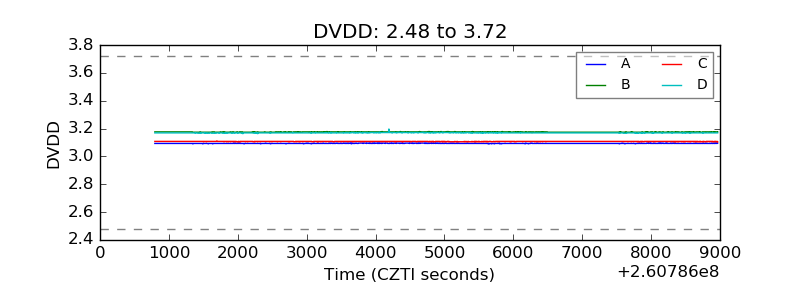 |
| Temperature 1 |  |
| Veto HV Monitor | 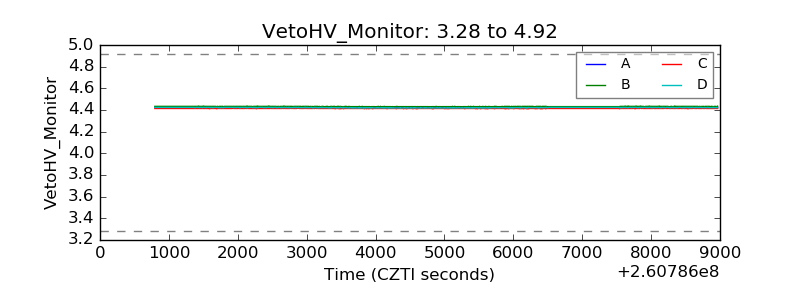 |
| Veto LLD | 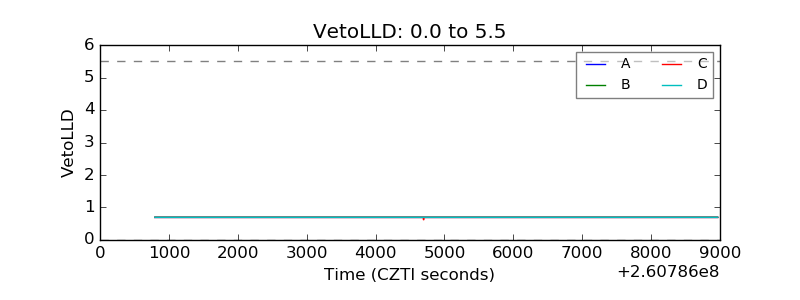 |
| Alpha Counter | 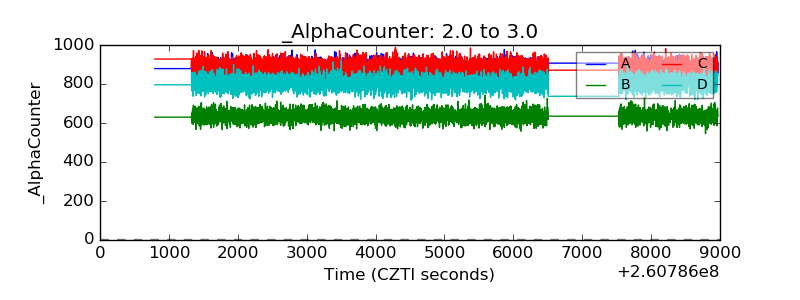 |
| _CPM_Rate | 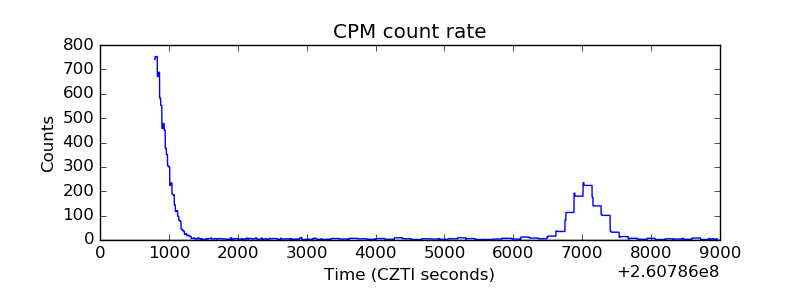 |
| CZT Counter | 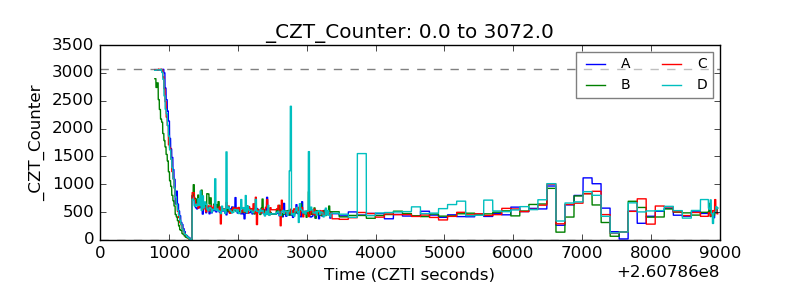 |
| +2.5 Volts monitor |  |
| +5 Volts monitor |  |
| _ROLL_ROT | 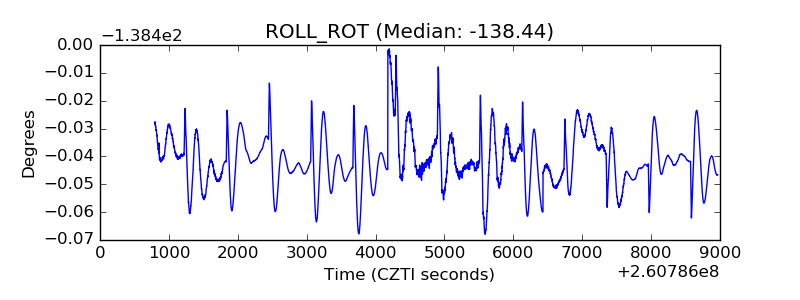 |
| _Roll_DEC | 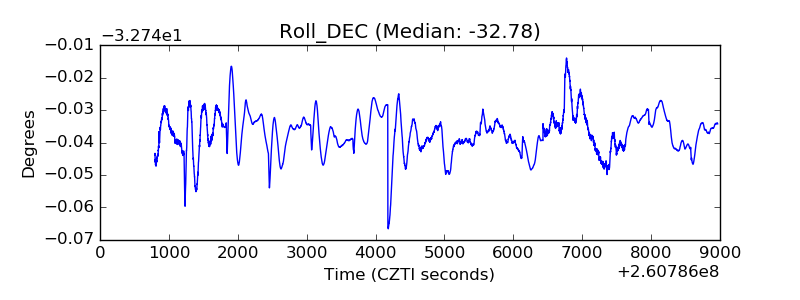 |
| _Roll_RA | 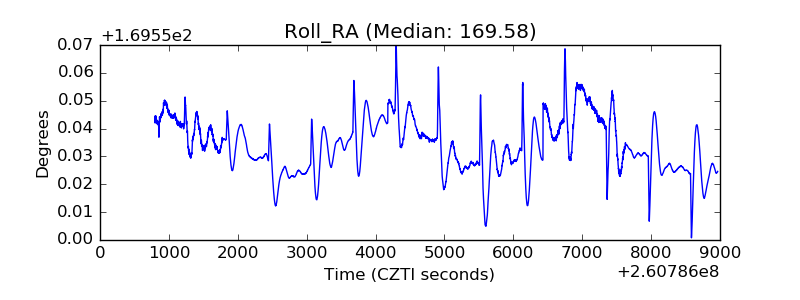 |
| Veto Counter | 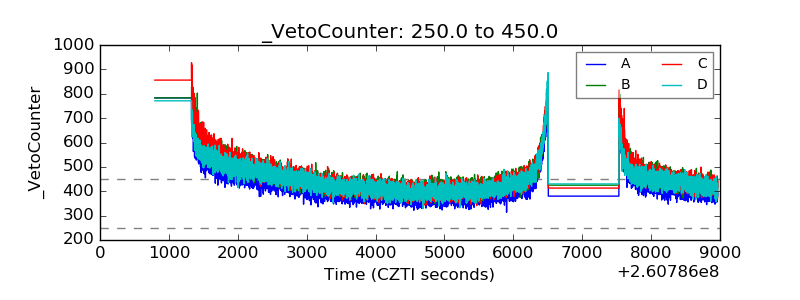 |