| Param | Original file | Final file |
|---|---|---|
| Filename | modeM0/AS1G08_075T01_9000002024cztM0_level2.fits | modeM0/AS1G08_075T01_9000002024cztM0_level2_quad_clean.evt |
| Size (bytes) | 360,244,800 | 375,140,160 |
| Size | 343.6 MB | 357.8 MB |
| Events in quadrant A | 2,156,186 | 2,188,082 |
| Events in quadrant B | 2,066,888 | 2,156,792 |
| Events in quadrant C | 2,177,914 | 2,288,482 |
| Events in quadrant D | 1,869,904 | 2,089,664 |
| Mode M9 | |||
|---|---|---|---|
| Quadrant | BADHDUFLAG | Total packets | Discarded packets |
| A | 0 | 39 | 0 |
| B | 0 | 39 | 0 |
| C | 0 | 39 | 0 |
| D | 0 | 39 | 0 |
| Mode M0 | |||
|---|---|---|---|
| Quadrant | BADHDUFLAG | Total packets | Discarded packets |
| A | 0 | 83835 | 0 |
| B | 0 | 86806 | 0 |
| C | 0 | 79992 | 0 |
| D | 0 | 93676 | 0 |
| Mode SS | |||
|---|---|---|---|
| Quadrant | BADHDUFLAG | Total packets | Discarded packets |
| A | 0 | 784 | 0 |
| B | 0 | 784 | 0 |
| C | 0 | 784 | 0 |
| D | 0 | 784 | 0 |
| Quadrant | Total seconds | Saturated seconds | Saturation percentage |
|---|---|---|---|
| A | 38413 | 892 | 2.322131% |
| B | 38413 | 1199 | 3.121339% |
| C | 38413 | 542 | 1.410981% |
| D | 38413 | 1043 | 2.715227% |
Noise dominated data is calculated using 1-second bins in cleaned event files. If a bin has >2000 counts, and if more than 50% of those come from <1% of pixels, then it is considered to be noise-dominated and hence unusable.
| Quadrant | # 1 sec bins | Bins with >0 counts | Bins with >2000 counts | High rate bins dominated by noise | Noise dominated (total time) | Noise dominated (detector-on time) | Marked lightcurve |
|---|---|---|---|---|---|---|---|
| A | 42348 | 38410 | 0 | 0 | 0.00% | 0.00% |  |
| B | 42348 | 38411 | 0 | 0 | 0.00% | 0.00% |  |
| C | 42348 | 38413 | 0 | 0 | 0.00% | 0.00% |  |
| D | 42348 | 38412 | 0 | 0 | 0.00% | 0.00% |  |
Top three noisy pixels from each quadrant. If the there are fewer than three noisy pixels in the level2.evt file, extra rows are filled as -1
| Pixel properties | Quadrant properties | ||||||
|---|---|---|---|---|---|---|---|
| Quadrant | DetID | PixID | Counts | Sigma | Mean | Median | Sigma |
| A | 14 | 188 | 2247 | 12.02 | 560 | 523 | 143.4 |
| A | 0 | 29 | 2100 | 11.0 | 560 | 523 | 143.4 |
| A | 14 | 204 | 1912 | 9.69 | 560 | 523 | 143.4 |
| B | 2 | 9 | 1818 | 11.86 | 544 | 516 | 109.7 |
| B | 14 | 254 | 1460 | 8.6 | 544 | 516 | 109.7 |
| B | 3 | 17 | 1398 | 8.04 | 544 | 516 | 109.7 |
| C | 12 | 250 | 1596 | 7.15 | 573 | 534 | 148.6 |
| C | 1 | 65 | 1538 | 6.76 | 573 | 534 | 148.6 |
| C | 2 | 191 | 1516 | 6.61 | 573 | 534 | 148.6 |
| D | 4 | 246 | 1426 | 6.5 | 533 | 486 | 144.7 |
| D | 3 | 14 | 1426 | 6.5 | 533 | 486 | 144.7 |
| D | 10 | 189 | 1370 | 6.11 | 533 | 486 | 144.7 |
Histogram calculated using DETX and DETY for each event in the final _common_clean file
| Quadrant A | 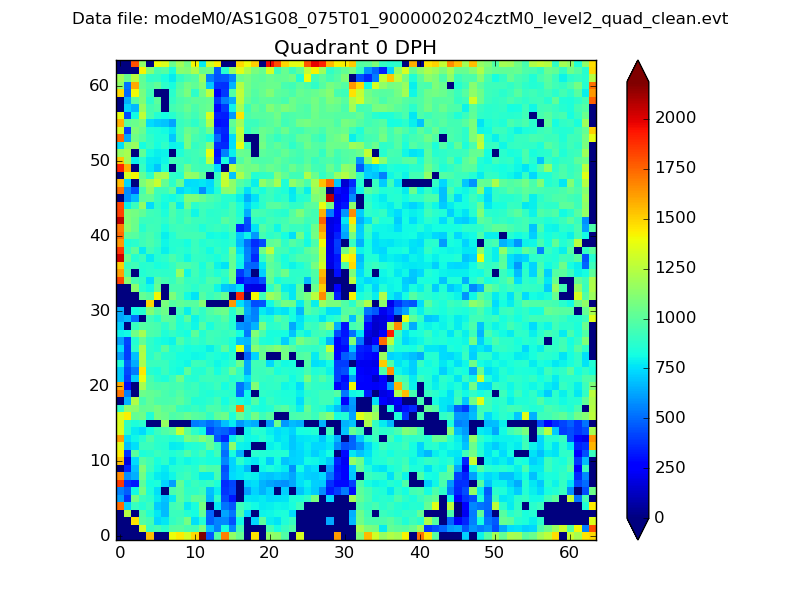 |
 |
Quadrant B |
|---|---|---|---|
| Quadrant D |  |
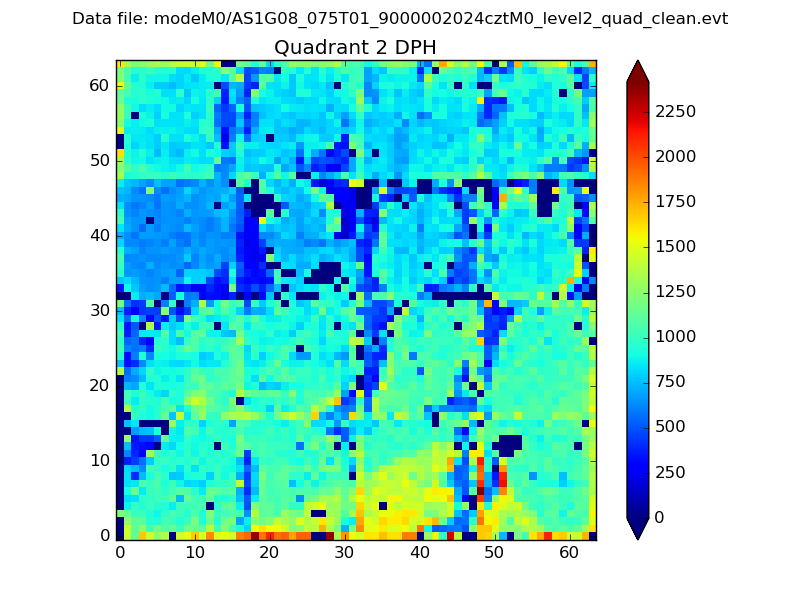 |
Quadrant C |
| Plot type | Count rate plots | Images |
|---|---|---|
| Comparison with Poisson distribution Blue bars denote a histogram of data divided into 1 sec bins. Red curve is a Poisson curve with rate = median count rate of data. |
 |
 |
| Quadrant-wise count rates Data is divided into 100 sec bins |
 |
|
| Module-wise count rates for Quadrant A Data is divided into 100 sec bins |
 |
 |
| Module-wise count rates for Quadrant B Data is divided into 100 sec bins |
 |
 |
| Module-wise count rates for Quadrant C Data is divided into 100 sec bins |
 |
 |
| Module-wise count rates for Quadrant D Data is divided into 100 sec bins |
 |
 |
| Parameter | Plot |
|---|---|
| CZT HV Monitor |  |
| D_VDD |  |
| Temperature 1 |  |
| Veto HV Monitor |  |
| Veto LLD |  |
| Alpha Counter |  |
| _CPM_Rate |  |
| CZT Counter |  |
| +2.5 Volts monitor |  |
| +5 Volts monitor |  |
| _ROLL_ROT |  |
| _Roll_DEC |  |
| _Roll_RA |  |
| Veto Counter |  |