| Param | Original file | Final file |
|---|---|---|
| Filename | modeM0/AS1G08_075T01_9000002024_13653cztM0_level2.evt | modeM0/AS1G08_075T01_9000002024_13653cztM0_level2_quad_clean.evt |
| Size (bytes) | 182,707,200 | 27,239,040 |
| Size | 174.2 MB | 26.0 MB |
| Events in quadrant A | 1,264,136 | 162,497 |
| Events in quadrant B | 1,373,032 | 164,732 |
| Events in quadrant C | 1,322,493 | 169,896 |
| Events in quadrant D | 1,416,319 | 162,402 |
| Mode M9 | |||
|---|---|---|---|
| Quadrant | BADHDUFLAG | Total packets | Discarded packets |
| A | 0 | 1 | 0 |
| B | 0 | 1 | 0 |
| C | 0 | 1 | 0 |
| D | 0 | 1 | 0 |
| Mode M0 | |||
|---|---|---|---|
| Quadrant | BADHDUFLAG | Total packets | Discarded packets |
| A | 0 | 5147 | 3 |
| B | 0 | 5498 | 2 |
| C | 0 | 5291 | 2 |
| D | 0 | 5601 | 2 |
| Mode SS | |||
|---|---|---|---|
| Quadrant | BADHDUFLAG | Total packets | Discarded packets |
| A | 0 | 48 | 0 |
| B | 0 | 48 | 0 |
| C | 0 | 48 | 0 |
| D | 0 | 48 | 0 |
| Quadrant | Total seconds | Saturated seconds | Saturation percentage |
|---|---|---|---|
| A | 2278 | 268 | 11.764706% |
| B | 2278 | 282 | 12.379280% |
| C | 2278 | 247 | 10.842845% |
| D | 2278 | 255 | 11.194030% |
Noise dominated data is calculated using 1-second bins in cleaned event files. If a bin has >2000 counts, and if more than 50% of those come from <1% of pixels, then it is considered to be noise-dominated and hence unusable.
| Quadrant | # 1 sec bins | Bins with >0 counts | Bins with >2000 counts | High rate bins dominated by noise | Noise dominated (total time) | Noise dominated (detector-on time) | Marked lightcurve |
|---|---|---|---|---|---|---|---|
| A | 2344 | 2281 | 0 | 0 | 0.00% | 0.00% | 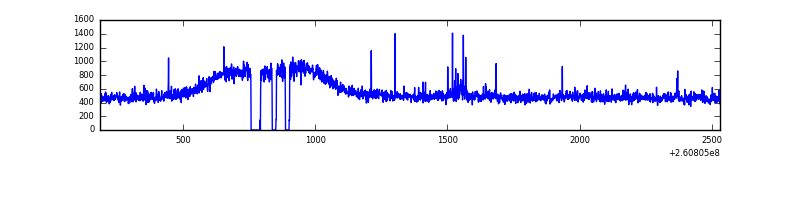 |
| B | 2344 | 2282 | 2 | 2 | 0.09% | 0.09% | 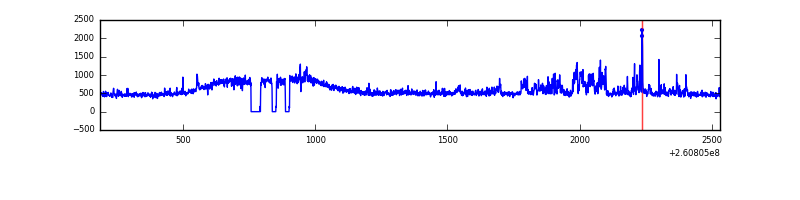 |
| C | 2344 | 2281 | 0 | 0 | 0.00% | 0.00% | 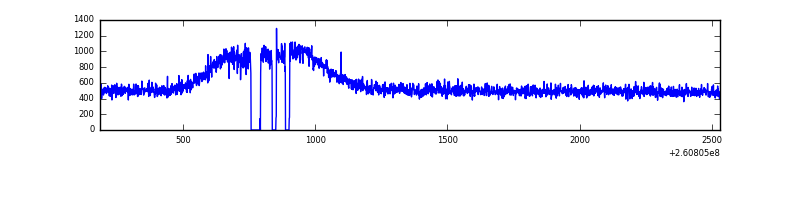 |
| D | 2344 | 2281 | 3 | 3 | 0.13% | 0.13% | 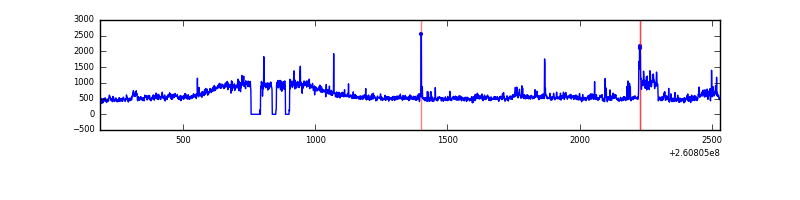 |
Top three noisy pixels from each quadrant. If the there are fewer than three noisy pixels in the level2.evt file, extra rows are filled as -1
| Pixel properties | Quadrant properties | ||||||
|---|---|---|---|---|---|---|---|
| Quadrant | DetID | PixID | Counts | Sigma | Mean | Median | Sigma |
| A | 12 | 96 | 22546 | 324.58 | 320 | 311 | 68.5 |
| A | 1 | 162 | 4284 | 58.0 | 320 | 311 | 68.5 |
| A | 0 | 226 | 2824 | 36.68 | 320 | 311 | 68.5 |
| B | 0 | 219 | 64764 | 1005.74 | 312 | 303 | 64.1 |
| B | 0 | 189 | 52851 | 819.87 | 312 | 303 | 64.1 |
| B | 4 | 80 | 12240 | 186.24 | 312 | 303 | 64.1 |
| C | 3 | 233 | 106343 | 1419.12 | 310 | 309 | 74.7 |
| C | 8 | 128 | 3588 | 43.88 | 310 | 309 | 74.7 |
| C | 13 | 61 | 2355 | 27.38 | 310 | 309 | 74.7 |
| D | 5 | 222 | 93364 | 1206.13 | 315 | 304 | 77.2 |
| D | 8 | 195 | 87332 | 1127.95 | 315 | 304 | 77.2 |
| D | 13 | 249 | 28123 | 360.56 | 315 | 304 | 77.2 |
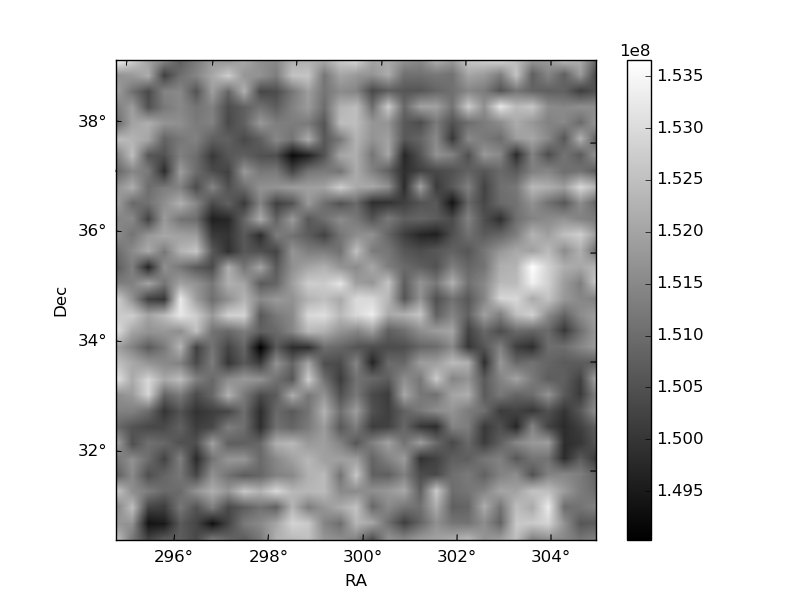
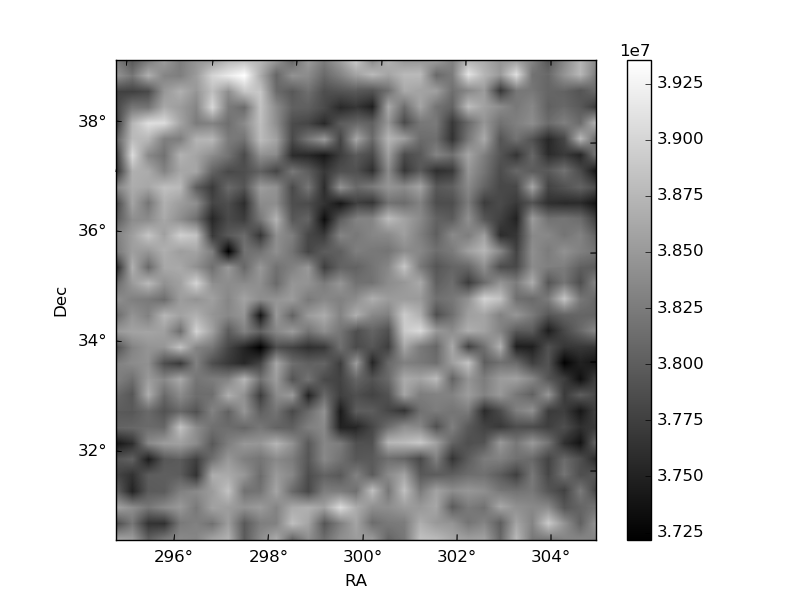
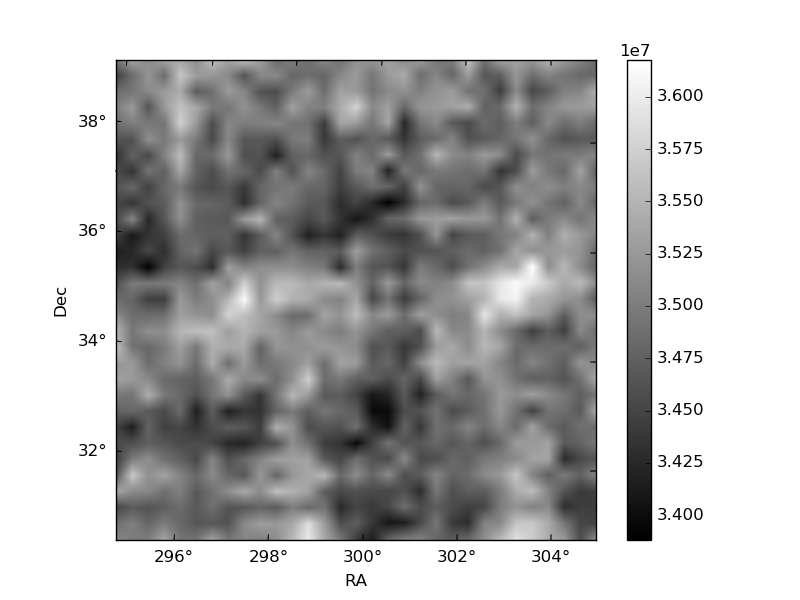
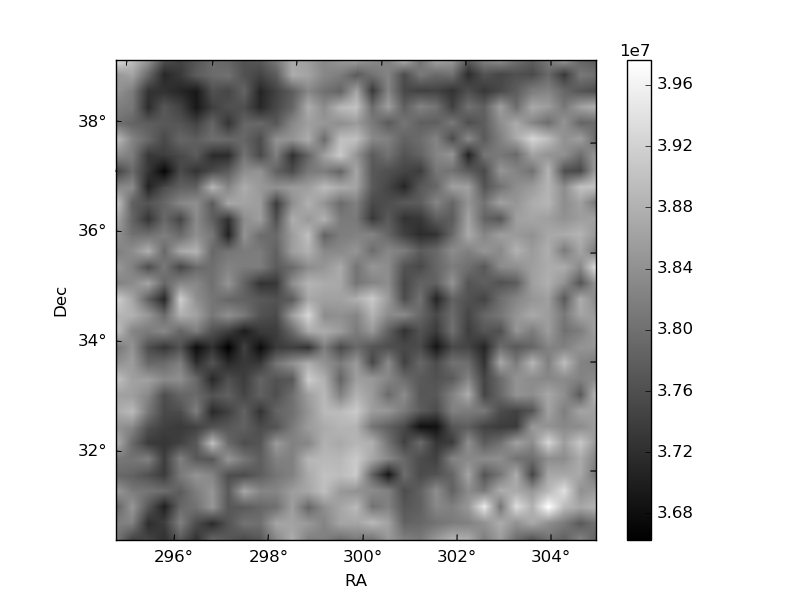
Histogram calculated using DETX and DETY for each event in the final _common_clean file
| Quadrant A | 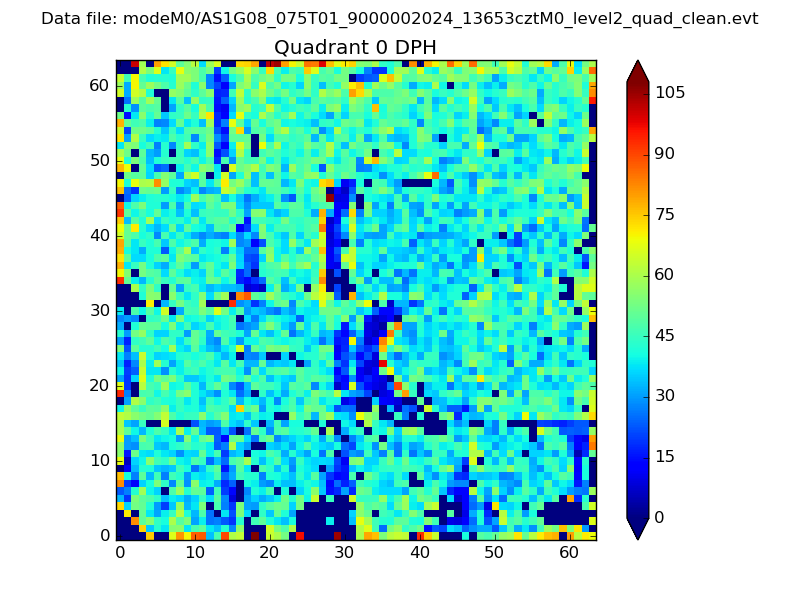 |
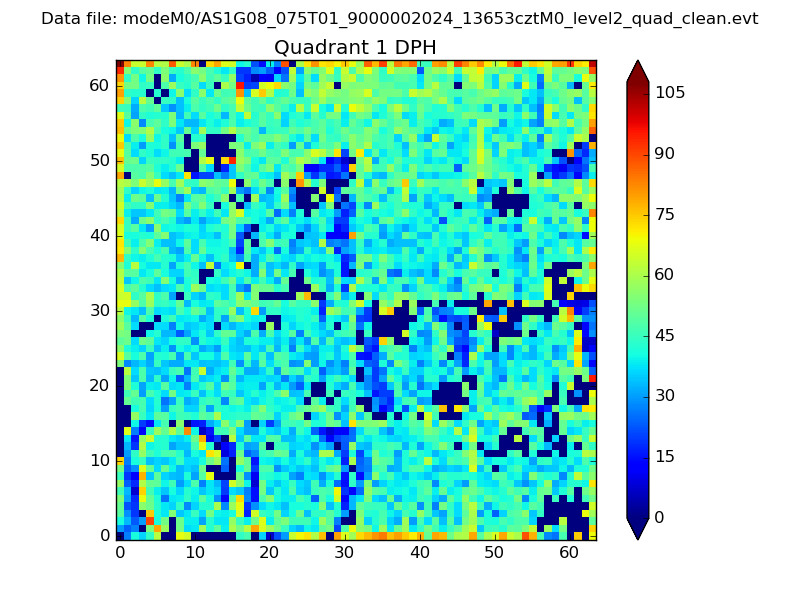 |
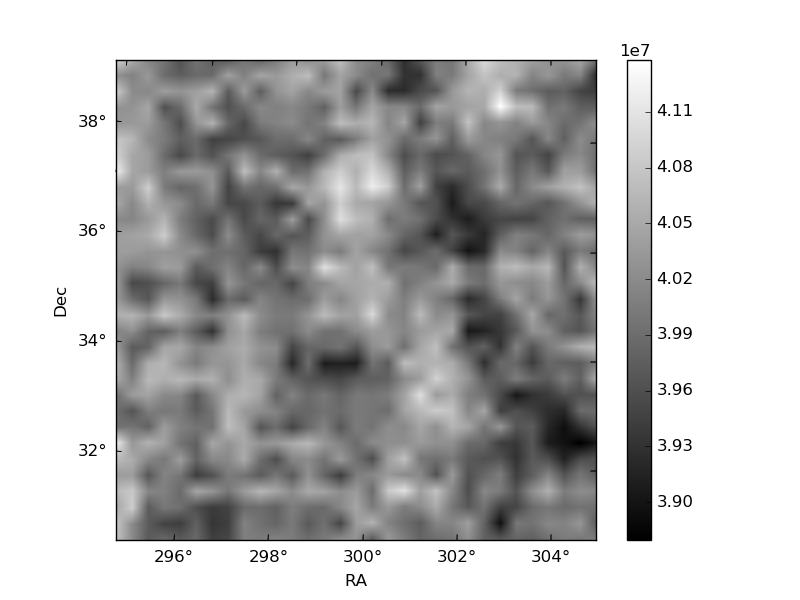
Quadrant B |
|---|---|---|---|
| Quadrant D | 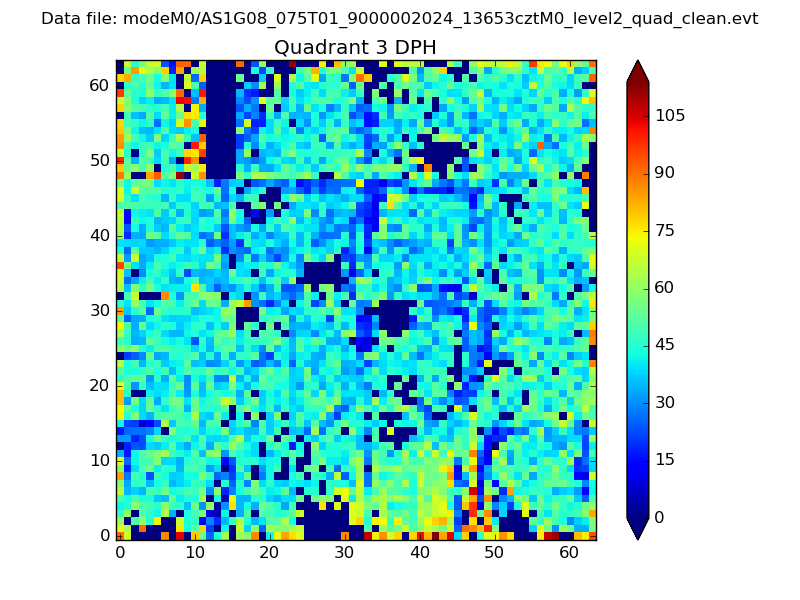 |
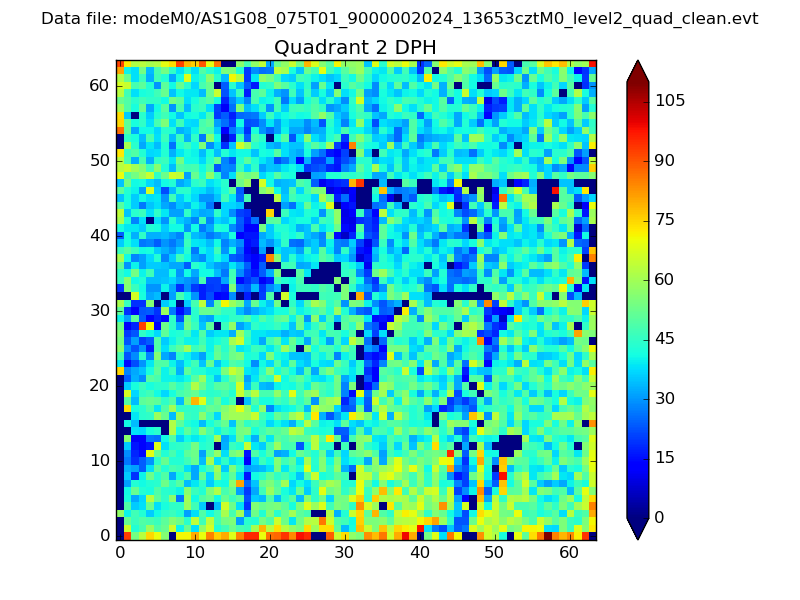 |
Quadrant C |
| Plot type | Count rate plots | Images |
|---|---|---|
| Comparison with Poisson distribution Blue bars denote a histogram of data divided into 1 sec bins. Red curve is a Poisson curve with rate = median count rate of data. |
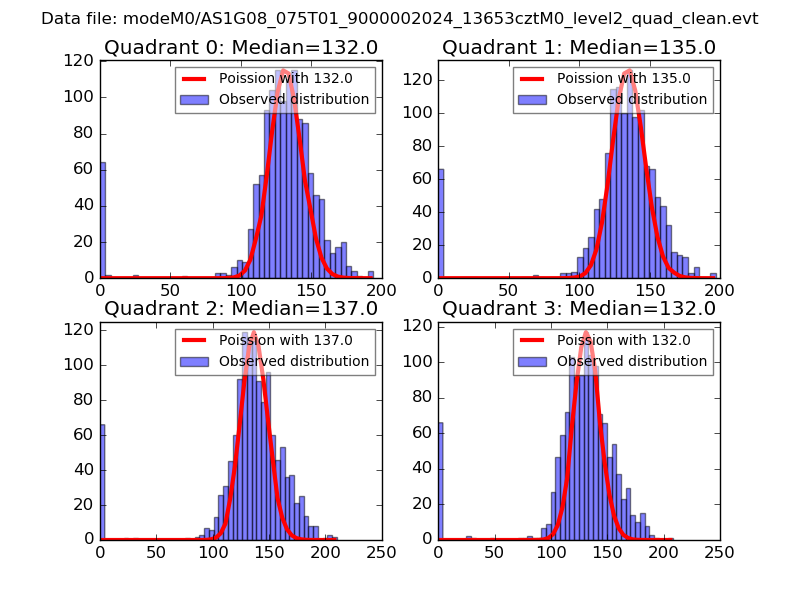 |
 |
| Quadrant-wise count rates Data is divided into 100 sec bins |
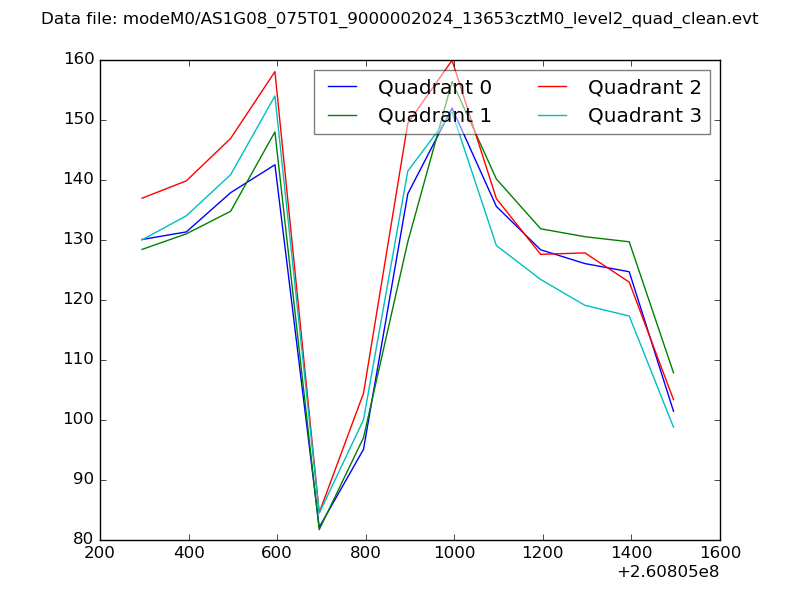 |
|
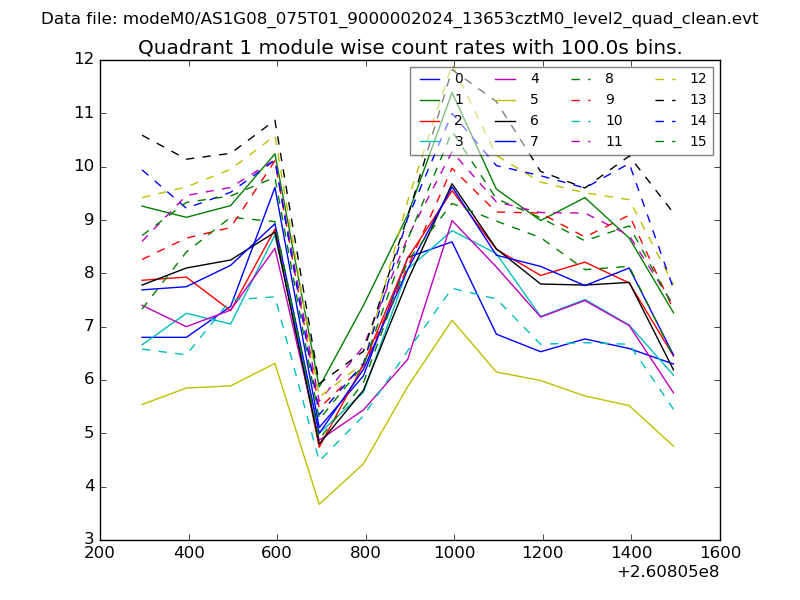
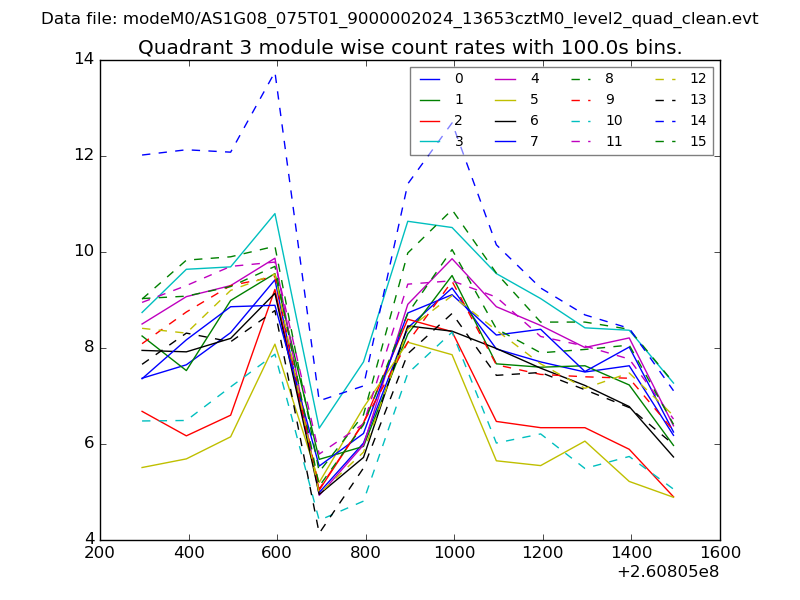
| Module-wise count rates for Quadrant A Data is divided into 100 sec bins |
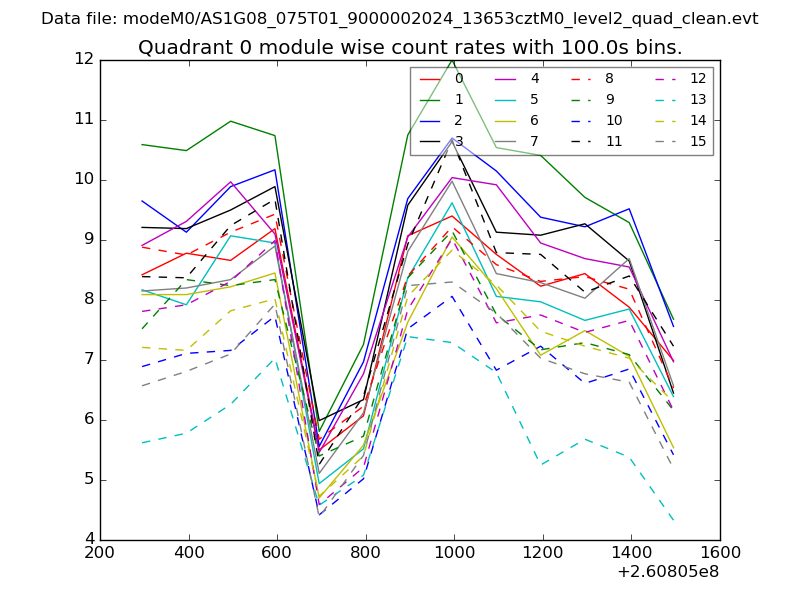 |
 |
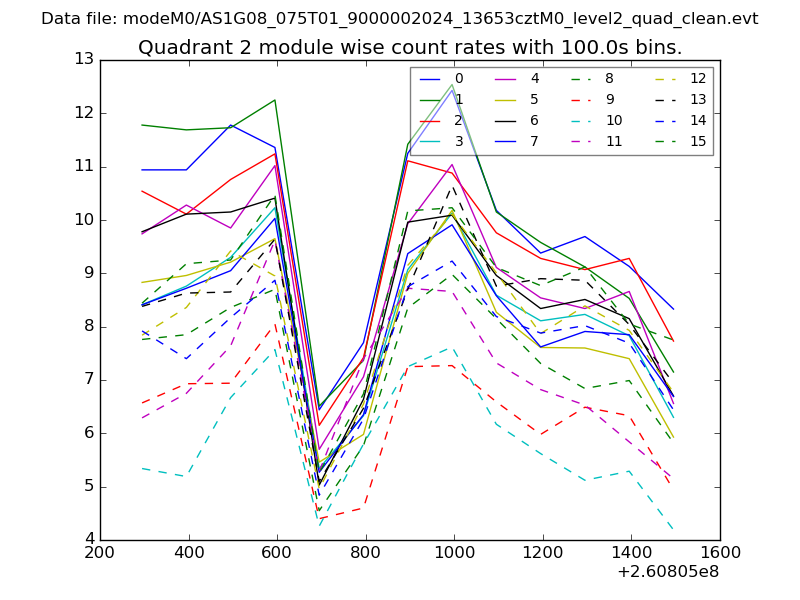
| Module-wise count rates for Quadrant B Data is divided into 100 sec bins |
 |
 |
| Module-wise count rates for Quadrant C Data is divided into 100 sec bins |
 |
 |
| Module-wise count rates for Quadrant D Data is divided into 100 sec bins |
 |
 |
| Parameter | Plot |
|---|---|
| CZT HV Monitor | 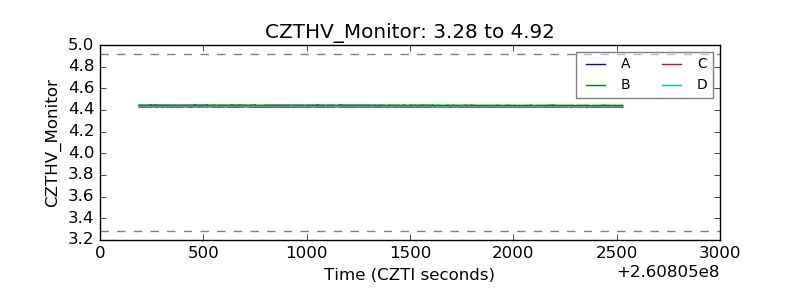 |
| D_VDD | 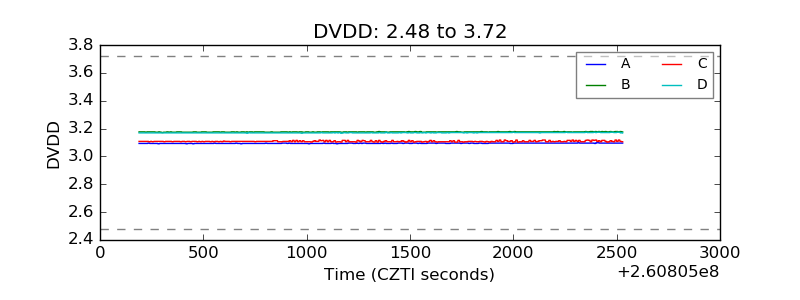 |
| Temperature 1 | 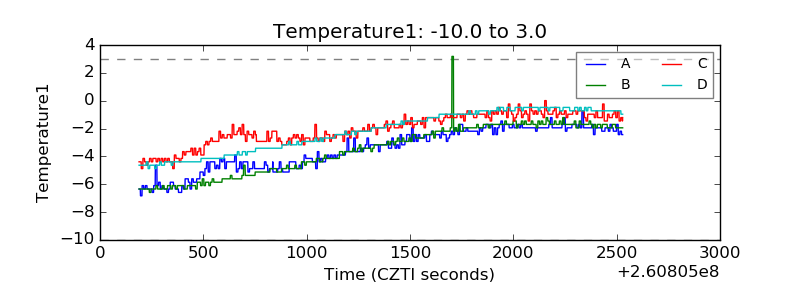 |
| Veto HV Monitor | 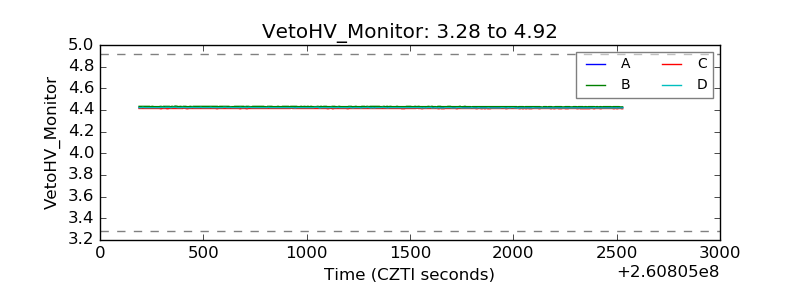 |
| Veto LLD | 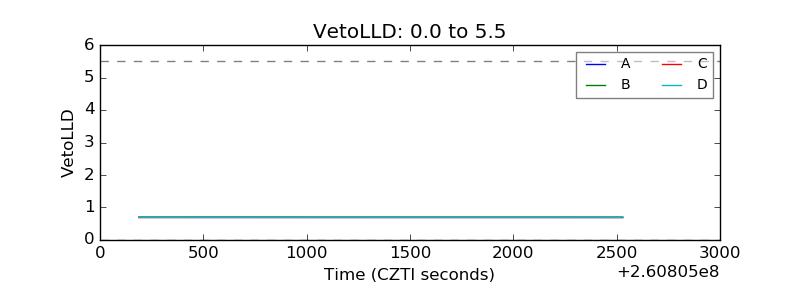 |
| Alpha Counter | 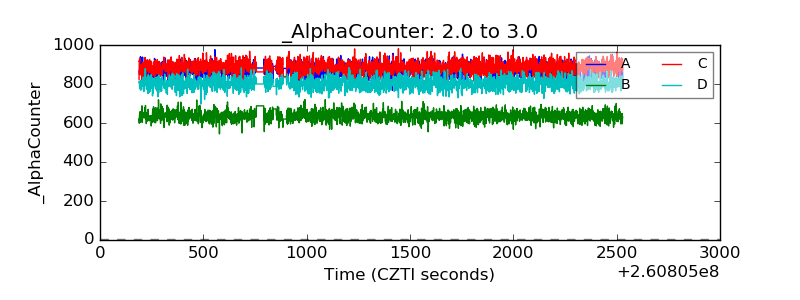 |
| _CPM_Rate | 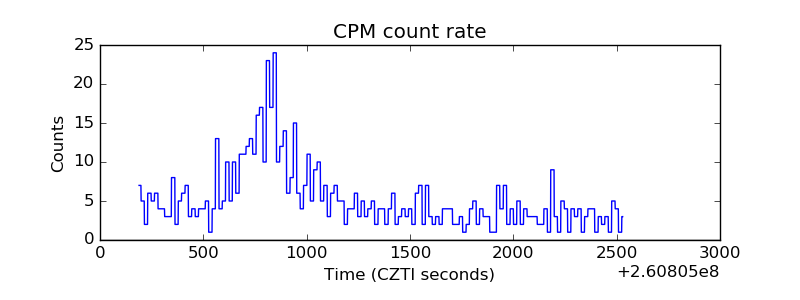 |
| CZT Counter | 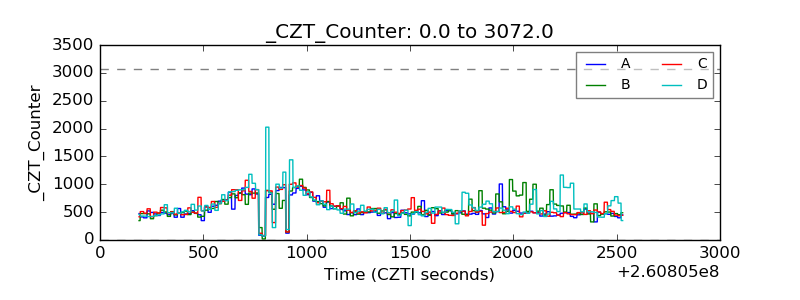 |
| +2.5 Volts monitor | 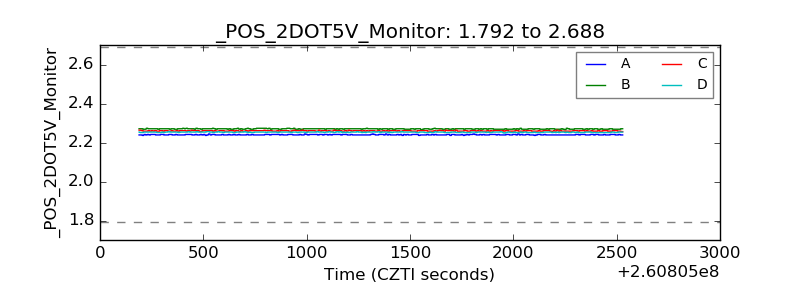 |
| +5 Volts monitor | 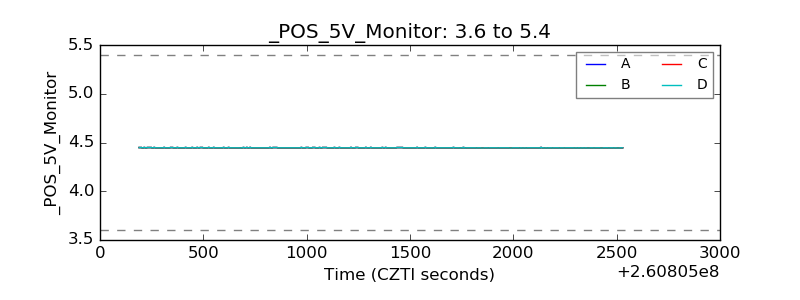 |
| _ROLL_ROT | 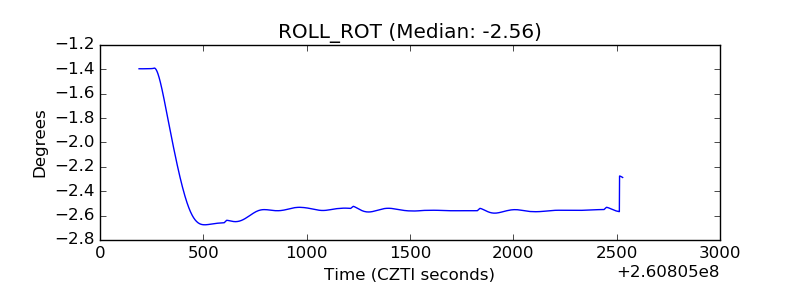 |
| _Roll_DEC | 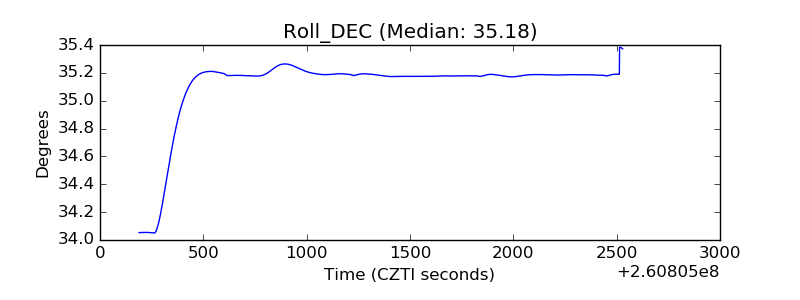 |
| _Roll_RA | 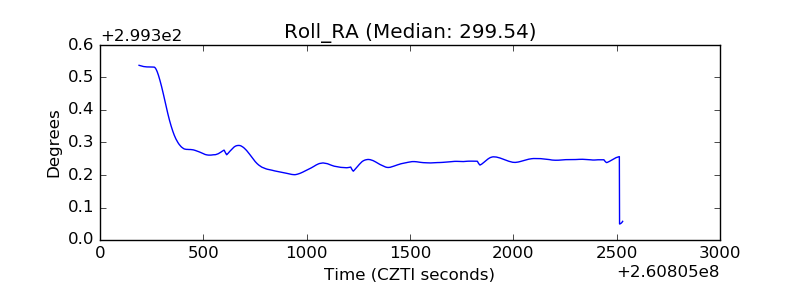 |
| Veto Counter | 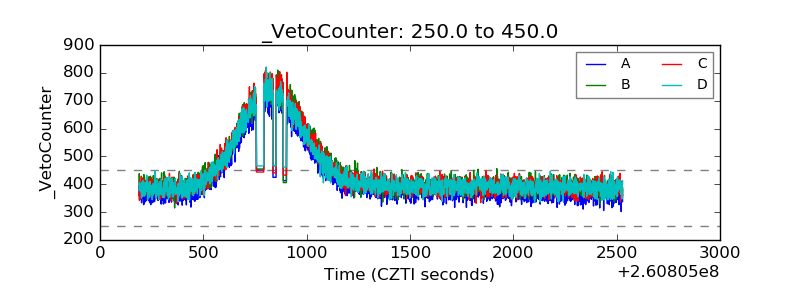 |