| Param | Original file | Final file |
|---|---|---|
| Filename | modeM0/AS1G08_075T01_9000002024_13654cztM0_level2.evt | modeM0/AS1G08_075T01_9000002024_13654cztM0_level2_quad_clean.evt |
| Size (bytes) | 545,247,360 | 83,131,200 |
| Size | 520.0 MB | 79.3 MB |
| Events in quadrant A | 3,606,350 | 492,778 |
| Events in quadrant B | 4,278,628 | 489,819 |
| Events in quadrant C | 3,700,009 | 522,245 |
| Events in quadrant D | 4,428,682 | 500,169 |
| Mode M9 | |||
|---|---|---|---|
| Quadrant | BADHDUFLAG | Total packets | Discarded packets |
| A | 0 | 1 | 0 |
| B | 0 | 1 | 0 |
| C | 0 | 1 | 0 |
| D | 0 | 1 | 0 |
| Mode M0 | |||
|---|---|---|---|
| Quadrant | BADHDUFLAG | Total packets | Discarded packets |
| A | 0 | 15472 | 2 |
| B | 0 | 17385 | 1 |
| C | 0 | 15235 | 1 |
| D | 0 | 17799 | 1 |
| Mode SS | |||
|---|---|---|---|
| Quadrant | BADHDUFLAG | Total packets | Discarded packets |
| A | 0 | 150 | 0 |
| B | 0 | 150 | 0 |
| C | 0 | 150 | 0 |
| D | 0 | 150 | 0 |
| Quadrant | Total seconds | Saturated seconds | Saturation percentage |
|---|---|---|---|
| A | 7352 | 162 | 2.203482% |
| B | 7352 | 427 | 5.807943% |
| C | 7352 | 122 | 1.659412% |
| D | 7352 | 171 | 2.325898% |
Noise dominated data is calculated using 1-second bins in cleaned event files. If a bin has >2000 counts, and if more than 50% of those come from <1% of pixels, then it is considered to be noise-dominated and hence unusable.
| Quadrant | # 1 sec bins | Bins with >0 counts | Bins with >2000 counts | High rate bins dominated by noise | Noise dominated (total time) | Noise dominated (detector-on time) | Marked lightcurve |
|---|---|---|---|---|---|---|---|
| A | 7503 | 7354 | 20 | 20 | 0.27% | 0.27% |  |
| B | 7503 | 7354 | 120 | 120 | 1.60% | 1.63% |  |
| C | 7503 | 7354 | 0 | 0 | 0.00% | 0.00% |  |
| D | 7503 | 7354 | 42 | 42 | 0.56% | 0.57% |  |
Top three noisy pixels from each quadrant. If the there are fewer than three noisy pixels in the level2.evt file, extra rows are filled as -1
| Pixel properties | Quadrant properties | ||||||
|---|---|---|---|---|---|---|---|
| Quadrant | DetID | PixID | Counts | Sigma | Mean | Median | Sigma |
| A | 12 | 96 | 118810 | 640.76 | 898 | 878 | 184.0 |
| A | 1 | 162 | 13854 | 70.5 | 898 | 878 | 184.0 |
| A | 15 | 69 | 11886 | 59.81 | 898 | 878 | 184.0 |
| B | 0 | 219 | 578713 | 3408.78 | 885 | 864 | 169.5 |
| B | 0 | 189 | 115153 | 674.2 | 885 | 864 | 169.5 |
| B | 0 | 214 | 24688 | 140.54 | 885 | 864 | 169.5 |
| C | 3 | 233 | 242123 | 1175.46 | 881 | 886 | 205.2 |
| C | 8 | 128 | 9637 | 42.64 | 881 | 886 | 205.2 |
| C | 13 | 61 | 6487 | 27.29 | 881 | 886 | 205.2 |
| D | 8 | 195 | 508188 | 2379.22 | 882 | 858 | 213.2 |
| D | 5 | 222 | 356712 | 1668.85 | 882 | 858 | 213.2 |
| D | 10 | 157 | 100178 | 465.78 | 882 | 858 | 213.2 |
Histogram calculated using DETX and DETY for each event in the final _common_clean file
| Quadrant A |  |
 |
Quadrant B |
|---|---|---|---|
| Quadrant D |  |
 |
Quadrant C |
| Plot type | Count rate plots | Images |
|---|---|---|
| Comparison with Poisson distribution Blue bars denote a histogram of data divided into 1 sec bins. Red curve is a Poisson curve with rate = median count rate of data. |
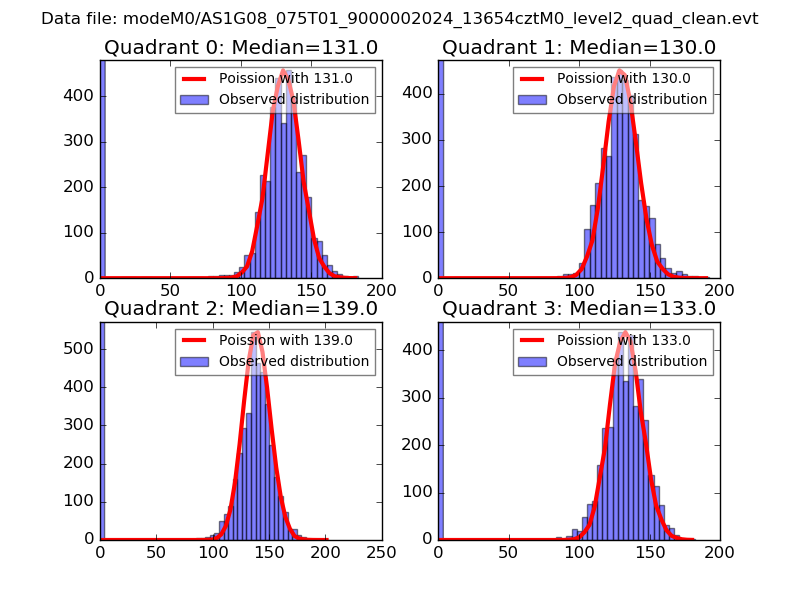 |
 |
| Quadrant-wise count rates Data is divided into 100 sec bins |
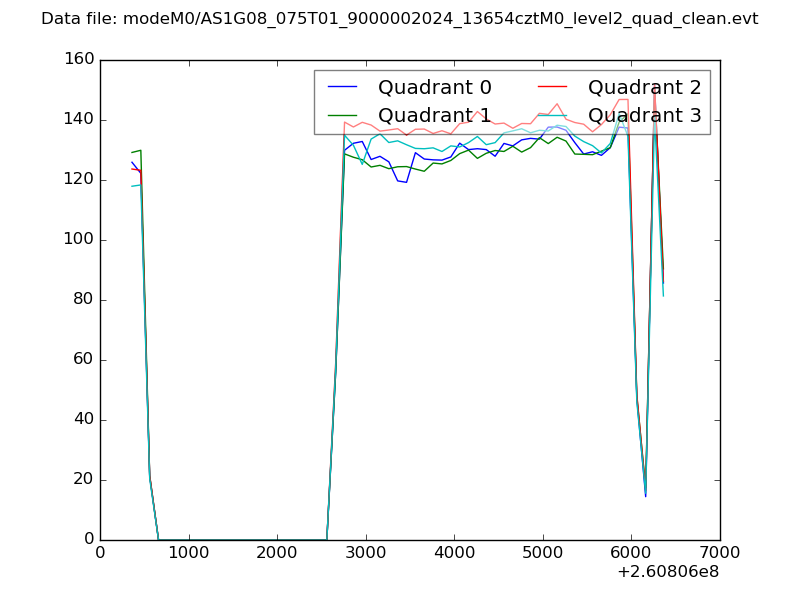 |
|
| Module-wise count rates for Quadrant A Data is divided into 100 sec bins |
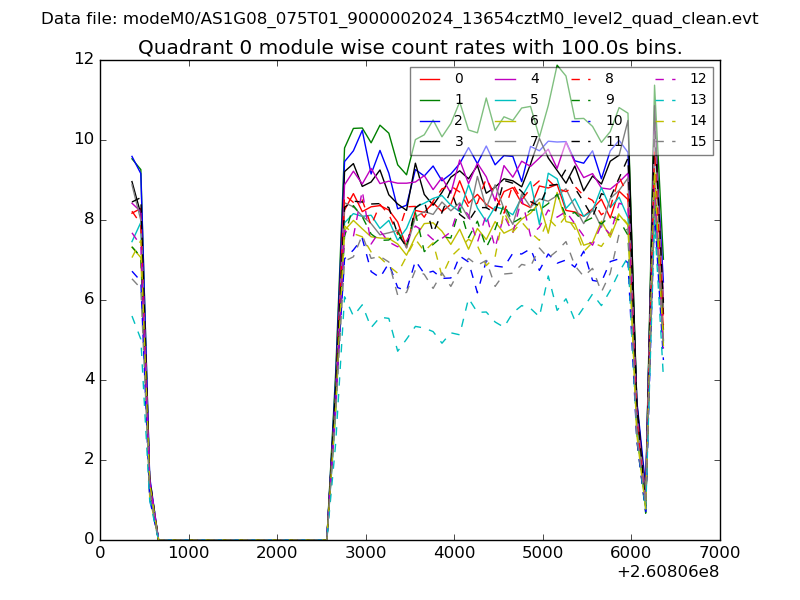 |
 |
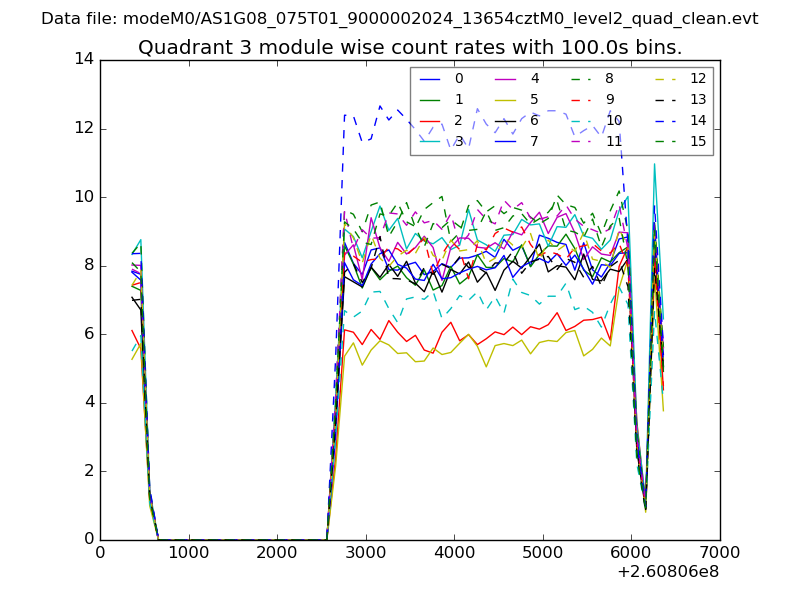
| Module-wise count rates for Quadrant B Data is divided into 100 sec bins |
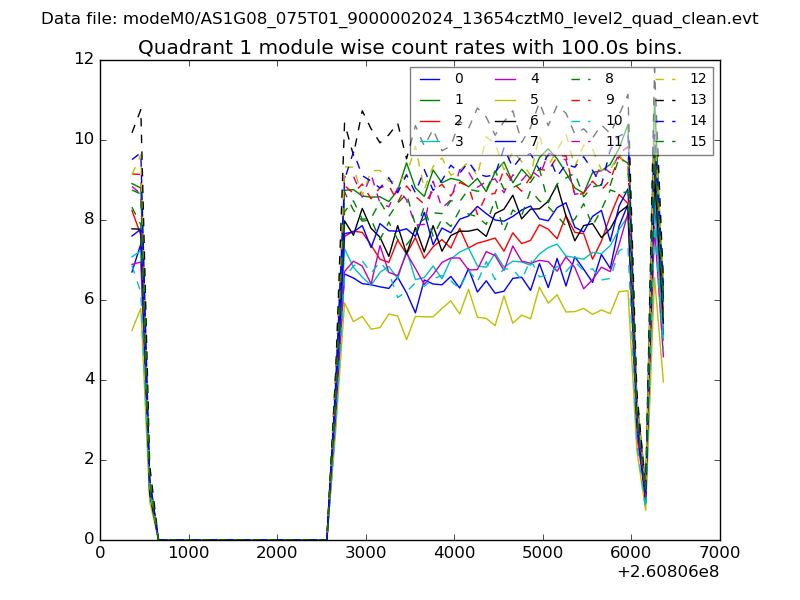 |
 |
| Module-wise count rates for Quadrant C Data is divided into 100 sec bins |
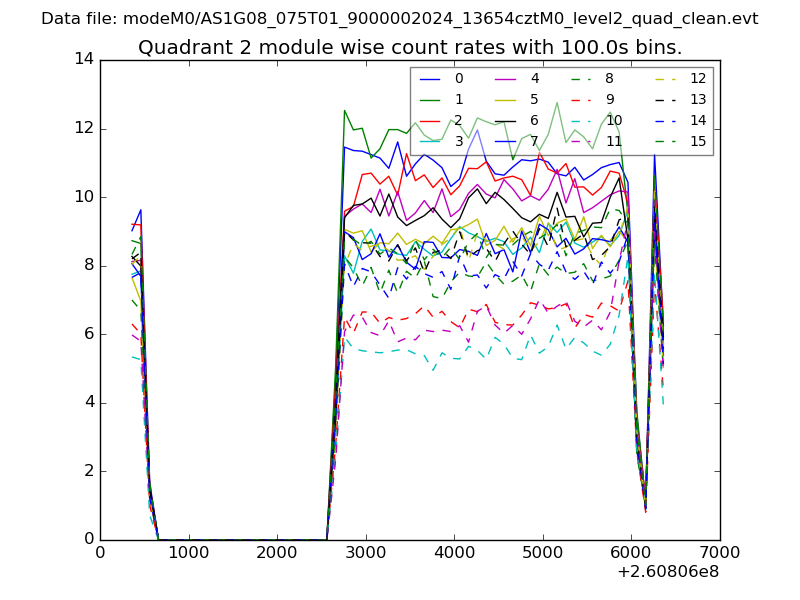 |
 |
| Module-wise count rates for Quadrant D Data is divided into 100 sec bins |
 |
 |
| Parameter | Plot |
|---|---|
| CZT HV Monitor | 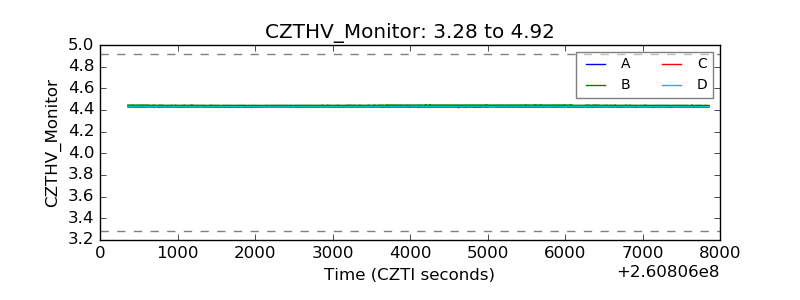 |
| D_VDD |  |
| Temperature 1 |  |
| Veto HV Monitor |  |
| Veto LLD |  |
| Alpha Counter | 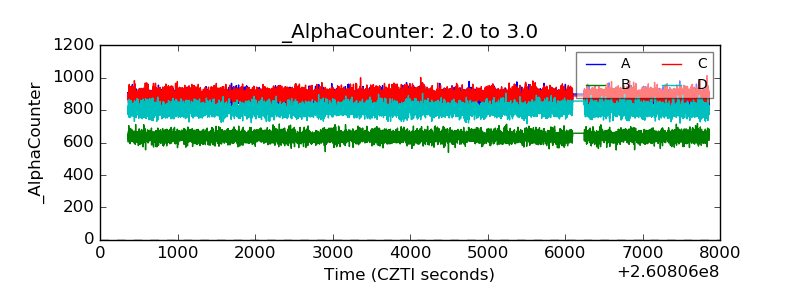 |
| _CPM_Rate | 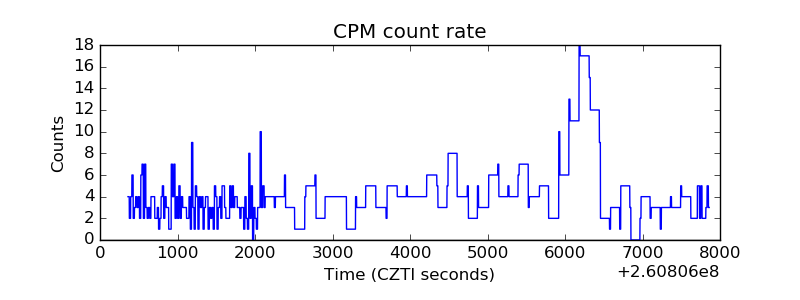 |
| CZT Counter |  |
| +2.5 Volts monitor |  |
| +5 Volts monitor |  |
| _ROLL_ROT | 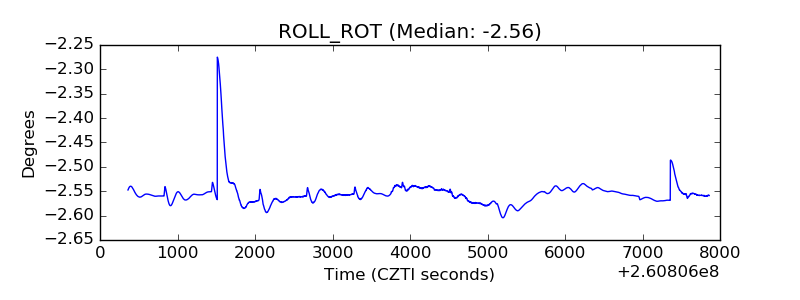 |
| _Roll_DEC | 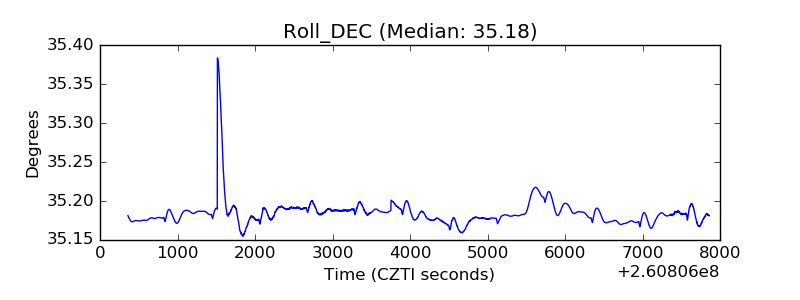 |
| _Roll_RA |  |
| Veto Counter | 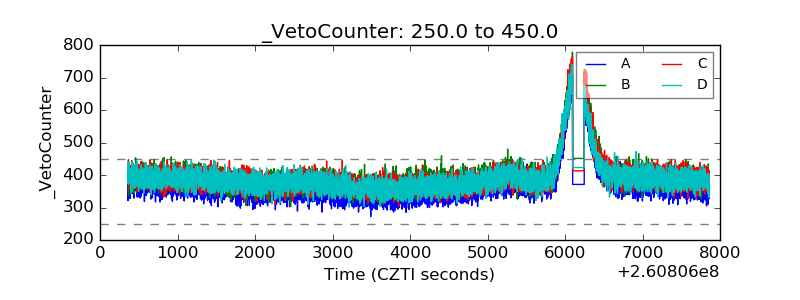 |