| Param | Original file | Final file |
|---|---|---|
| Filename | modeM0/AS1G08_075T01_9000002024_13657cztM0_level2.evt | modeM0/AS1G08_075T01_9000002024_13657cztM0_level2_quad_clean.evt |
| Size (bytes) | 930,744,000 | 171,023,040 |
| Size | 887.6 MB | 163.1 MB |
| Events in quadrant A | 6,237,640 | 1,054,463 |
| Events in quadrant B | 7,218,892 | 1,038,234 |
| Events in quadrant C | 6,432,906 | 1,116,499 |
| Events in quadrant D | 7,415,786 | 1,069,418 |
| Mode M9 | |||
|---|---|---|---|
| Quadrant | BADHDUFLAG | Total packets | Discarded packets |
| A | 0 | 17 | 0 |
| B | 0 | 17 | 0 |
| C | 0 | 17 | 0 |
| D | 0 | 17 | 0 |
| Mode M0 | |||
|---|---|---|---|
| Quadrant | BADHDUFLAG | Total packets | Discarded packets |
| A | 0 | 27099 | 4 |
| B | 0 | 30078 | 3 |
| C | 0 | 26909 | 3 |
| D | 0 | 30767 | 3 |
| Mode SS | |||
|---|---|---|---|
| Quadrant | BADHDUFLAG | Total packets | Discarded packets |
| A | 0 | 268 | 0 |
| B | 0 | 268 | 0 |
| C | 0 | 268 | 0 |
| D | 0 | 268 | 0 |
| Quadrant | Total seconds | Saturated seconds | Saturation percentage |
|---|---|---|---|
| A | 13039 | 118 | 0.904977% |
| B | 13039 | 322 | 2.469515% |
| C | 13039 | 105 | 0.805276% |
| D | 13039 | 218 | 1.671907% |
Noise dominated data is calculated using 1-second bins in cleaned event files. If a bin has >2000 counts, and if more than 50% of those come from <1% of pixels, then it is considered to be noise-dominated and hence unusable.
| Quadrant | # 1 sec bins | Bins with >0 counts | Bins with >2000 counts | High rate bins dominated by noise | Noise dominated (total time) | Noise dominated (detector-on time) | Marked lightcurve |
|---|---|---|---|---|---|---|---|
| A | 14775 | 13043 | 3 | 3 | 0.02% | 0.02% | 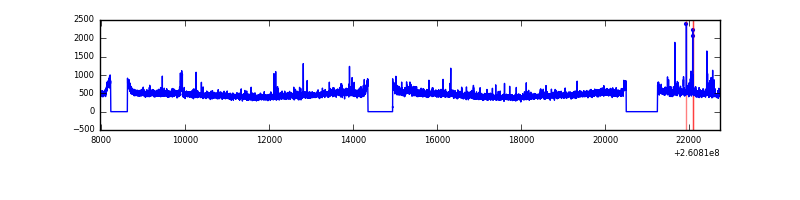 |
| B | 14775 | 13043 | 52 | 52 | 0.35% | 0.40% | 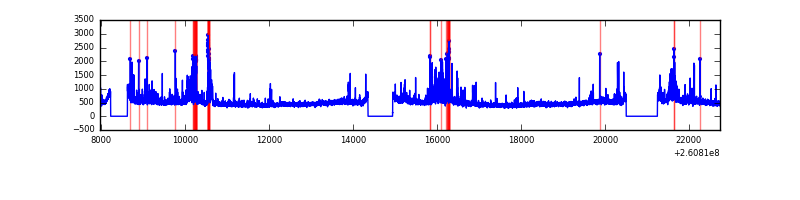 |
| C | 14775 | 13043 | 1 | 1 | 0.01% | 0.01% | 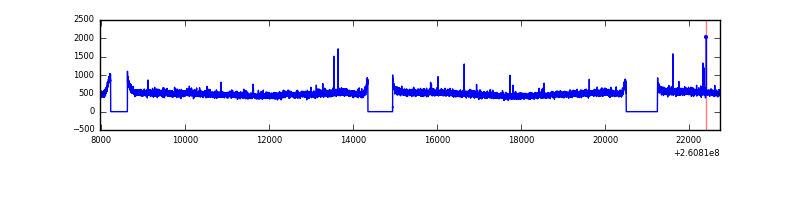 |
| D | 14775 | 13043 | 74 | 74 | 0.50% | 0.57% | 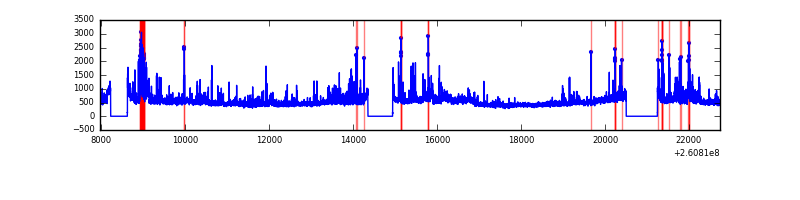 |
Top three noisy pixels from each quadrant. If the there are fewer than three noisy pixels in the level2.evt file, extra rows are filled as -1
| Pixel properties | Quadrant properties | ||||||
|---|---|---|---|---|---|---|---|
| Quadrant | DetID | PixID | Counts | Sigma | Mean | Median | Sigma |
| A | 11 | 29 | 43884 | 131.03 | 1581 | 1545 | 323.1 |
| A | 12 | 96 | 33588 | 99.17 | 1581 | 1545 | 323.1 |
| A | 9 | 143 | 28609 | 83.76 | 1581 | 1545 | 323.1 |
| B | 0 | 219 | 639113 | 2143.95 | 1566 | 1526 | 297.4 |
| B | 3 | 64 | 164836 | 549.15 | 1566 | 1526 | 297.4 |
| B | 0 | 189 | 79912 | 263.58 | 1566 | 1526 | 297.4 |
| C | 3 | 233 | 333898 | 915.72 | 1559 | 1569 | 362.9 |
| C | 14 | 234 | 20936 | 53.36 | 1559 | 1569 | 362.9 |
| C | 13 | 61 | 11161 | 26.43 | 1559 | 1569 | 362.9 |
| D | 8 | 195 | 391266 | 1036.07 | 1555 | 1508 | 376.2 |
| D | 13 | 122 | 266919 | 705.53 | 1555 | 1508 | 376.2 |
| D | 1 | 52 | 246111 | 650.21 | 1555 | 1508 | 376.2 |
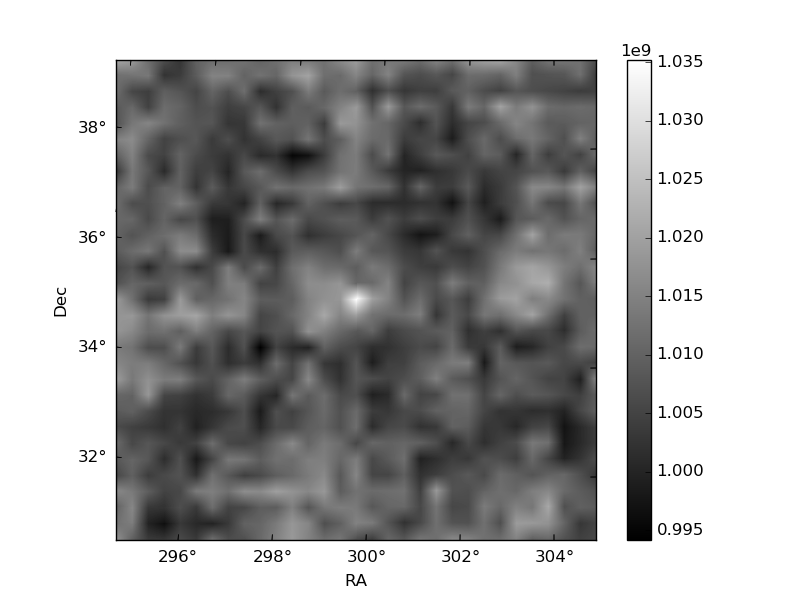
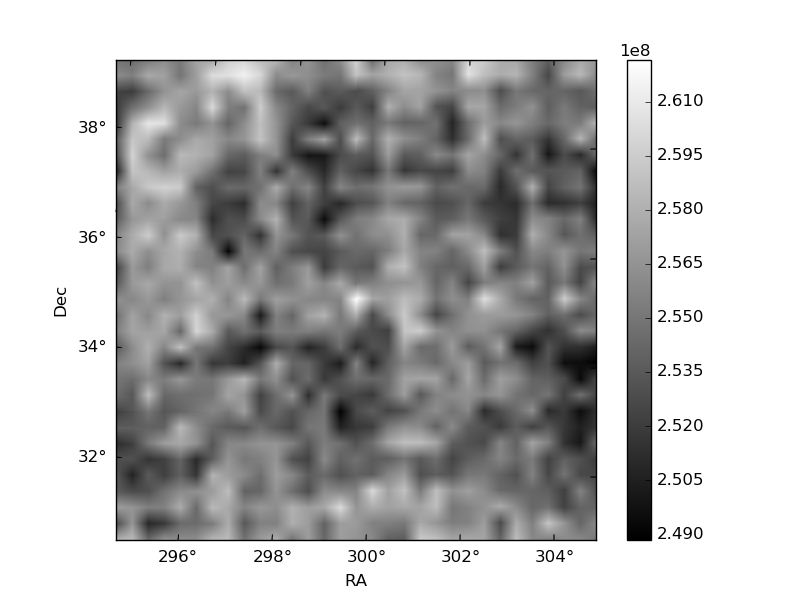
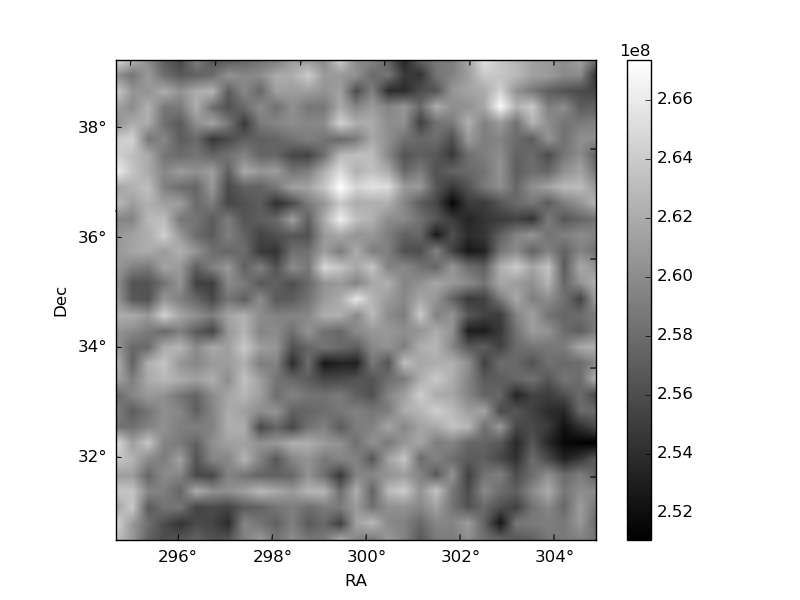
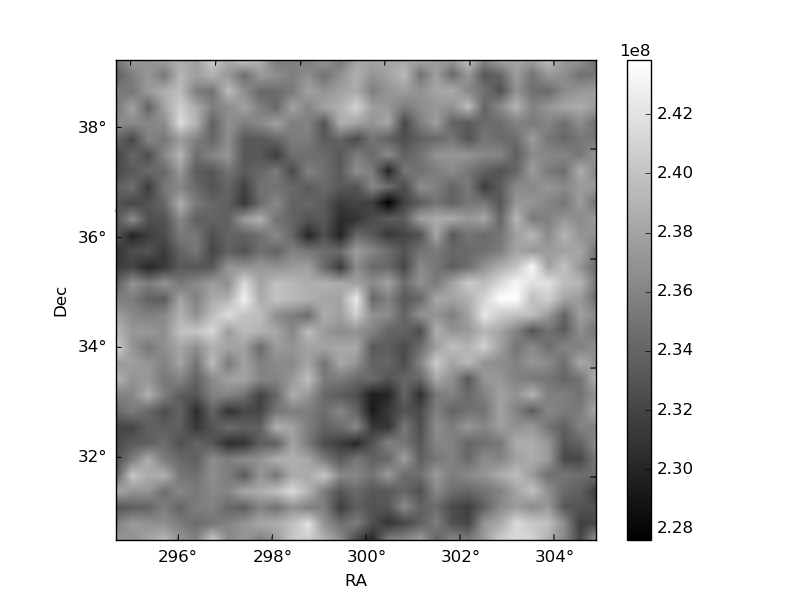
Histogram calculated using DETX and DETY for each event in the final _common_clean file
| Quadrant A | 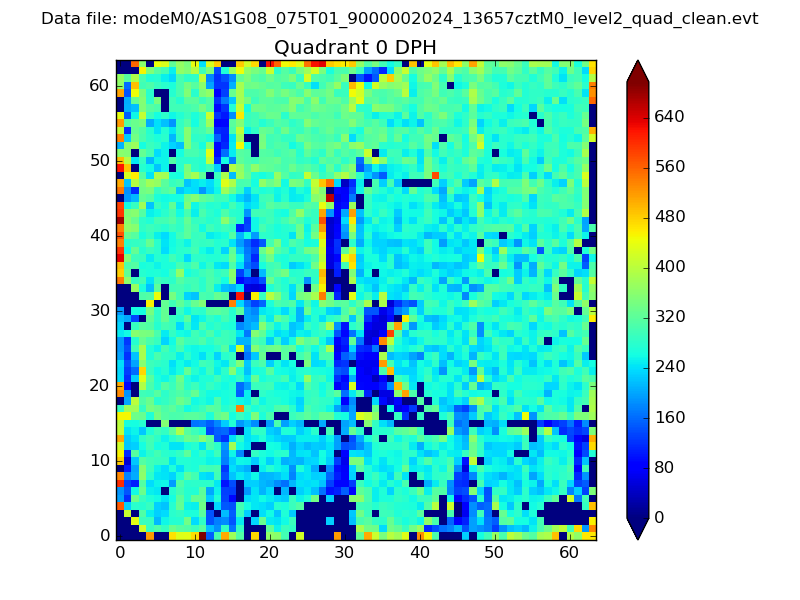 |
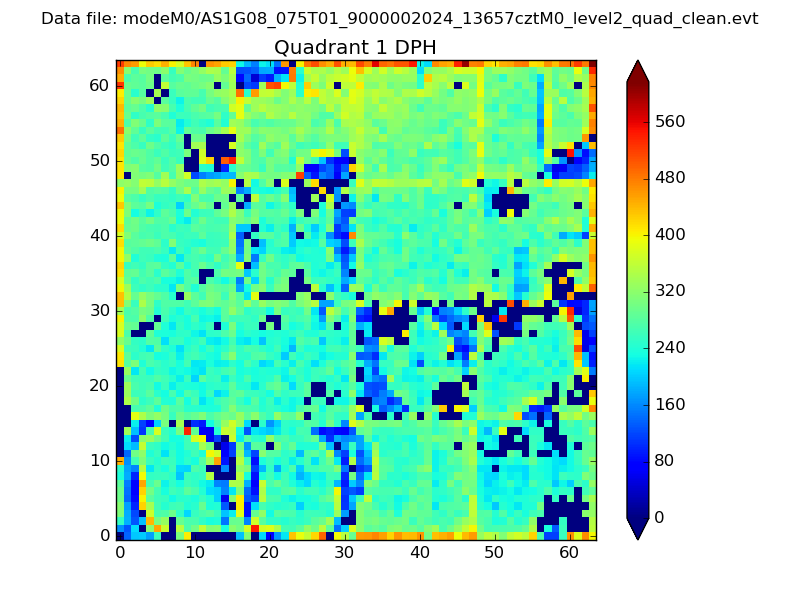 |
Quadrant B |
|---|---|---|---|
| Quadrant D |  |
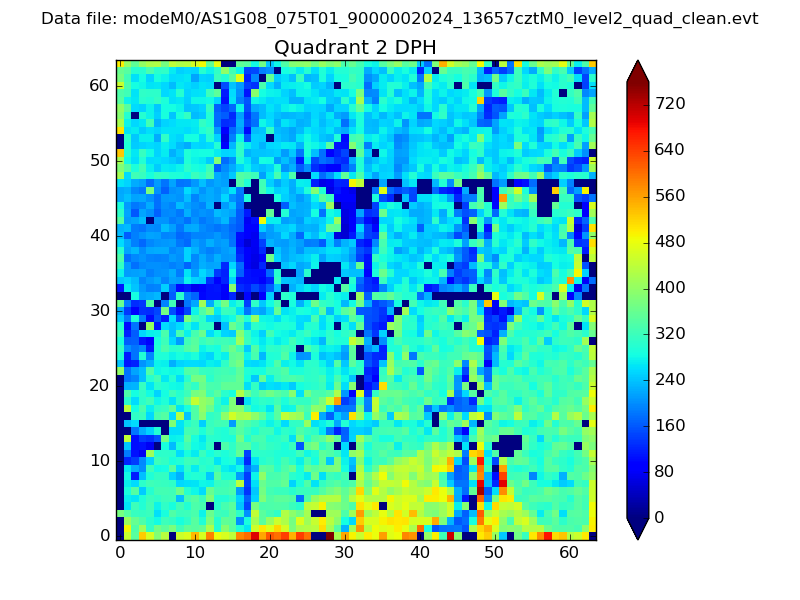 |
Quadrant C |
| Plot type | Count rate plots | Images |
|---|---|---|
| Comparison with Poisson distribution Blue bars denote a histogram of data divided into 1 sec bins. Red curve is a Poisson curve with rate = median count rate of data. |
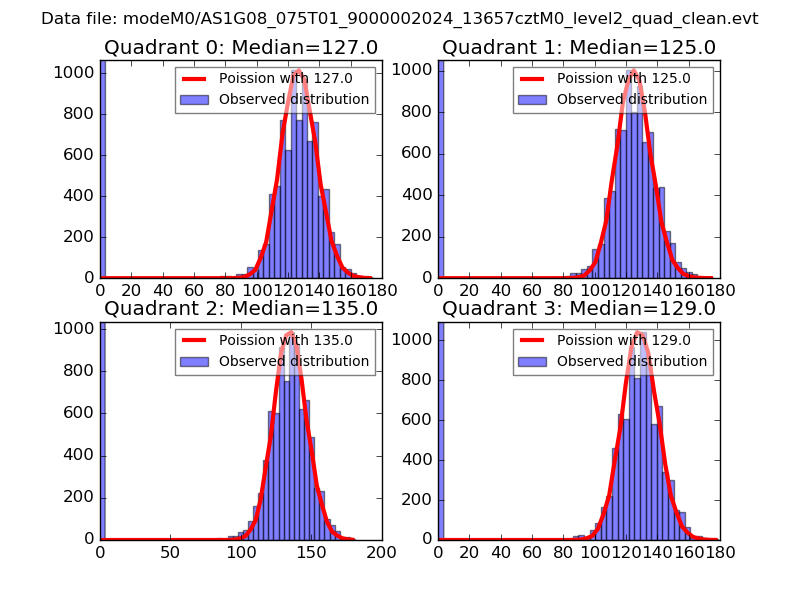 |
 |
| Quadrant-wise count rates Data is divided into 100 sec bins |
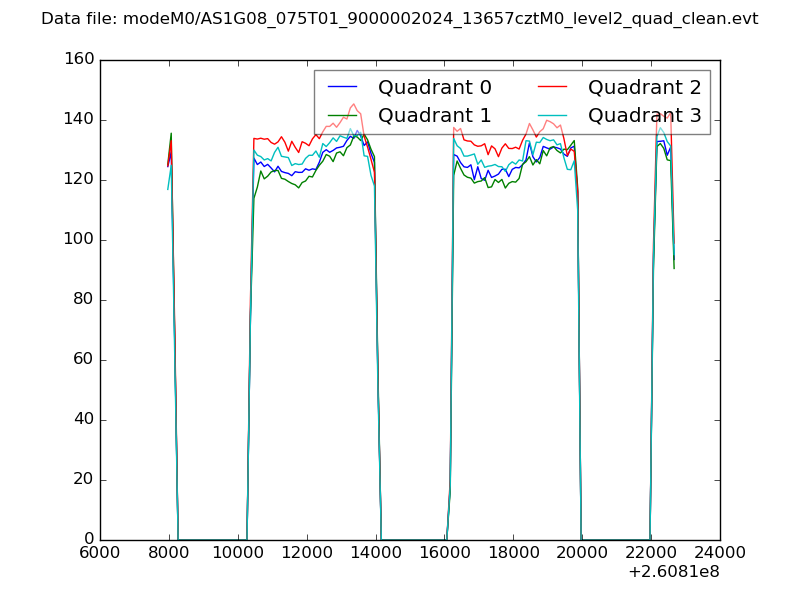 |
|
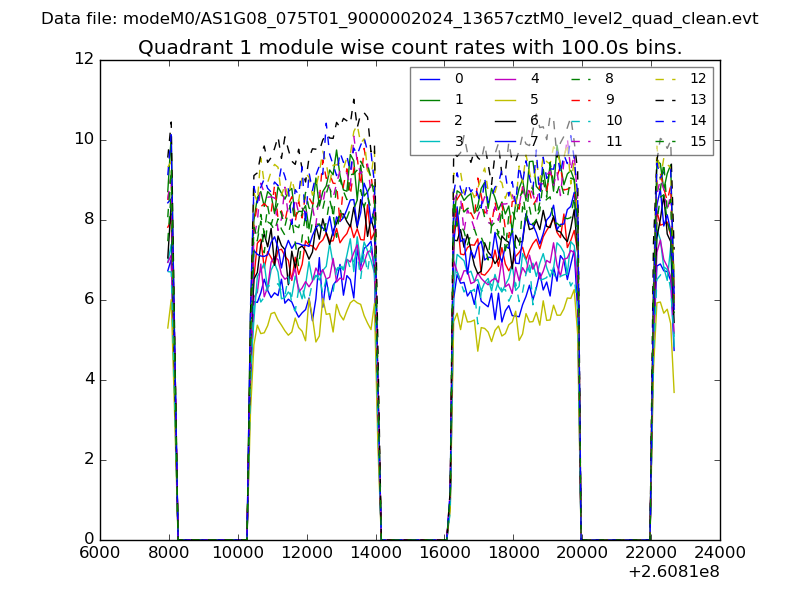
| Module-wise count rates for Quadrant A Data is divided into 100 sec bins |
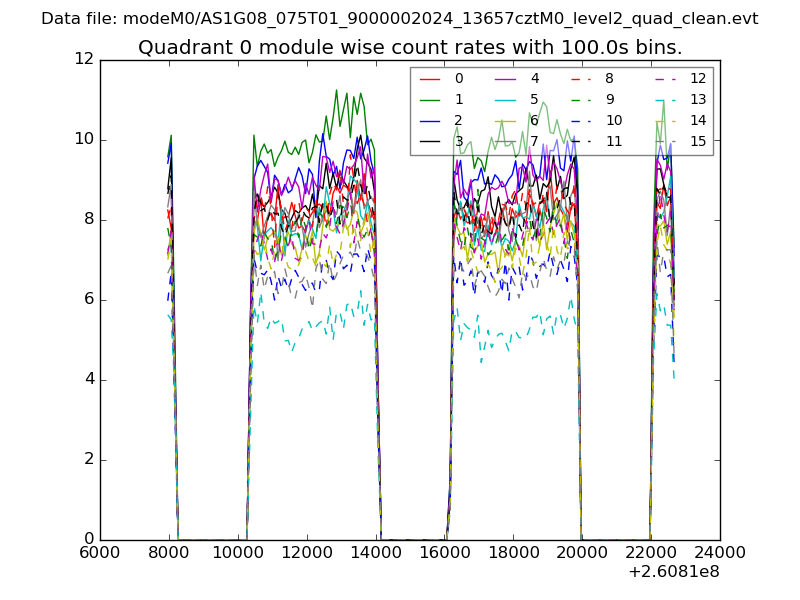 |
 |
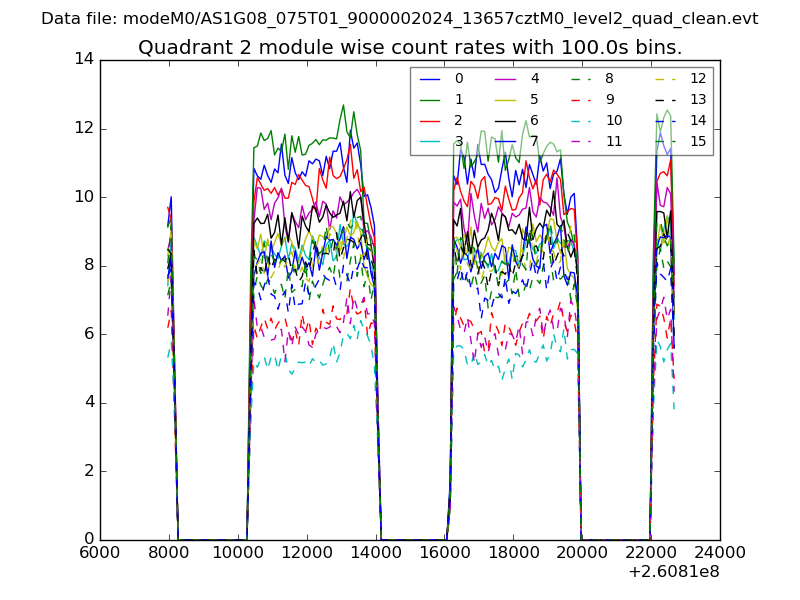
| Module-wise count rates for Quadrant B Data is divided into 100 sec bins |
 |
 |
| Module-wise count rates for Quadrant C Data is divided into 100 sec bins |
 |
 |
| Module-wise count rates for Quadrant D Data is divided into 100 sec bins |
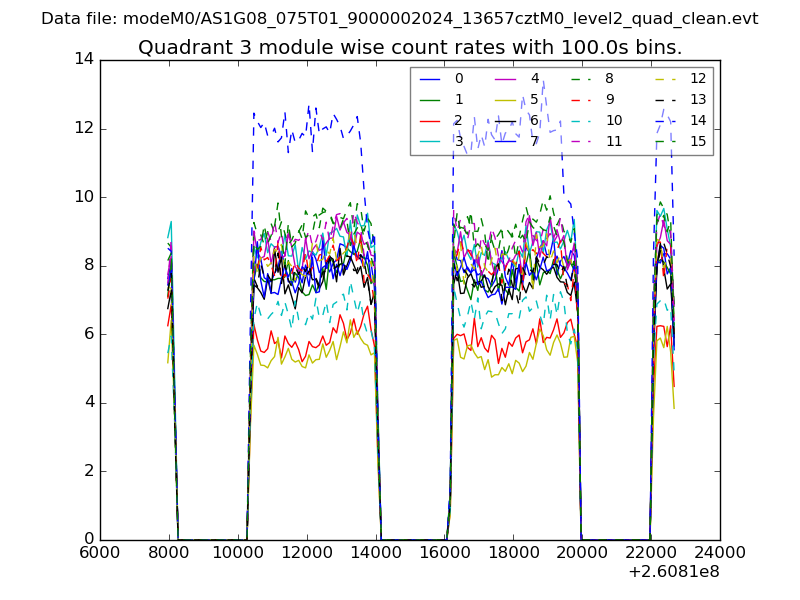 |
 |
| Parameter | Plot |
|---|---|
| CZT HV Monitor | 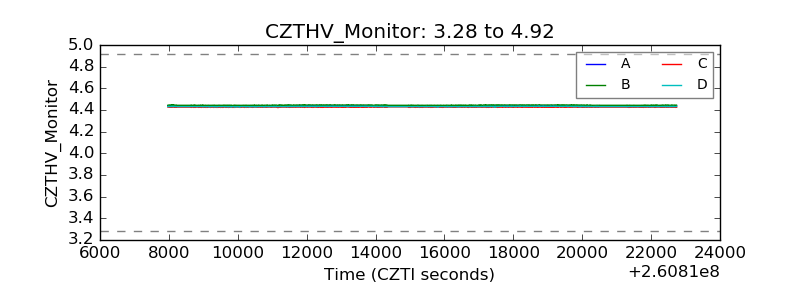 |
| D_VDD | 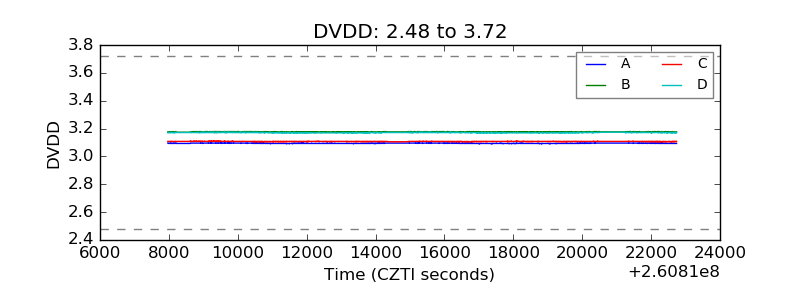 |
| Temperature 1 | 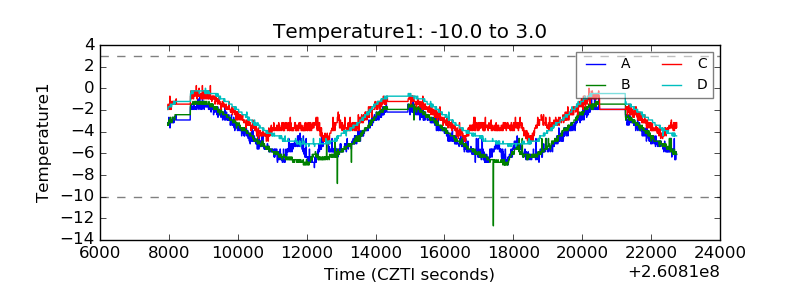 |
| Veto HV Monitor | 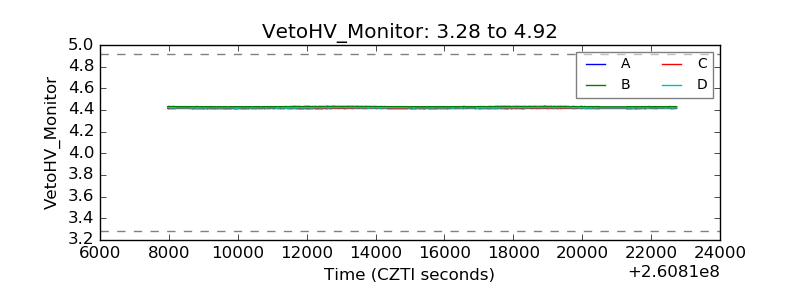 |
| Veto LLD | 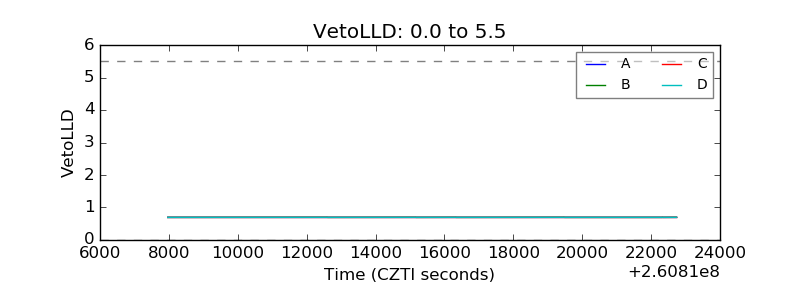 |
| Alpha Counter | 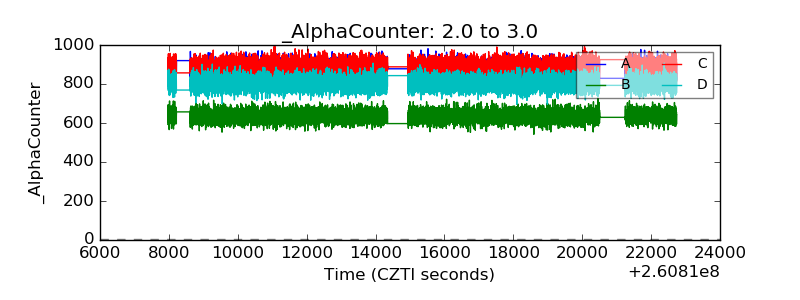 |
| _CPM_Rate | 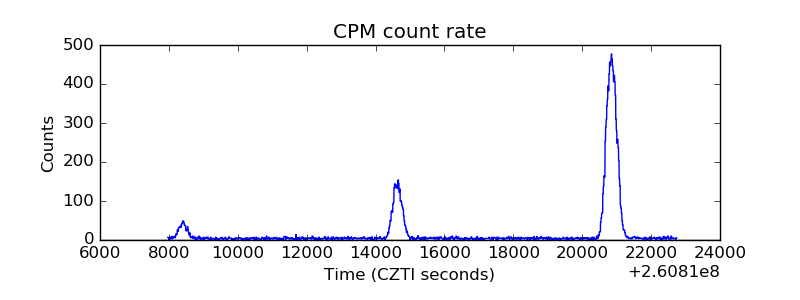 |
| CZT Counter | 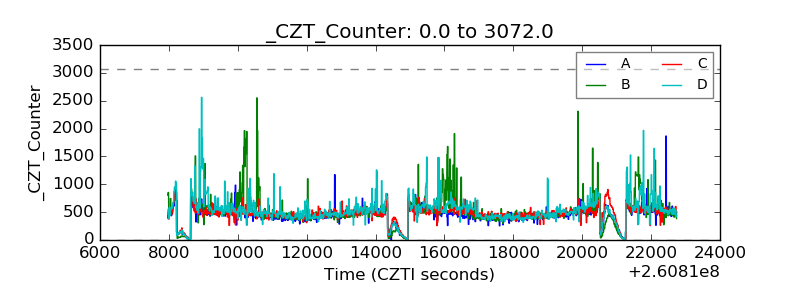 |
| +2.5 Volts monitor |  |
| +5 Volts monitor |  |
| _ROLL_ROT | 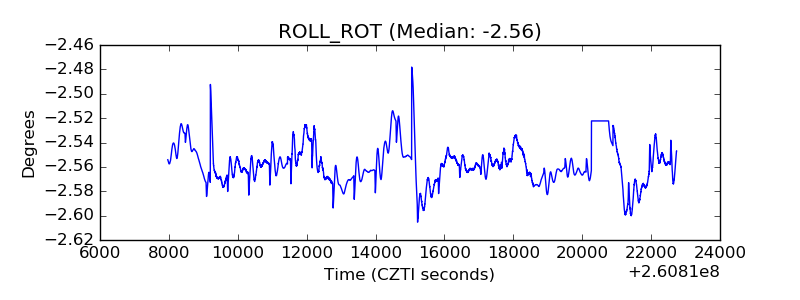 |
| _Roll_DEC |  |
| _Roll_RA | 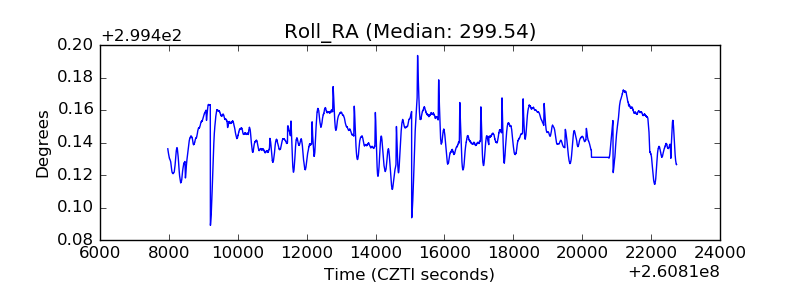 |
| Veto Counter | 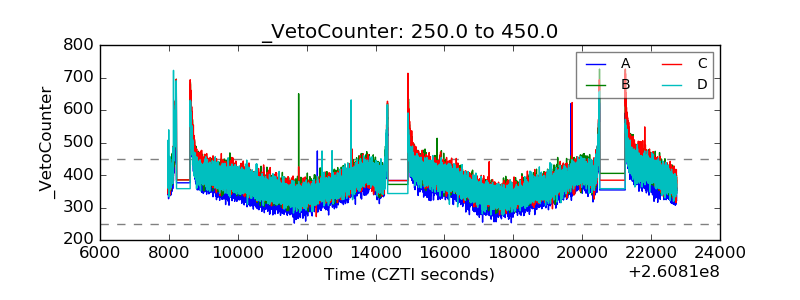 |