| Param | Original file | Final file |
|---|---|---|
| Filename | modeM0/AS1G08_075T01_9000002024_13659cztM0_level2.evt | modeM0/AS1G08_075T01_9000002024_13659cztM0_level2_quad_clean.evt |
| Size (bytes) | 268,992,000 | 54,915,840 |
| Size | 256.5 MB | 52.4 MB |
| Events in quadrant A | 2,058,586 | 338,658 |
| Events in quadrant B | 1,953,894 | 352,258 |
| Events in quadrant C | 1,880,098 | 367,587 |
| Events in quadrant D | 2,005,847 | 347,495 |
| Mode M9 | |||
|---|---|---|---|
| Quadrant | BADHDUFLAG | Total packets | Discarded packets |
| A | 0 | 11 | 0 |
| B | 0 | 11 | 0 |
| C | 0 | 11 | 0 |
| D | 0 | 12 | 1 |
| Mode M0 | |||
|---|---|---|---|
| Quadrant | BADHDUFLAG | Total packets | Discarded packets |
| A | 0 | 12296 | 3876 |
| B | 0 | 11391 | 3250 |
| C | 0 | 11038 | 3204 |
| D | 0 | 12013 | 3768 |
| Mode SS | |||
|---|---|---|---|
| Quadrant | BADHDUFLAG | Total packets | Discarded packets |
| A | 0 | 104 | 28 |
| B | 0 | 110 | 38 |
| C | 0 | 111 | 39 |
| D | 0 | 105 | 29 |
| Quadrant | Total seconds | Saturated seconds | Saturation percentage |
|---|---|---|---|
| A | 3596 | 50 | 1.390434% |
| B | 3640 | 53 | 1.456044% |
| C | 3638 | 32 | 0.879604% |
| D | 3642 | 46 | 1.263042% |
Noise dominated data is calculated using 1-second bins in cleaned event files. If a bin has >2000 counts, and if more than 50% of those come from <1% of pixels, then it is considered to be noise-dominated and hence unusable.
| Quadrant | # 1 sec bins | Bins with >0 counts | Bins with >2000 counts | High rate bins dominated by noise | Noise dominated (total time) | Noise dominated (detector-on time) | Marked lightcurve |
|---|---|---|---|---|---|---|---|
| A | 4863 | 3694 | 18 | 18 | 0.37% | 0.49% | 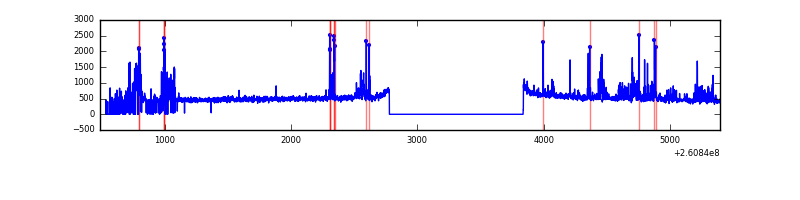 |
| B | 4855 | 3726 | 5 | 5 | 0.10% | 0.13% | 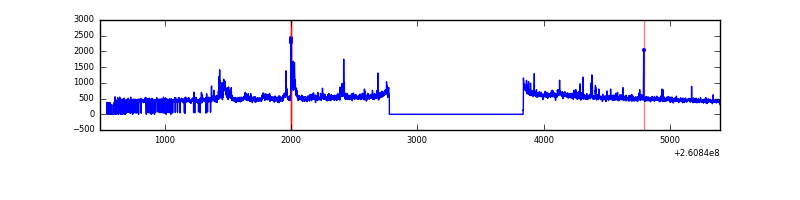 |
| C | 4909 | 3713 | 0 | 0 | 0.00% | 0.00% | 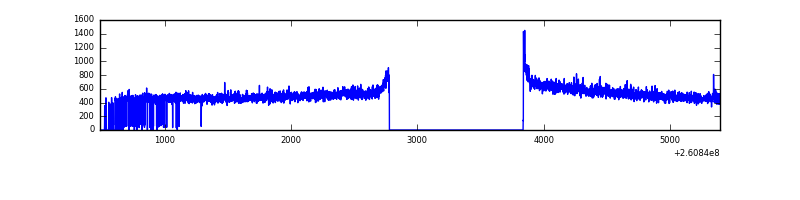 |
| D | 4870 | 3729 | 14 | 14 | 0.29% | 0.38% | 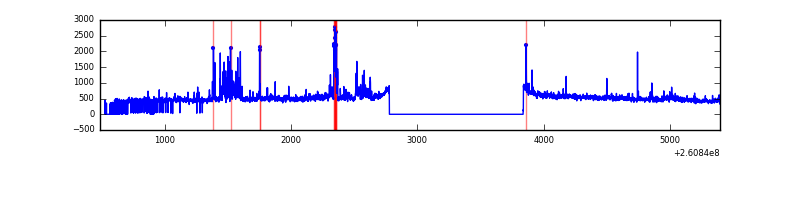 |
Top three noisy pixels from each quadrant. If the there are fewer than three noisy pixels in the level2.evt file, extra rows are filled as -1
| Pixel properties | Quadrant properties | ||||||
|---|---|---|---|---|---|---|---|
| Quadrant | DetID | PixID | Counts | Sigma | Mean | Median | Sigma |
| A | 9 | 143 | 262594 | 2772.37 | 455 | 445 | 94.6 |
| A | 15 | 69 | 31247 | 325.75 | 455 | 445 | 94.6 |
| A | 1 | 162 | 6103 | 59.84 | 455 | 445 | 94.6 |
| B | 0 | 219 | 69325 | 778.57 | 460 | 449 | 88.5 |
| B | 3 | 64 | 33018 | 368.15 | 460 | 449 | 88.5 |
| B | 4 | 142 | 22210 | 245.98 | 460 | 449 | 88.5 |
| C | 3 | 233 | 112715 | 1053.01 | 453 | 457 | 106.6 |
| C | 13 | 61 | 3369 | 27.32 | 453 | 457 | 106.6 |
| C | 3 | 202 | 1108 | 6.11 | 453 | 457 | 106.6 |
| D | 5 | 222 | 172927 | 1578.93 | 449 | 437 | 109.2 |
| D | 8 | 195 | 73935 | 672.78 | 449 | 437 | 109.2 |
| D | 12 | 110 | 25204 | 226.71 | 449 | 437 | 109.2 |
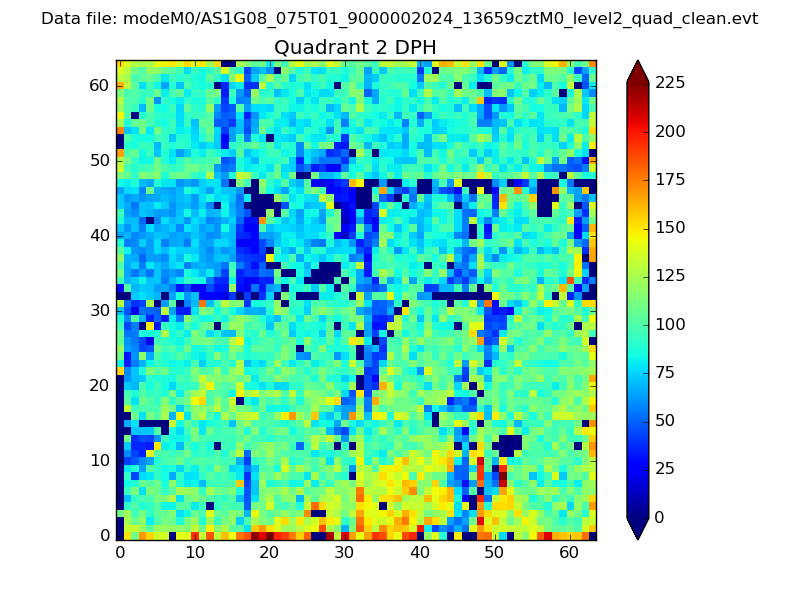
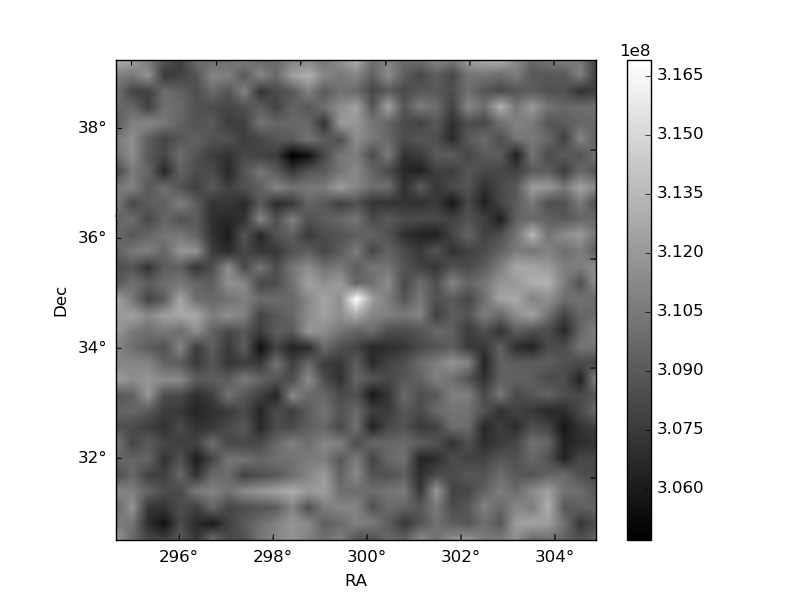
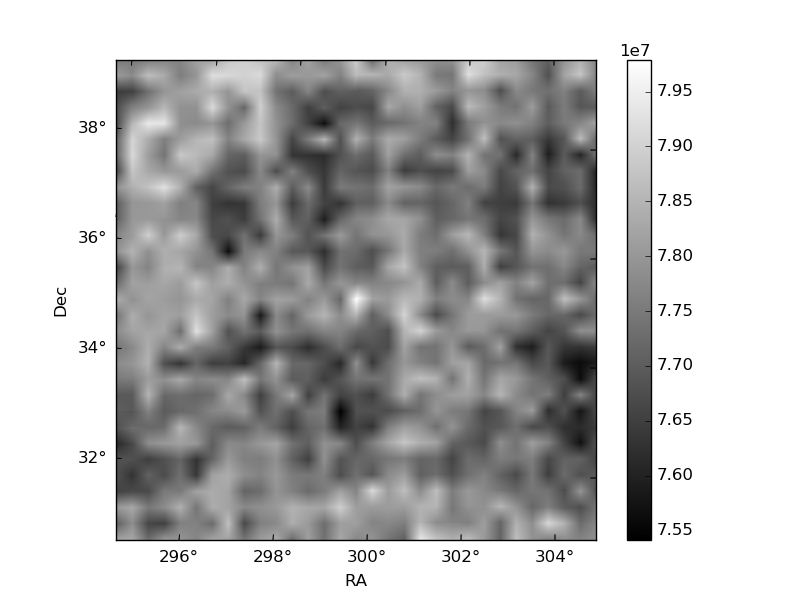
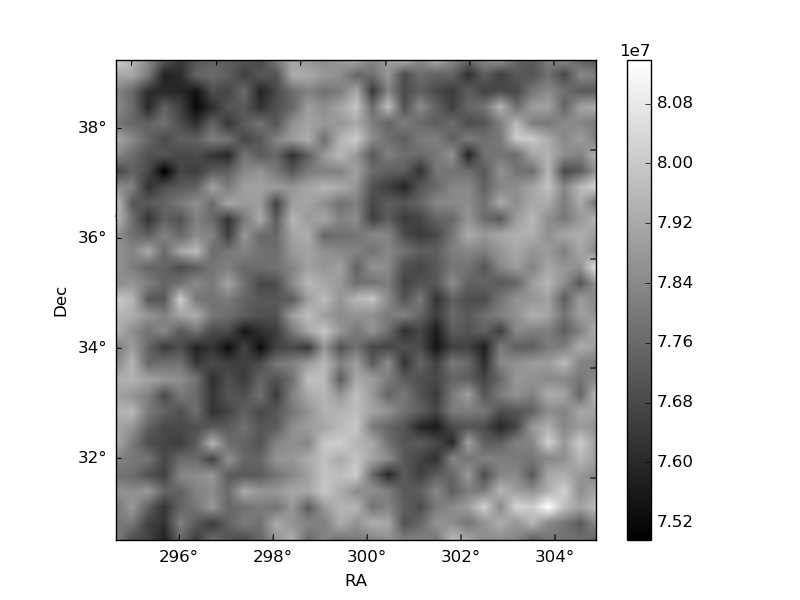
Histogram calculated using DETX and DETY for each event in the final _common_clean file
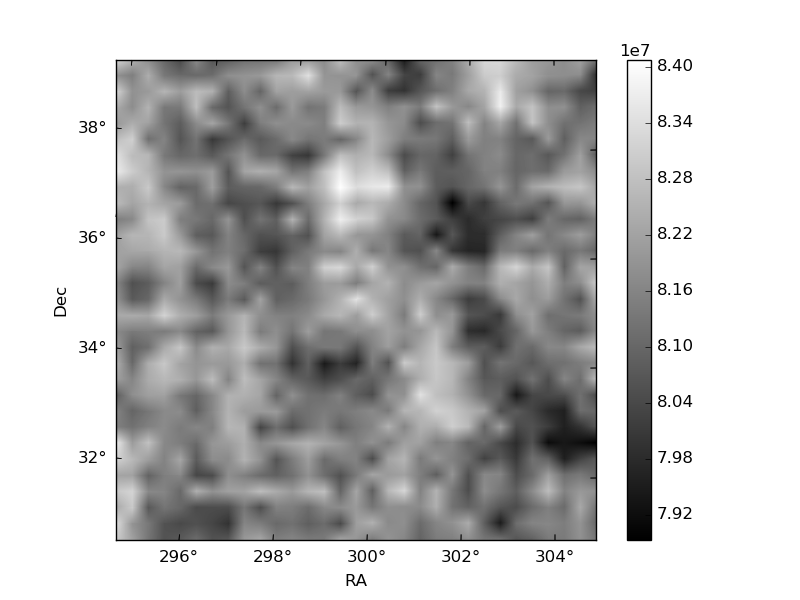
| Quadrant A | 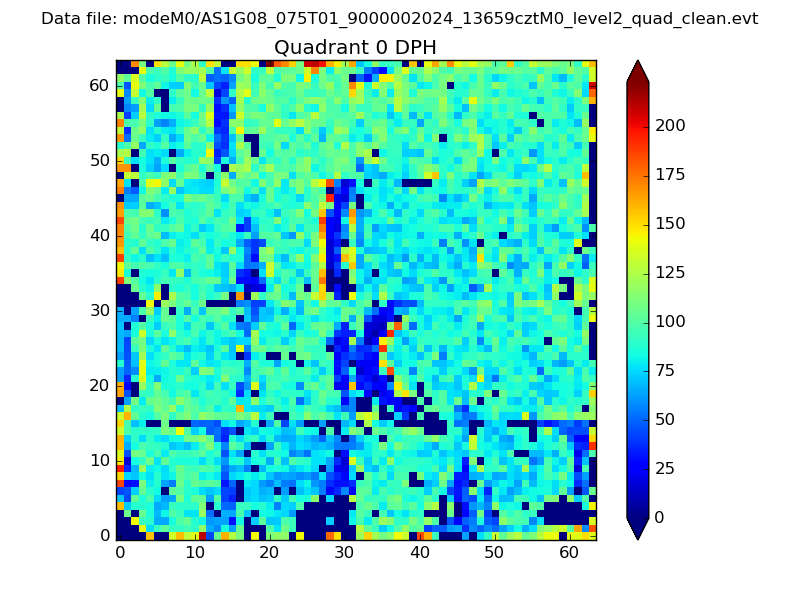 |
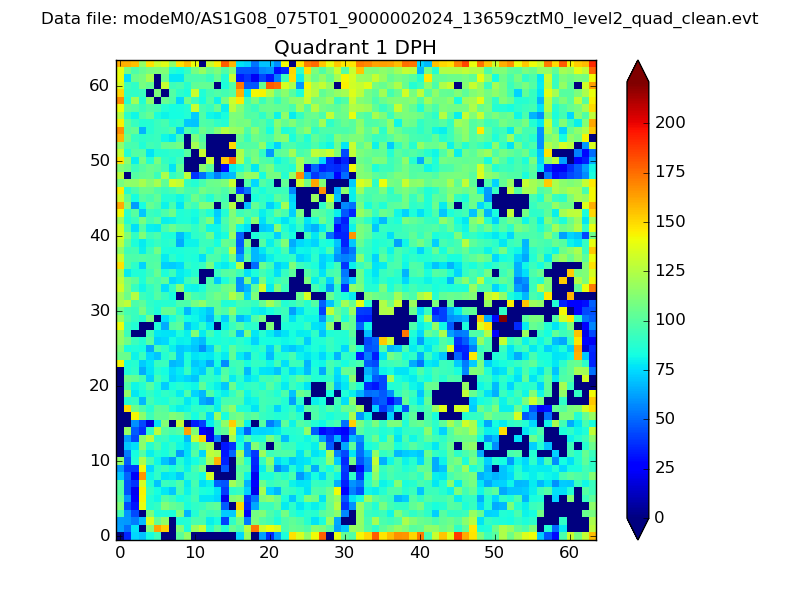 |
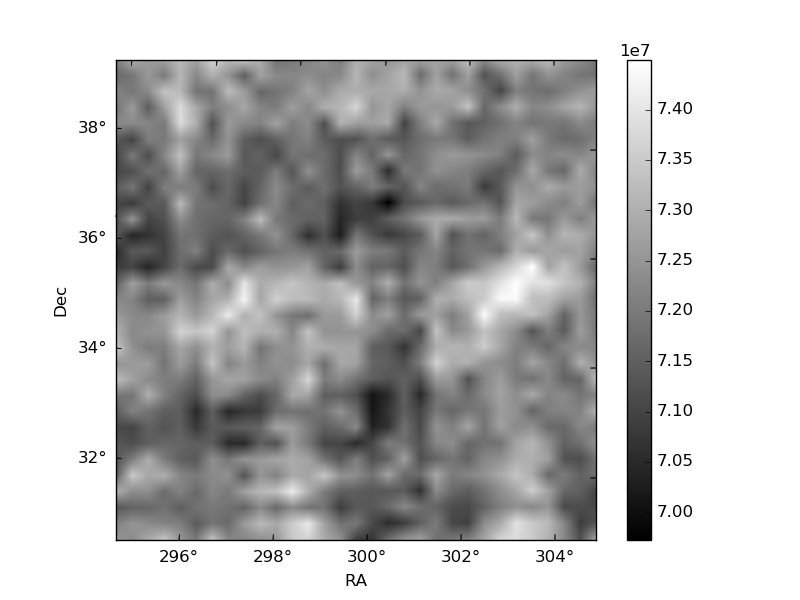
Quadrant B |
|---|---|---|---|
| Quadrant D | 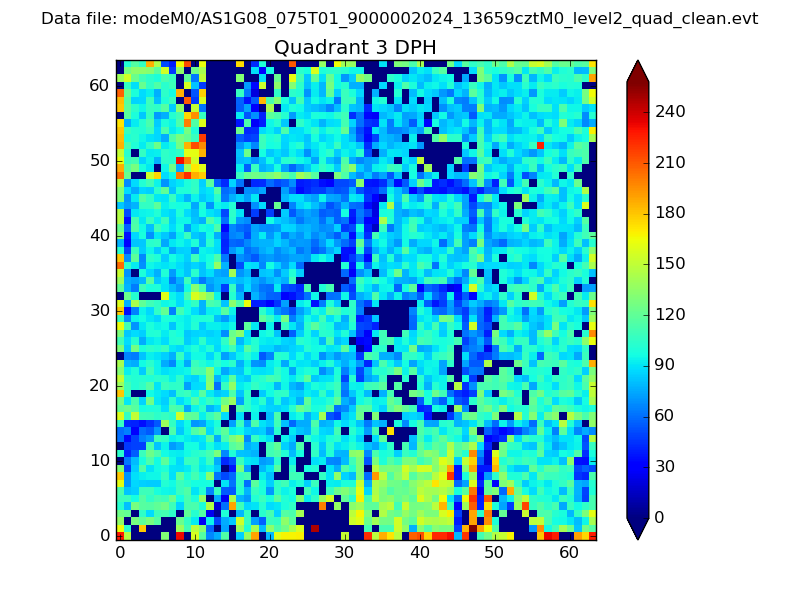 |
 |
Quadrant C |
| Plot type | Count rate plots | Images |
|---|---|---|
| Comparison with Poisson distribution Blue bars denote a histogram of data divided into 1 sec bins. Red curve is a Poisson curve with rate = median count rate of data. |
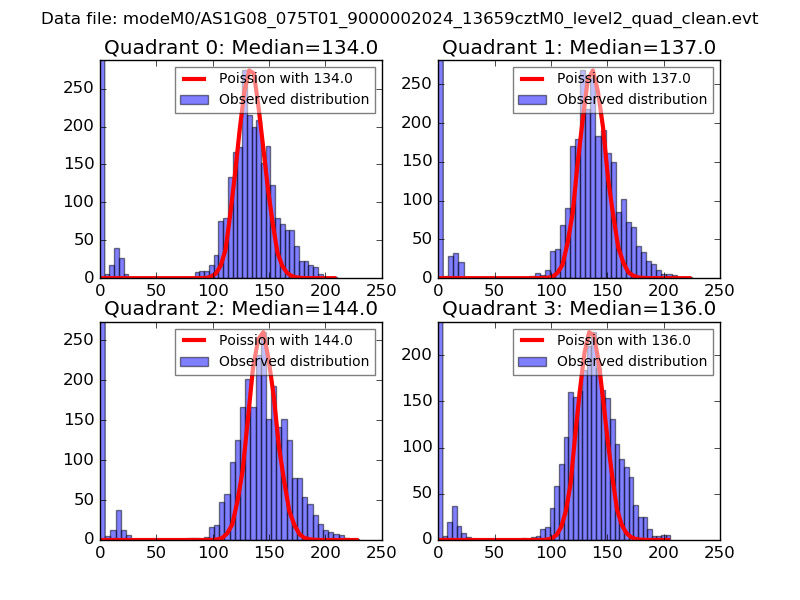 |
 |
| Quadrant-wise count rates Data is divided into 100 sec bins |
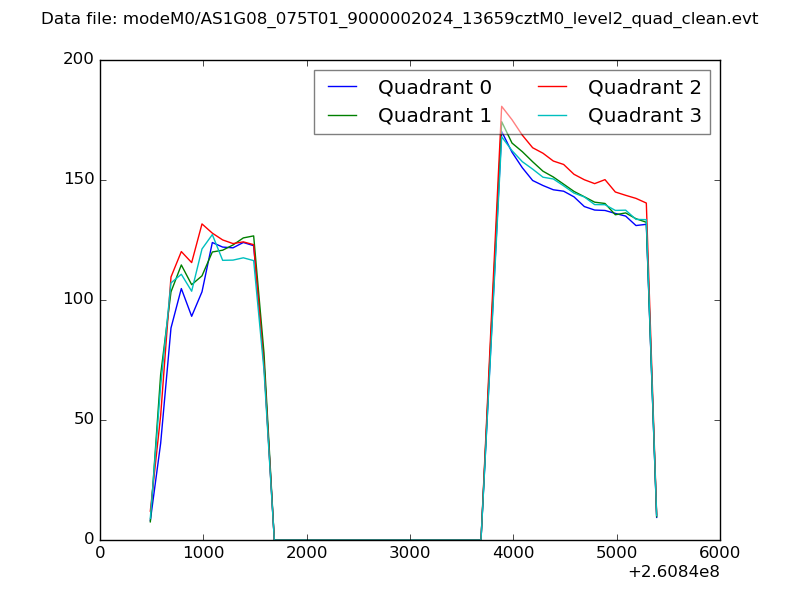 |
|
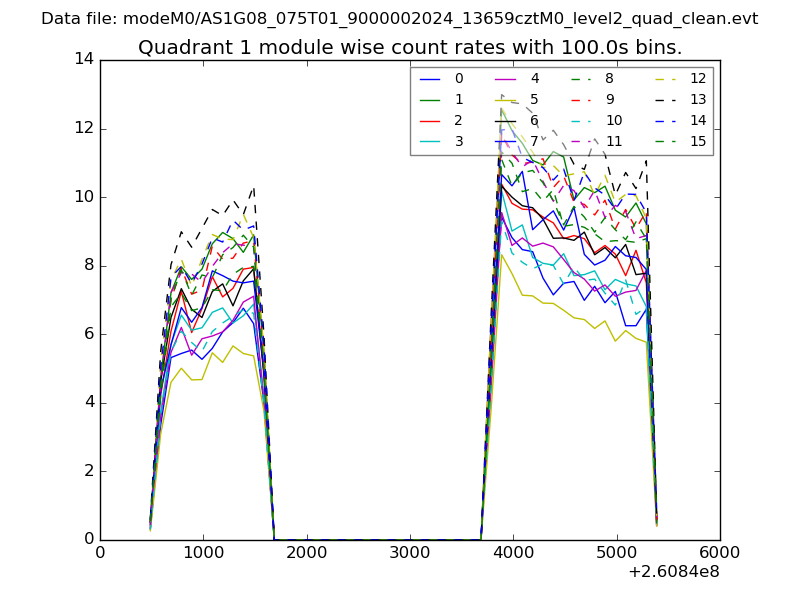
| Module-wise count rates for Quadrant A Data is divided into 100 sec bins |
 |
 |
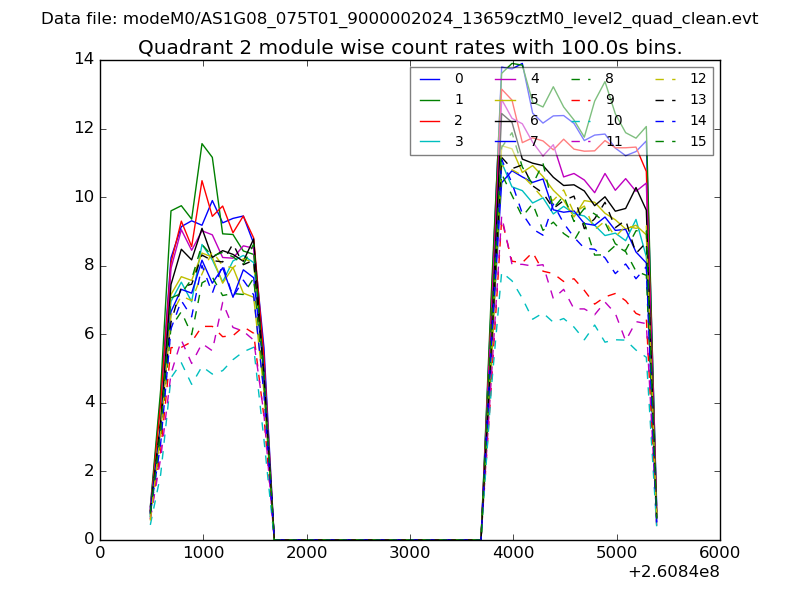
| Module-wise count rates for Quadrant B Data is divided into 100 sec bins |
 |
 |
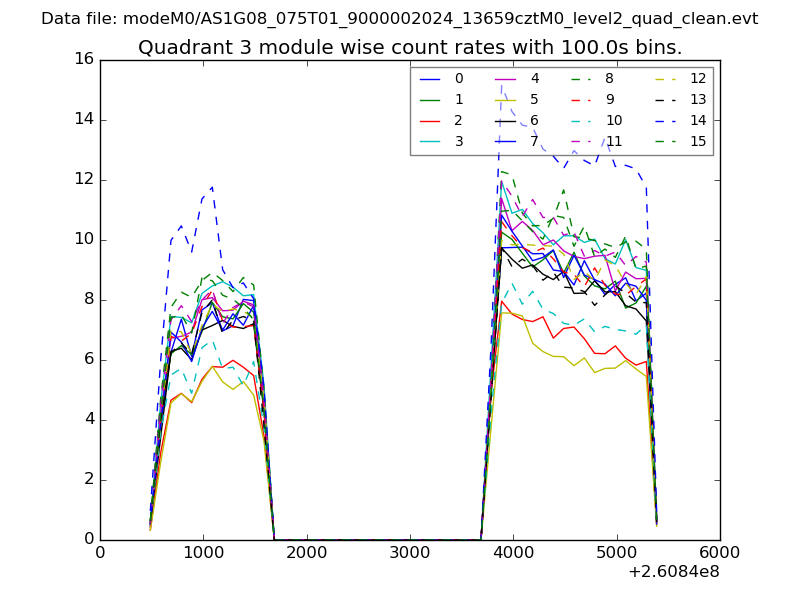
| Module-wise count rates for Quadrant C Data is divided into 100 sec bins |
 |
 |
| Module-wise count rates for Quadrant D Data is divided into 100 sec bins |
 |
 |
| Parameter | Plot |
|---|---|
| CZT HV Monitor | 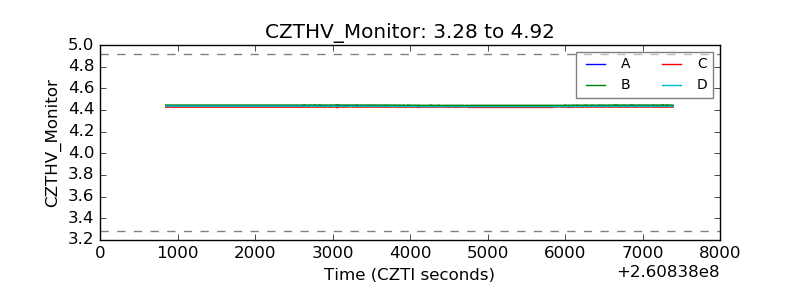 |
| D_VDD |  |
| Temperature 1 | 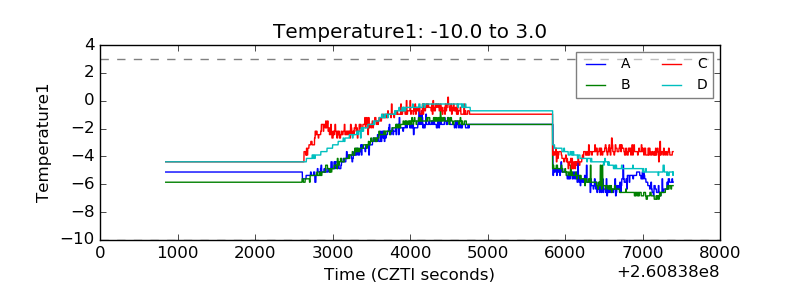 |
| Veto HV Monitor | 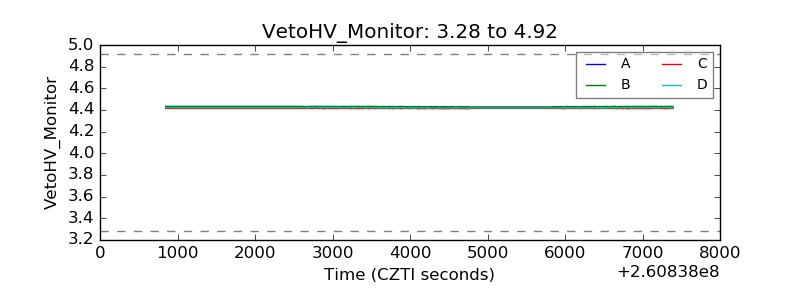 |
| Veto LLD | 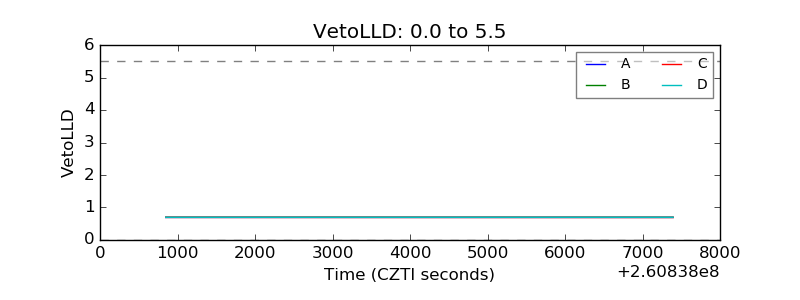 |
| Alpha Counter | 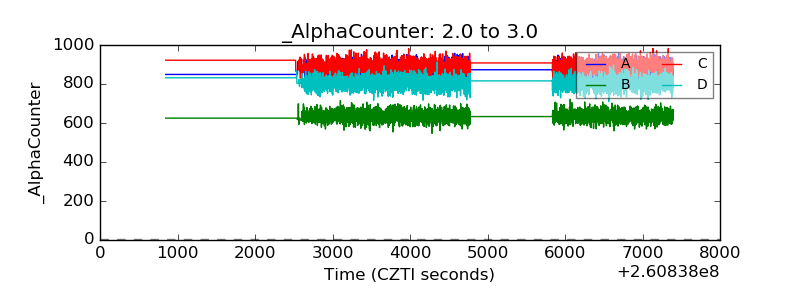 |
| _CPM_Rate | 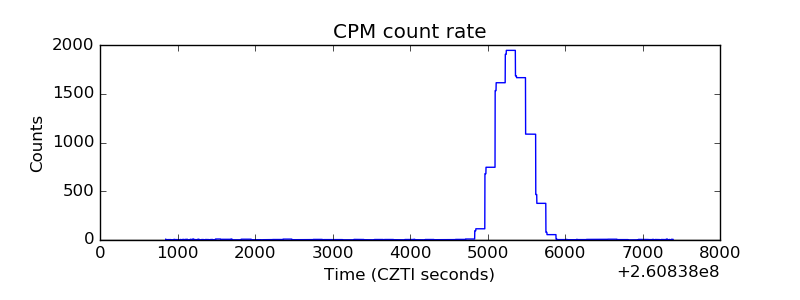 |
| CZT Counter | 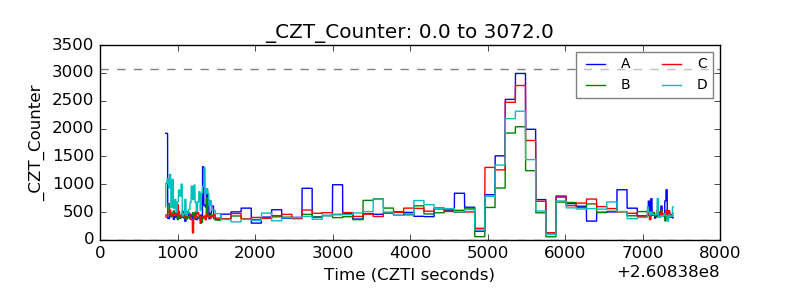 |
| +2.5 Volts monitor |  |
| +5 Volts monitor |  |
| _ROLL_ROT | 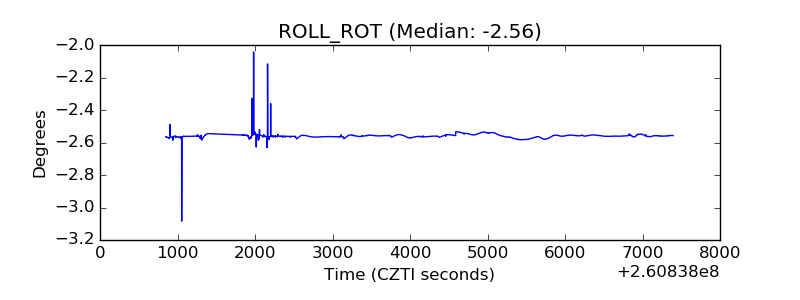 |
| _Roll_DEC | 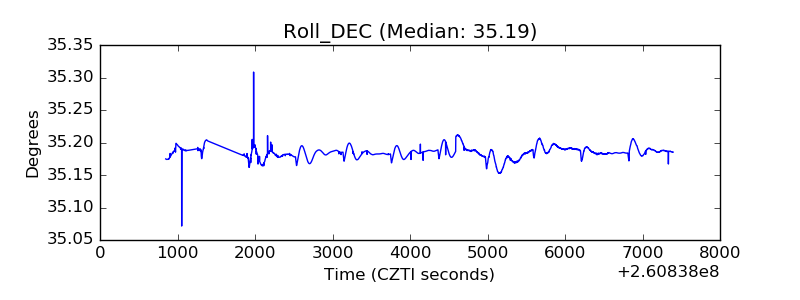 |
| _Roll_RA | 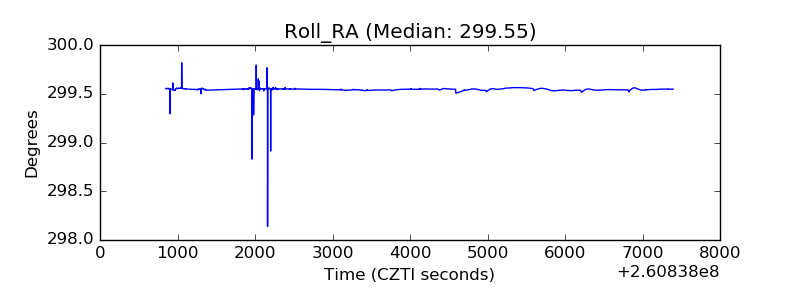 |
| Veto Counter | 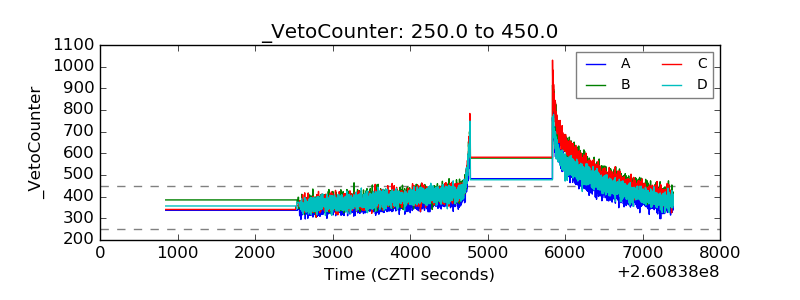 |