| Param | Original file | Final file |
|---|---|---|
| Filename | modeM0/AS1G08_075T01_9000002024_13661cztM0_level2.evt | modeM0/AS1G08_075T01_9000002024_13661cztM0_level2_quad_clean.evt |
| Size (bytes) | 583,704,000 | 138,772,800 |
| Size | 556.7 MB | 132.3 MB |
| Events in quadrant A | 4,794,343 | 880,687 |
| Events in quadrant B | 3,906,026 | 900,537 |
| Events in quadrant C | 3,896,330 | 957,137 |
| Events in quadrant D | 4,535,369 | 905,658 |
| Mode M9 | |||
|---|---|---|---|
| Quadrant | BADHDUFLAG | Total packets | Discarded packets |
| A | 0 | 11 | 0 |
| B | 0 | 11 | 0 |
| C | 0 | 11 | 0 |
| D | 0 | 11 | 0 |
| Mode M0 | |||
|---|---|---|---|
| Quadrant | BADHDUFLAG | Total packets | Discarded packets |
| A | 0 | 19725 | 1 |
| B | 0 | 17156 | 1 |
| C | 0 | 16717 | 1 |
| D | 0 | 18901 | 1 |
| Mode SS | |||
|---|---|---|---|
| Quadrant | BADHDUFLAG | Total packets | Discarded packets |
| A | 0 | 162 | 0 |
| B | 0 | 162 | 0 |
| C | 0 | 162 | 0 |
| D | 0 | 162 | 0 |
| Quadrant | Total seconds | Saturated seconds | Saturation percentage |
|---|---|---|---|
| A | 8048 | 247 | 3.069085% |
| B | 8048 | 68 | 0.844930% |
| C | 8048 | 32 | 0.397614% |
| D | 8048 | 56 | 0.695825% |
Noise dominated data is calculated using 1-second bins in cleaned event files. If a bin has >2000 counts, and if more than 50% of those come from <1% of pixels, then it is considered to be noise-dominated and hence unusable.
| Quadrant | # 1 sec bins | Bins with >0 counts | Bins with >2000 counts | High rate bins dominated by noise | Noise dominated (total time) | Noise dominated (detector-on time) | Marked lightcurve |
|---|---|---|---|---|---|---|---|
| A | 9109 | 8050 | 207 | 207 | 2.27% | 2.57% | 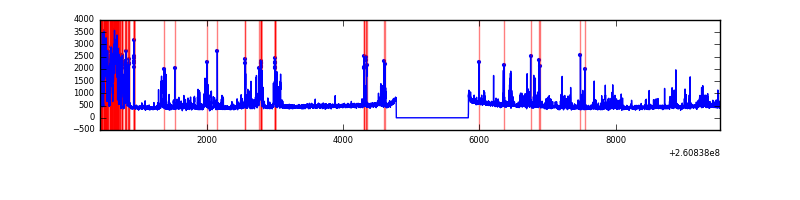 |
| B | 9109 | 8050 | 15 | 15 | 0.16% | 0.19% | 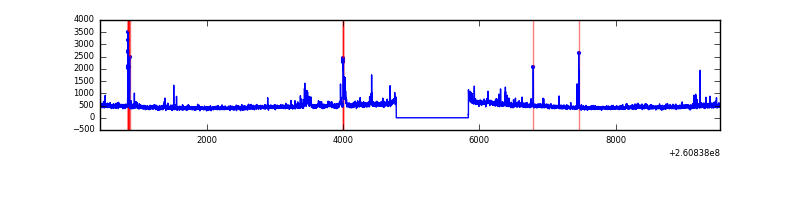 |
| C | 9109 | 8050 | 0 | 0 | 0.00% | 0.00% | 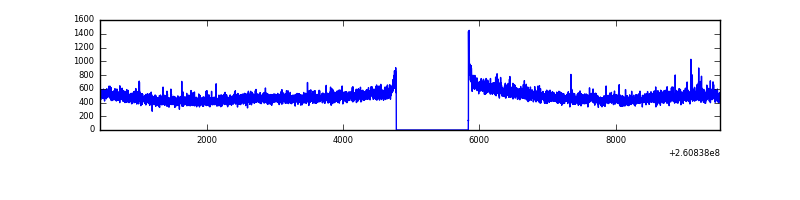 |
| D | 9109 | 8050 | 34 | 34 | 0.37% | 0.42% | 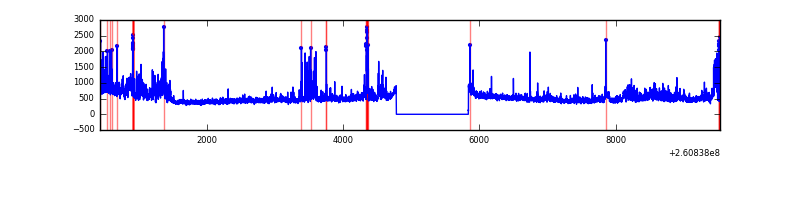 |
Top three noisy pixels from each quadrant. If the there are fewer than three noisy pixels in the level2.evt file, extra rows are filled as -1
| Pixel properties | Quadrant properties | ||||||
|---|---|---|---|---|---|---|---|
| Quadrant | DetID | PixID | Counts | Sigma | Mean | Median | Sigma |
| A | 9 | 143 | 1194143 | 6335.86 | 923 | 904 | 188.3 |
| A | 15 | 69 | 32028 | 165.26 | 923 | 904 | 188.3 |
| A | 0 | 226 | 8254 | 39.03 | 923 | 904 | 188.3 |
| B | 0 | 219 | 104301 | 583.7 | 935 | 913 | 177.1 |
| B | 3 | 64 | 38070 | 209.78 | 935 | 913 | 177.1 |
| B | 0 | 244 | 35456 | 195.02 | 935 | 913 | 177.1 |
| C | 3 | 233 | 284584 | 1314.38 | 926 | 933 | 215.8 |
| C | 13 | 61 | 6698 | 26.71 | 926 | 933 | 215.8 |
| C | 14 | 234 | 2230 | 6.01 | 926 | 933 | 215.8 |
| D | 5 | 222 | 686413 | 3099.93 | 915 | 892 | 221.1 |
| D | 8 | 195 | 233808 | 1053.25 | 915 | 892 | 221.1 |
| D | 13 | 122 | 61770 | 275.29 | 915 | 892 | 221.1 |
Histogram calculated using DETX and DETY for each event in the final _common_clean file
| Quadrant A | 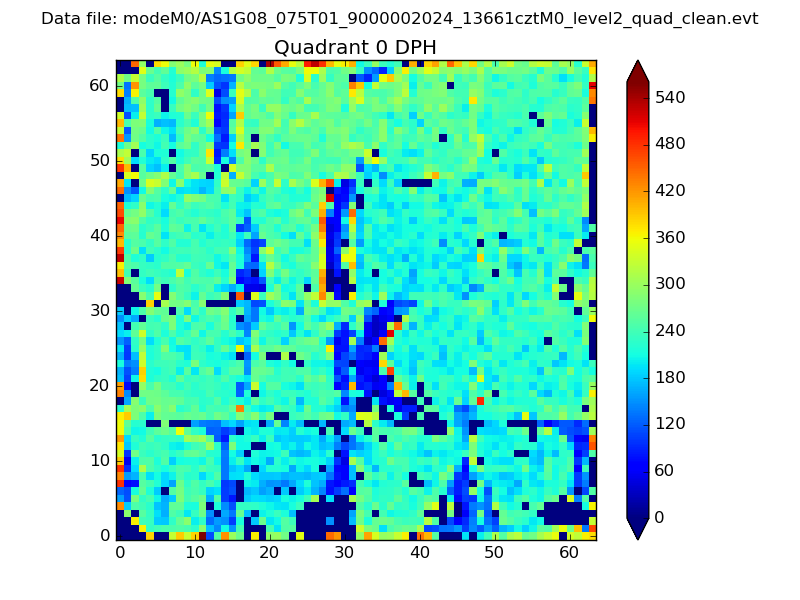 |
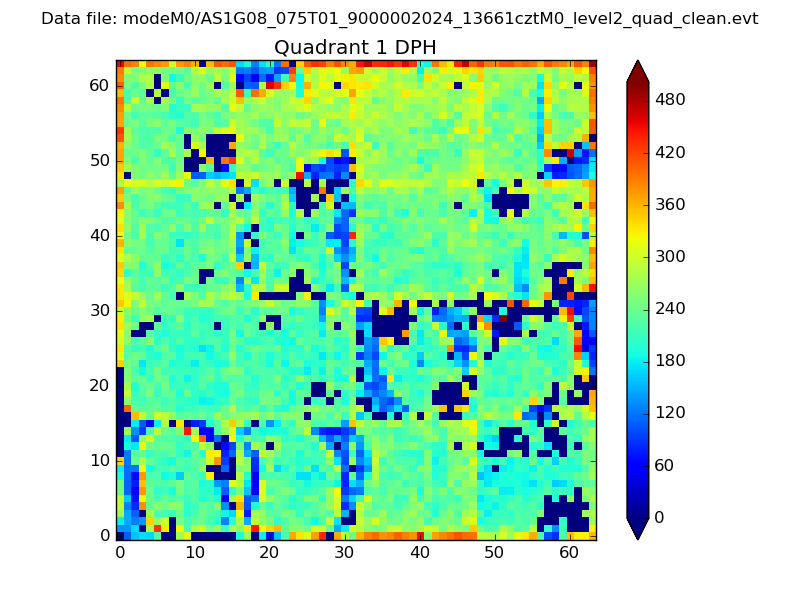 |
Quadrant B |
|---|---|---|---|
| Quadrant D | 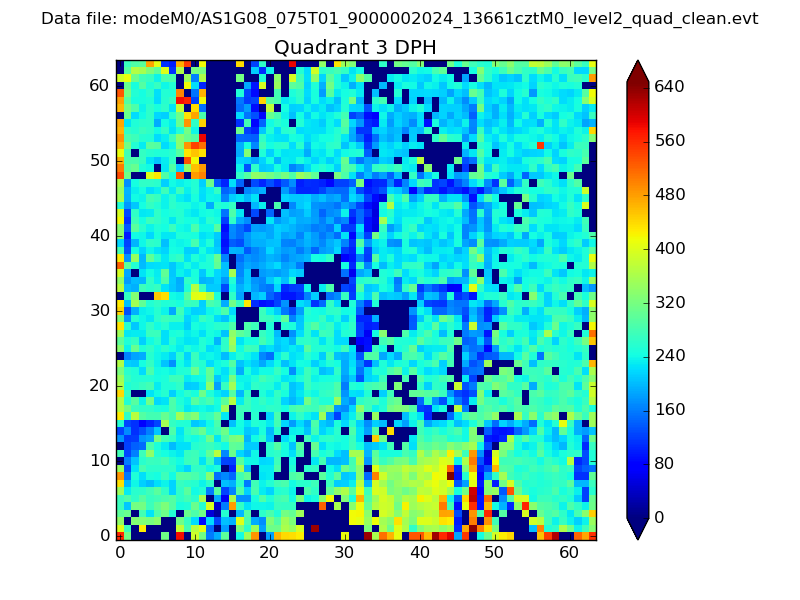 |
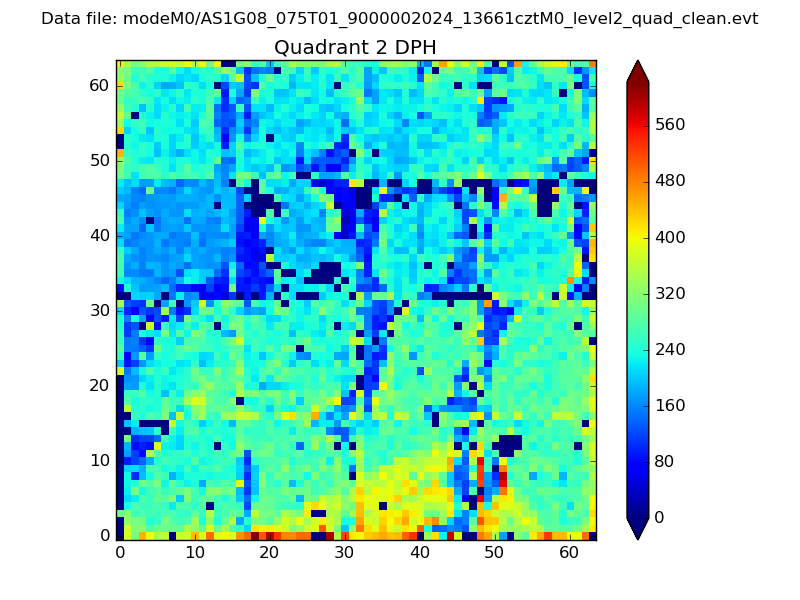 |
Quadrant C |
| Plot type | Count rate plots | Images |
|---|---|---|
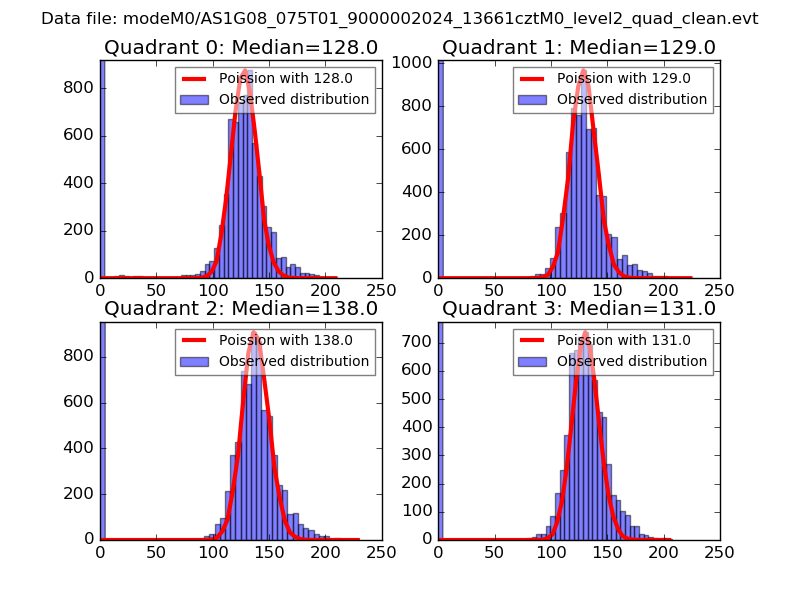
| Comparison with Poisson distribution Blue bars denote a histogram of data divided into 1 sec bins. Red curve is a Poisson curve with rate = median count rate of data. |
 |
 |
| Quadrant-wise count rates Data is divided into 100 sec bins |
 |
|
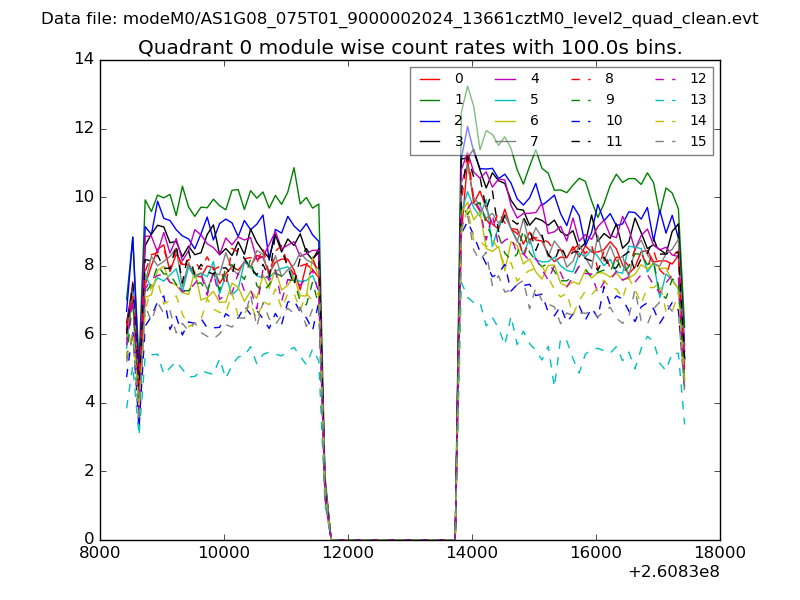
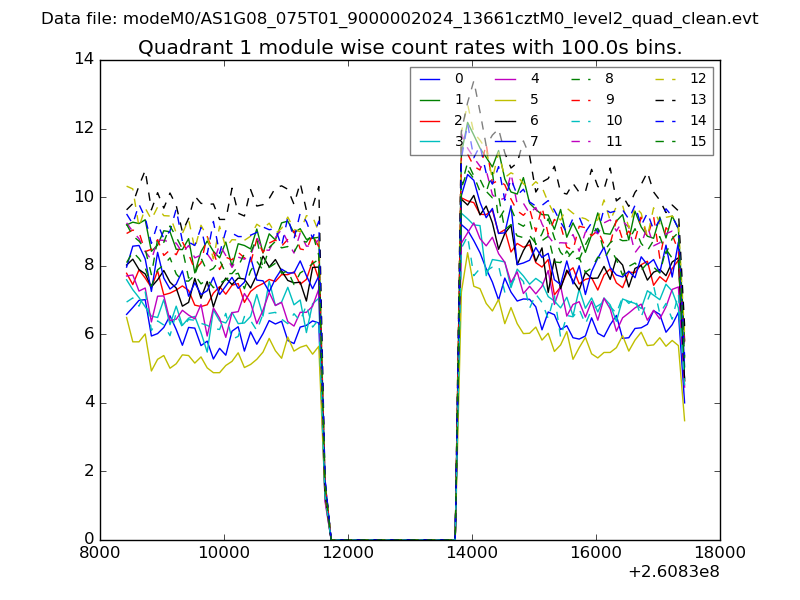
| Module-wise count rates for Quadrant A Data is divided into 100 sec bins |
 |
 |
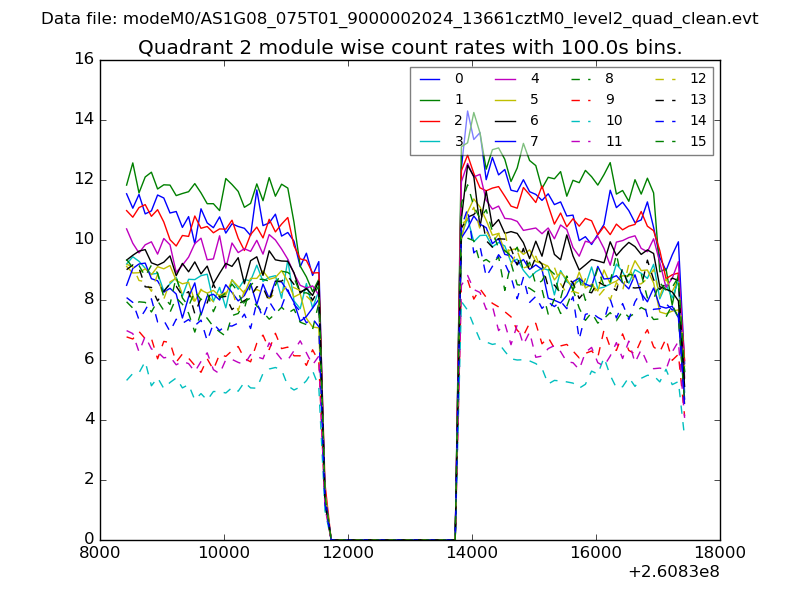
| Module-wise count rates for Quadrant B Data is divided into 100 sec bins |
 |
 |
| Module-wise count rates for Quadrant C Data is divided into 100 sec bins |
 |
 |
| Module-wise count rates for Quadrant D Data is divided into 100 sec bins |
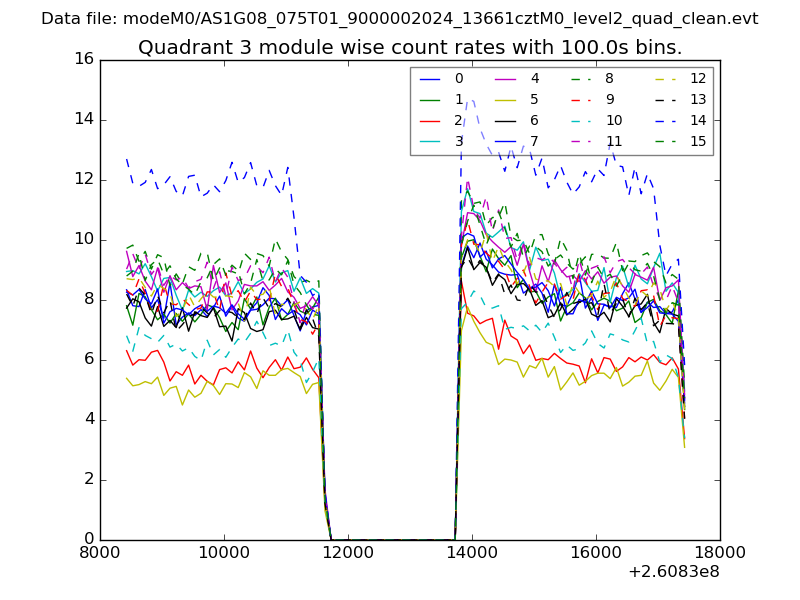 |
 |
| Parameter | Plot |
|---|---|
| CZT HV Monitor | 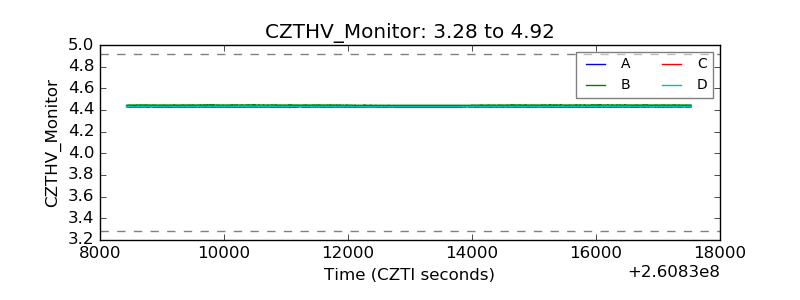 |
| D_VDD | 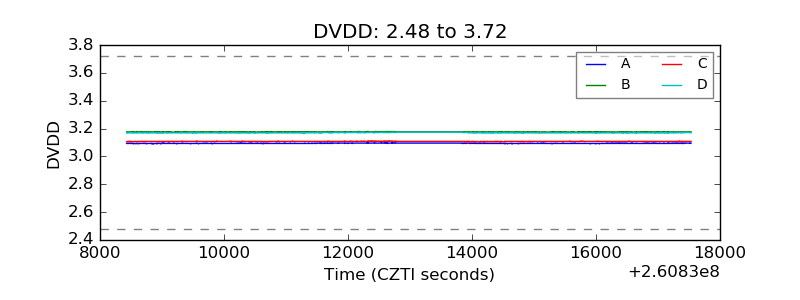 |
| Temperature 1 | 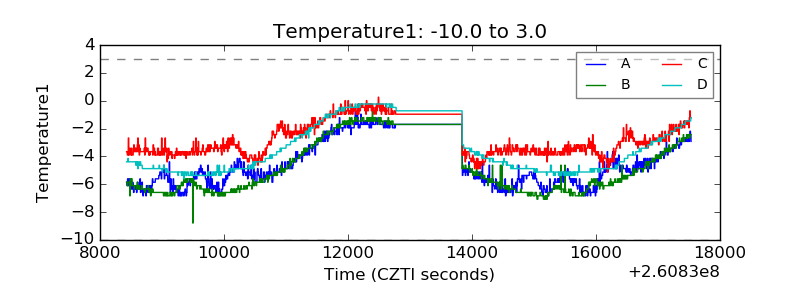 |
| Veto HV Monitor | 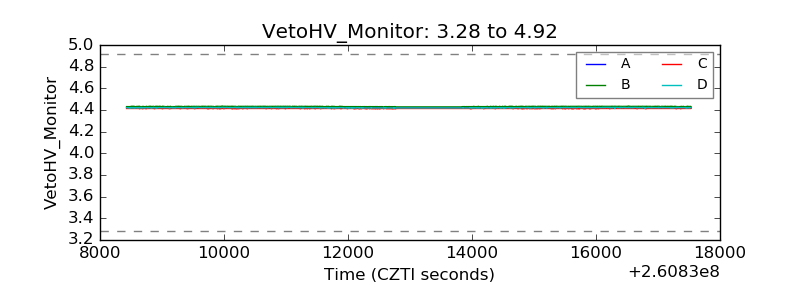 |
| Veto LLD | 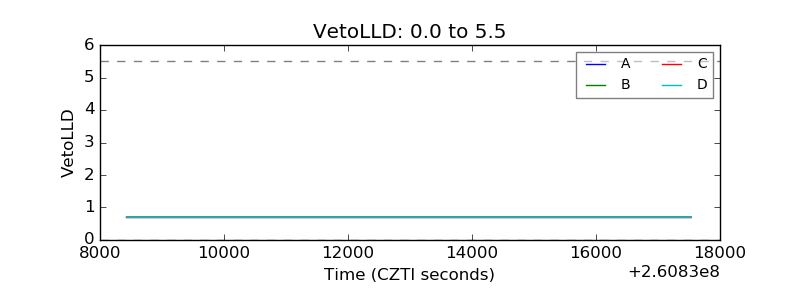 |
| Alpha Counter |  |
| _CPM_Rate | 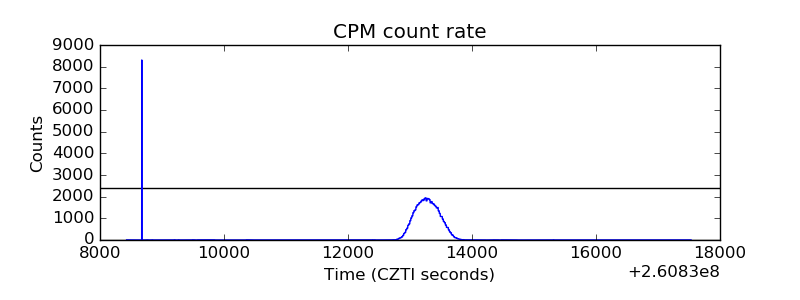 |
| CZT Counter | 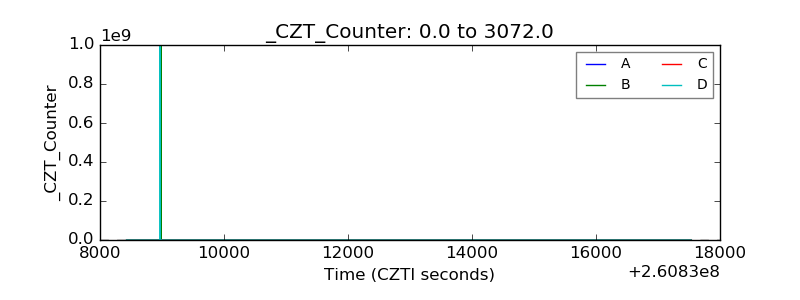 |
| +2.5 Volts monitor |  |
| +5 Volts monitor |  |
| _ROLL_ROT | 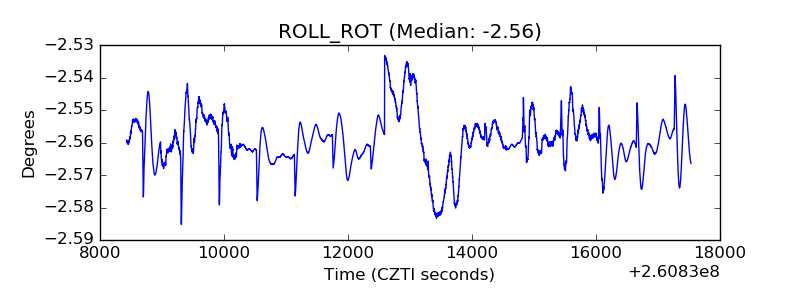 |
| _Roll_DEC | 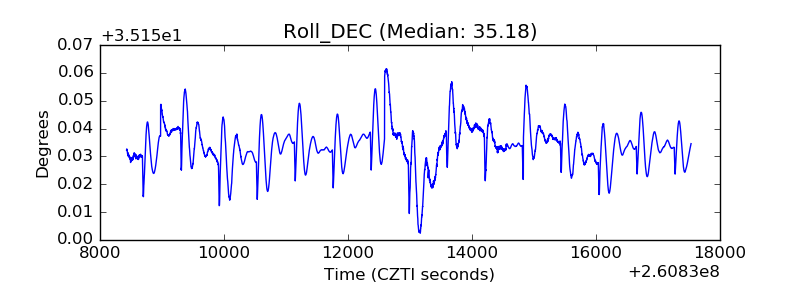 |
| _Roll_RA | 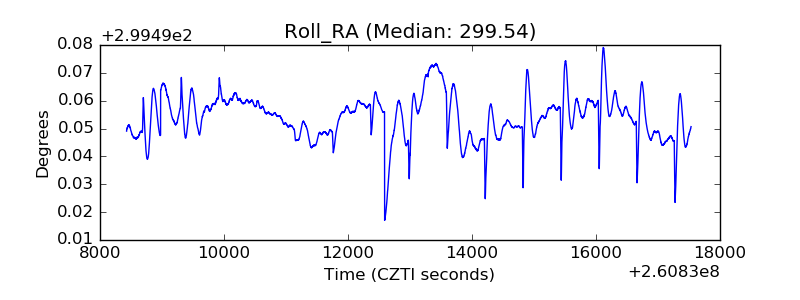 |
| Veto Counter | 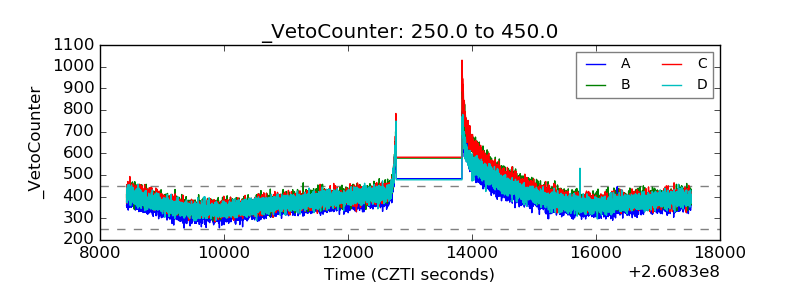 |