| Param | Original file | Final file |
|---|---|---|
| Filename | modeM0/AS1G08_070T01_9000002028cztM0_level2.fits | modeM0/AS1G08_070T01_9000002028cztM0_level2_quad_clean.evt |
| Size (bytes) | 1,655,242,560 | 1,437,575,040 |
| Size | 1.5 GB | 1.3 GB |
| Events in quadrant A | 10,241,858 | 8,465,676 |
| Events in quadrant B | 9,853,628 | 9,012,734 |
| Events in quadrant C | 9,994,654 | 7,666,006 |
| Events in quadrant D | 8,437,856 | 6,794,940 |
| Mode SS | |||
|---|---|---|---|
| Quadrant | BADHDUFLAG | Total packets | Discarded packets |
| A | 0 | 3442 | 0 |
| B | 0 | 3442 | 0 |
| C | 0 | 3442 | 0 |
| D | 0 | 3442 | 0 |
| Mode M9 | |||
|---|---|---|---|
| Quadrant | BADHDUFLAG | Total packets | Discarded packets |
| A | 0 | 250 | 0 |
| B | 0 | 250 | 0 |
| C | 0 | 250 | 0 |
| D | 0 | 250 | 0 |
| Mode M0 | |||
|---|---|---|---|
| Quadrant | BADHDUFLAG | Total packets | Discarded packets |
| A | 0 | 353077 | 0 |
| B | 0 | 384396 | 0 |
| C | 0 | 357583 | 0 |
| D | 0 | 486259 | 0 |
| Quadrant | Total seconds | Saturated seconds | Saturation percentage |
|---|---|---|---|
| A | 169294 | 2594 | 1.532246% |
| B | 169294 | 4510 | 2.664005% |
| C | 169294 | 1842 | 1.088048% |
| D | 169294 | 9490 | 5.605633% |
Noise dominated data is calculated using 1-second bins in cleaned event files. If a bin has >2000 counts, and if more than 50% of those come from <1% of pixels, then it is considered to be noise-dominated and hence unusable.
| Quadrant | # 1 sec bins | Bins with >0 counts | Bins with >2000 counts | High rate bins dominated by noise | Noise dominated (total time) | Noise dominated (detector-on time) | Marked lightcurve |
|---|---|---|---|---|---|---|---|
| A | 194224 | 169290 | 0 | 0 | 0.00% | 0.00% |  |
| B | 194224 | 169271 | 0 | 0 | 0.00% | 0.00% |  |
| C | 194224 | 169294 | 0 | 0 | 0.00% | 0.00% |  |
| D | 194224 | 169130 | 0 | 0 | 0.00% | 0.00% |  |
Top three noisy pixels from each quadrant. If the there are fewer than three noisy pixels in the level2.evt file, extra rows are filled as -1
| Pixel properties | Quadrant properties | ||||||
|---|---|---|---|---|---|---|---|
| Quadrant | DetID | PixID | Counts | Sigma | Mean | Median | Sigma |
| A | 0 | 29 | 10162 | 11.55 | 2663 | 2485 | 664.8 |
| A | 7 | 110 | 8286 | 8.73 | 2663 | 2485 | 664.8 |
| A | 0 | 30 | 7745 | 7.91 | 2663 | 2485 | 664.8 |
| B | 2 | 9 | 8412 | 11.66 | 2596 | 2476 | 508.9 |
| B | 3 | 17 | 6594 | 8.09 | 2596 | 2476 | 508.9 |
| B | 5 | 128 | 6524 | 7.95 | 2596 | 2476 | 508.9 |
| C | 1 | 80 | 7498 | 7.36 | 2638 | 2448 | 685.8 |
| C | 1 | 81 | 7397 | 7.22 | 2638 | 2448 | 685.8 |
| C | 12 | 241 | 6968 | 6.59 | 2638 | 2448 | 685.8 |
| D | 3 | 14 | 6129 | 6.08 | 2409 | 2185 | 648.4 |
| D | 6 | 231 | 6033 | 5.93 | 2409 | 2185 | 648.4 |
| D | 7 | 3 | 5899 | 5.73 | 2409 | 2185 | 648.4 |
Histogram calculated using DETX and DETY for each event in the final _common_clean file
| Quadrant A | 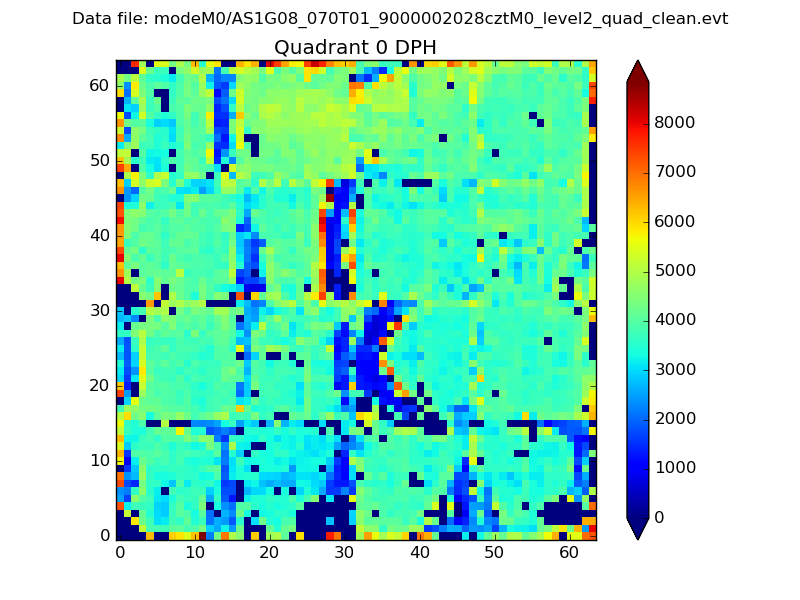 |
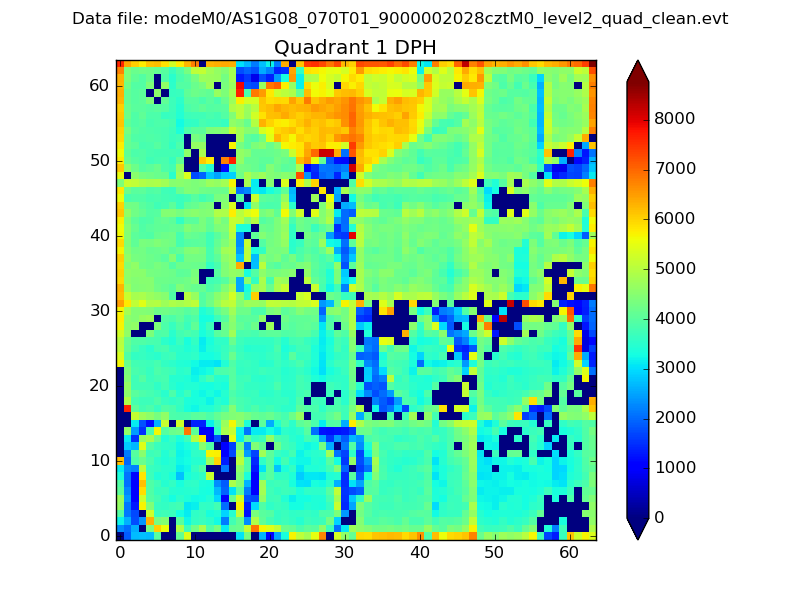 |
Quadrant B |
|---|---|---|---|
| Quadrant D | 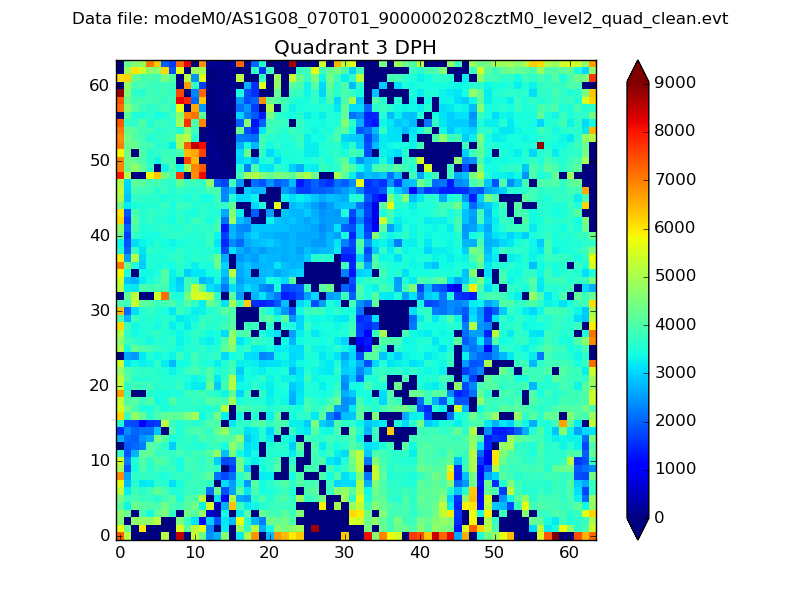 |
 |
Quadrant C |
| Plot type | Count rate plots | Images |
|---|---|---|
| Comparison with Poisson distribution Blue bars denote a histogram of data divided into 1 sec bins. Red curve is a Poisson curve with rate = median count rate of data. |
 |
 |
| Quadrant-wise count rates Data is divided into 100 sec bins |
 |
|
| Module-wise count rates for Quadrant A Data is divided into 100 sec bins |
 |
 |
| Module-wise count rates for Quadrant B Data is divided into 100 sec bins |
 |
 |
| Module-wise count rates for Quadrant C Data is divided into 100 sec bins |
 |
 |
| Module-wise count rates for Quadrant D Data is divided into 100 sec bins |
 |
 |
| Parameter | Plot |
|---|---|
| CZT HV Monitor |  |
| D_VDD | 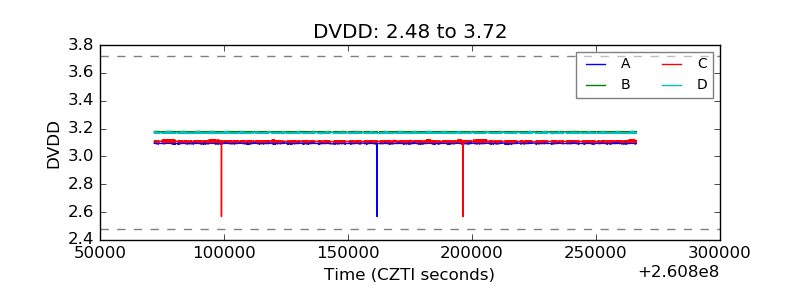 |
| Temperature 1 |  |
| Veto HV Monitor |  |
| Veto LLD | 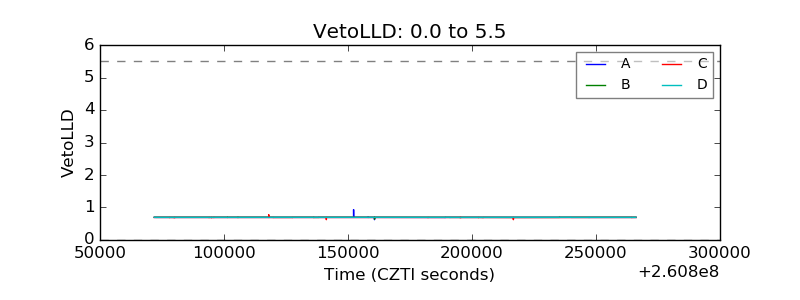 |
| Alpha Counter |  |
| _CPM_Rate |  |
| CZT Counter |  |
| +2.5 Volts monitor |  |
| +5 Volts monitor |  |
| _ROLL_ROT |  |
| _Roll_DEC |  |
| _Roll_RA |  |
| Veto Counter |  |