| Param | Original file | Final file |
|---|---|---|
| Filename | modeM0/AS1G08_070T01_9000002028_13665cztM0_level2.evt | modeM0/AS1G08_070T01_9000002028_13665cztM0_level2_quad_clean.evt |
| Size (bytes) | 299,793,600 | 56,232,000 |
| Size | 285.9 MB | 53.6 MB |
| Events in quadrant A | 1,738,446 | 378,346 |
| Events in quadrant B | 2,385,751 | 399,973 |
| Events in quadrant C | 1,855,713 | 356,550 |
| Events in quadrant D | 2,876,214 | 335,411 |
| Mode SS | |||
|---|---|---|---|
| Quadrant | BADHDUFLAG | Total packets | Discarded packets |
| A | 0 | 68 | 0 |
| B | 0 | 68 | 0 |
| C | 0 | 68 | 0 |
| D | 0 | 68 | 0 |
| Mode M9 | |||
|---|---|---|---|
| Quadrant | BADHDUFLAG | Total packets | Discarded packets |
| A | 0 | 11 | 0 |
| B | 0 | 11 | 0 |
| C | 0 | 11 | 0 |
| D | 0 | 11 | 0 |
| Mode M0 | |||
|---|---|---|---|
| Quadrant | BADHDUFLAG | Total packets | Discarded packets |
| A | 0 | 7010 | 2 |
| B | 0 | 9243 | 1 |
| C | 0 | 7386 | 1 |
| D | 0 | 10697 | 1 |
| Quadrant | Total seconds | Saturated seconds | Saturation percentage |
|---|---|---|---|
| A | 3268 | 82 | 2.509180% |
| B | 3268 | 164 | 5.018360% |
| C | 3268 | 48 | 1.468788% |
| D | 3268 | 284 | 8.690330% |
Noise dominated data is calculated using 1-second bins in cleaned event files. If a bin has >2000 counts, and if more than 50% of those come from <1% of pixels, then it is considered to be noise-dominated and hence unusable.
| Quadrant | # 1 sec bins | Bins with >0 counts | Bins with >2000 counts | High rate bins dominated by noise | Noise dominated (total time) | Noise dominated (detector-on time) | Marked lightcurve |
|---|---|---|---|---|---|---|---|
| A | 4429 | 3270 | 1 | 1 | 0.02% | 0.03% | 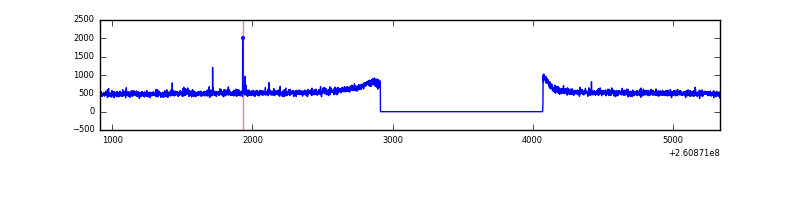 |
| B | 4429 | 3270 | 23 | 23 | 0.52% | 0.70% | 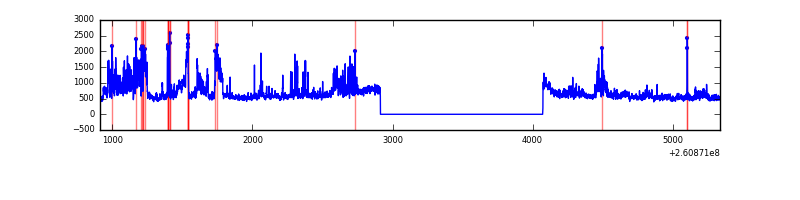 |
| C | 4429 | 3270 | 2 | 2 | 0.05% | 0.06% | 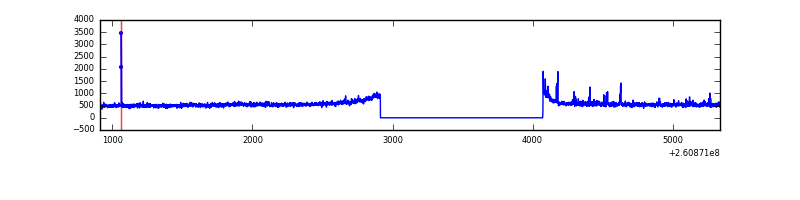 |
| D | 4429 | 3270 | 230 | 230 | 5.19% | 7.03% | 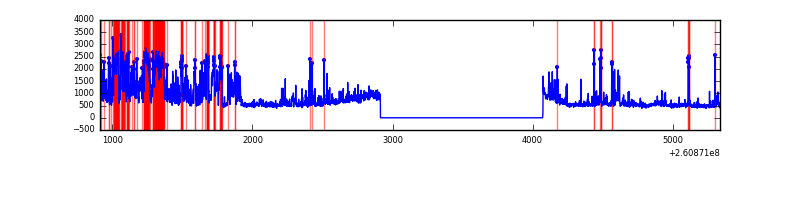 |
Top three noisy pixels from each quadrant. If the there are fewer than three noisy pixels in the level2.evt file, extra rows are filled as -1
| Pixel properties | Quadrant properties | ||||||
|---|---|---|---|---|---|---|---|
| Quadrant | DetID | PixID | Counts | Sigma | Mean | Median | Sigma |
| A | 1 | 162 | 6397 | 64.41 | 448 | 438 | 92.5 |
| A | 15 | 69 | 5011 | 49.43 | 448 | 438 | 92.5 |
| A | 0 | 226 | 3931 | 37.75 | 448 | 438 | 92.5 |
| B | 0 | 219 | 437879 | 5036.09 | 449 | 441 | 86.9 |
| B | 3 | 64 | 128454 | 1473.77 | 449 | 441 | 86.9 |
| B | 0 | 229 | 44000 | 501.48 | 449 | 441 | 86.9 |
| C | 3 | 233 | 172723 | 1707.74 | 427 | 431 | 100.9 |
| C | 14 | 234 | 10750 | 102.28 | 427 | 431 | 100.9 |
| C | 8 | 128 | 3780 | 33.2 | 427 | 431 | 100.9 |
| D | 12 | 110 | 552304 | 5340.22 | 422 | 410 | 103.3 |
| D | 5 | 222 | 371762 | 3593.26 | 422 | 410 | 103.3 |
| D | 1 | 52 | 200889 | 1939.87 | 422 | 410 | 103.3 |
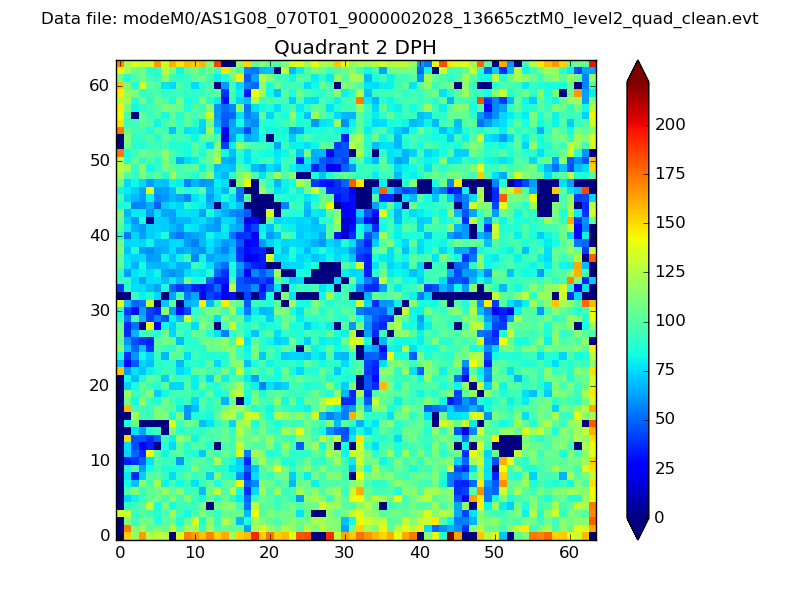
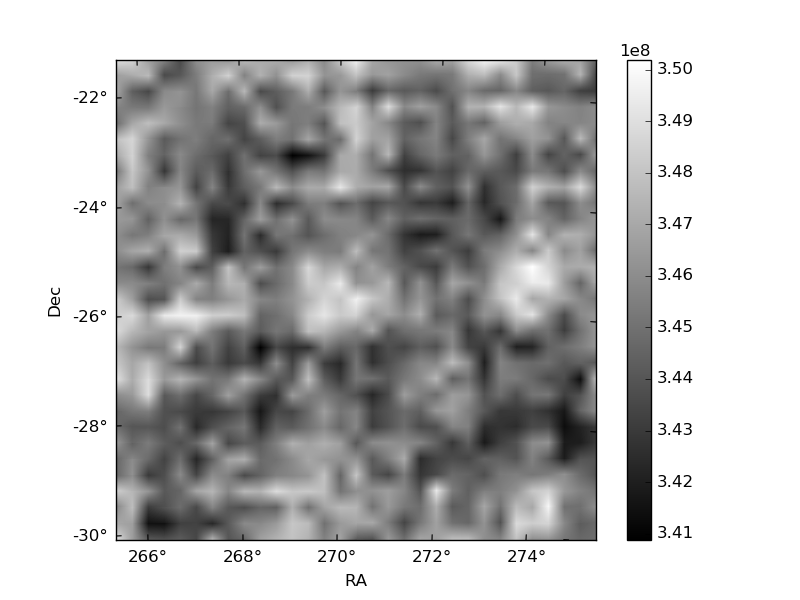
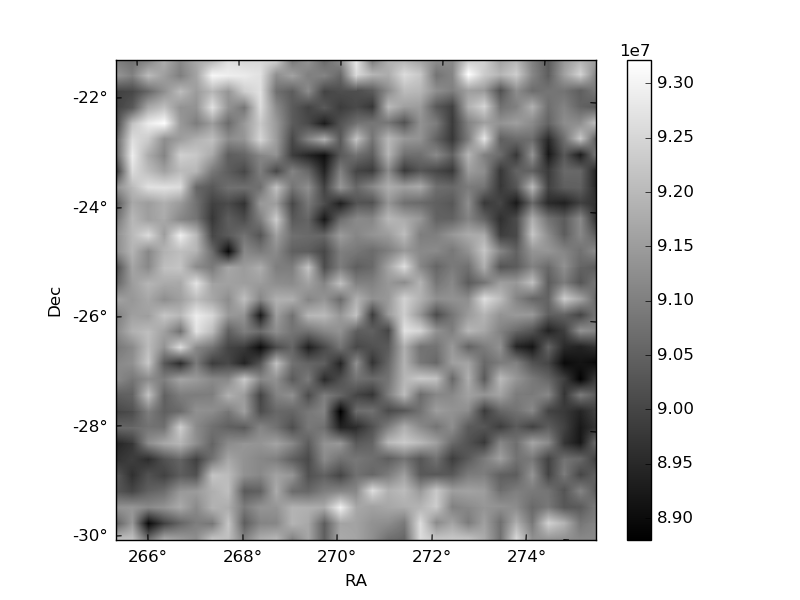
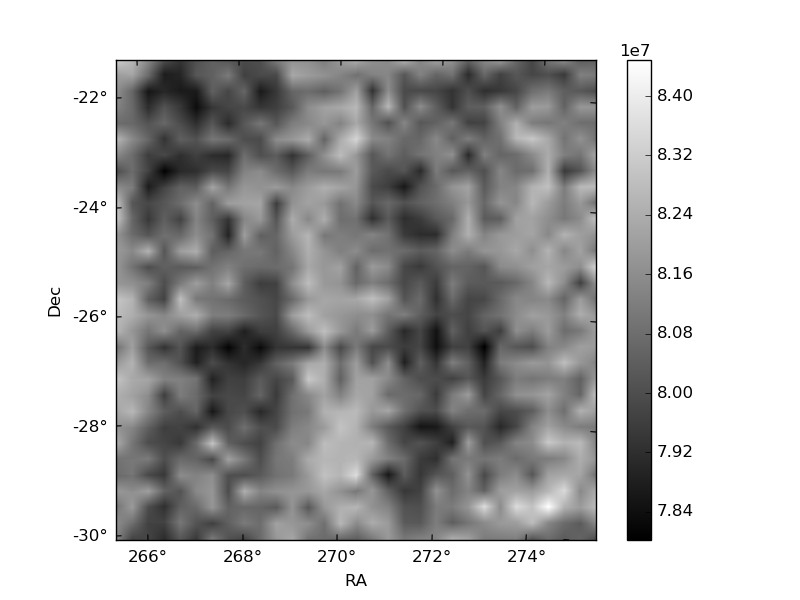
Histogram calculated using DETX and DETY for each event in the final _common_clean file
| Quadrant A | 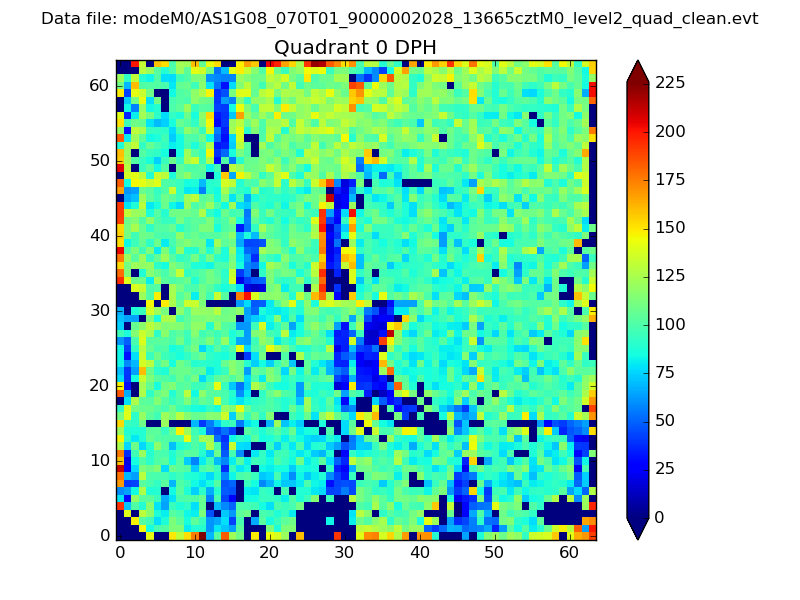 |
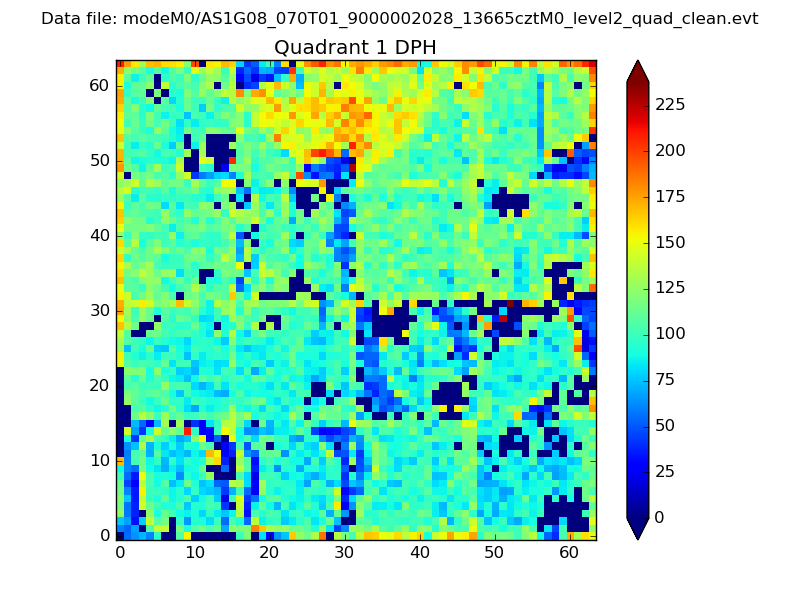 |
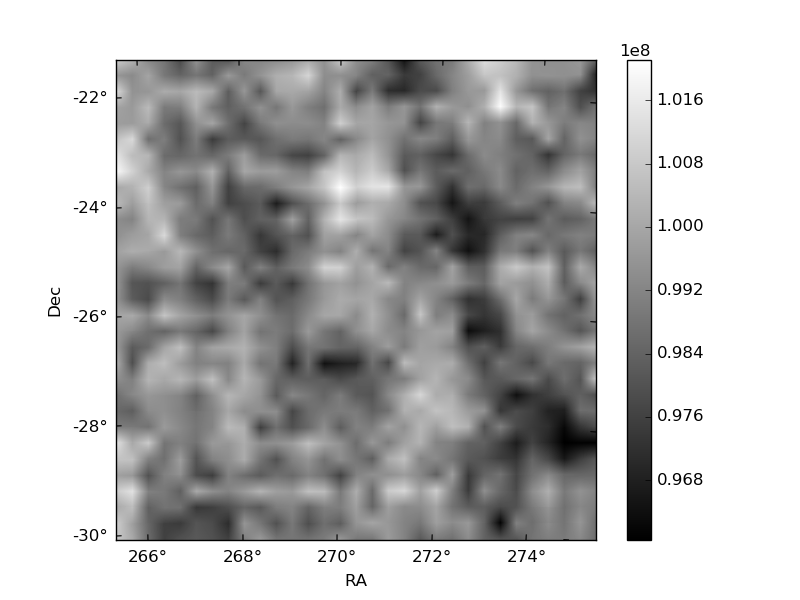
Quadrant B |
|---|---|---|---|
| Quadrant D | 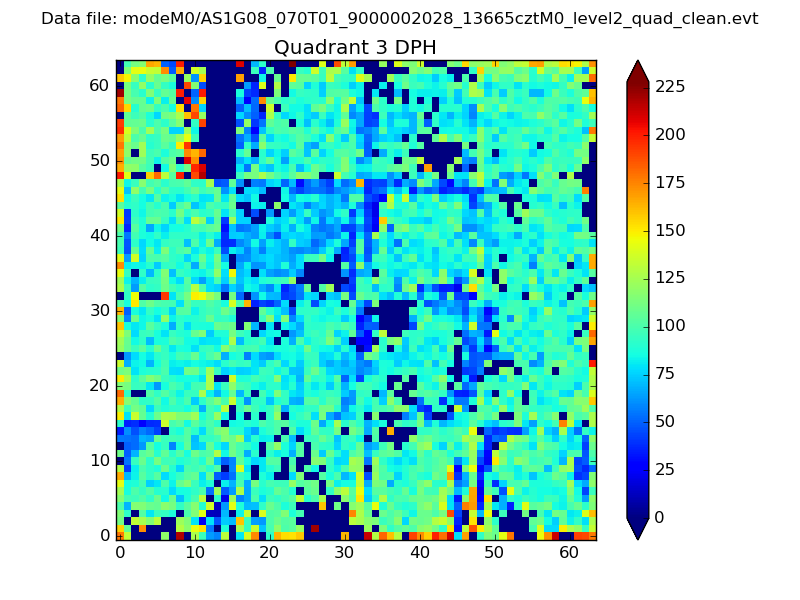 |
 |
Quadrant C |
| Plot type | Count rate plots | Images |
|---|---|---|
| Comparison with Poisson distribution Blue bars denote a histogram of data divided into 1 sec bins. Red curve is a Poisson curve with rate = median count rate of data. |
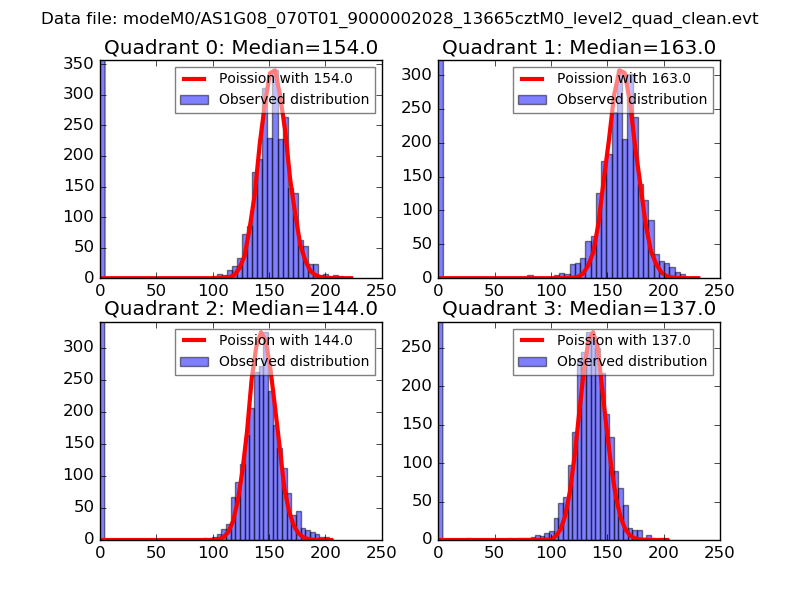 |
 |
| Quadrant-wise count rates Data is divided into 100 sec bins |
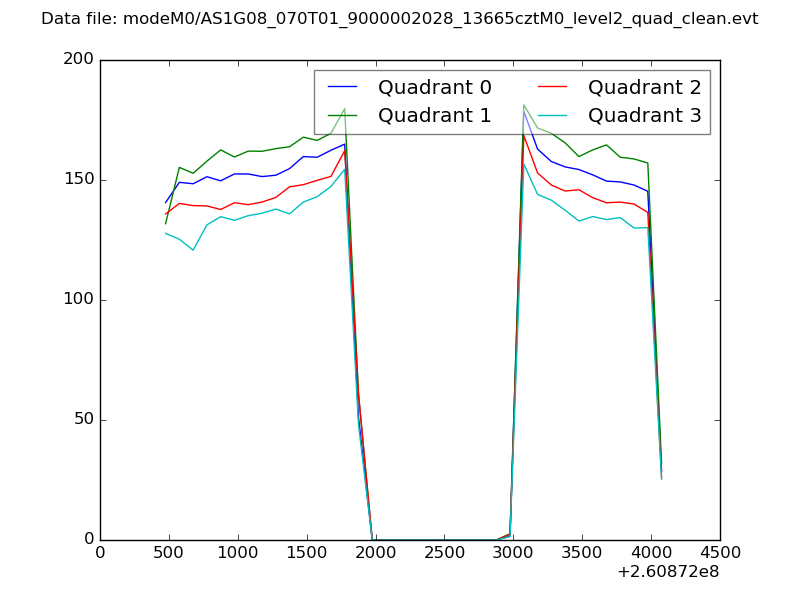 |
|
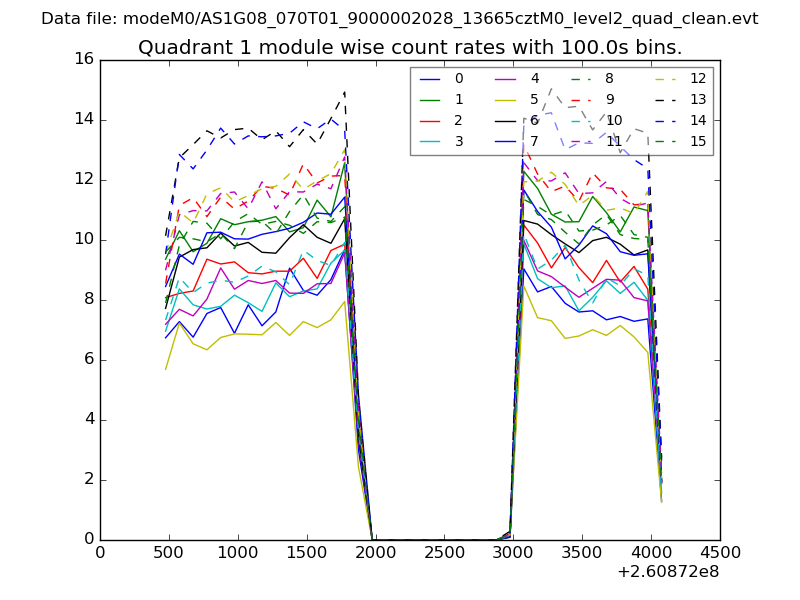
| Module-wise count rates for Quadrant A Data is divided into 100 sec bins |
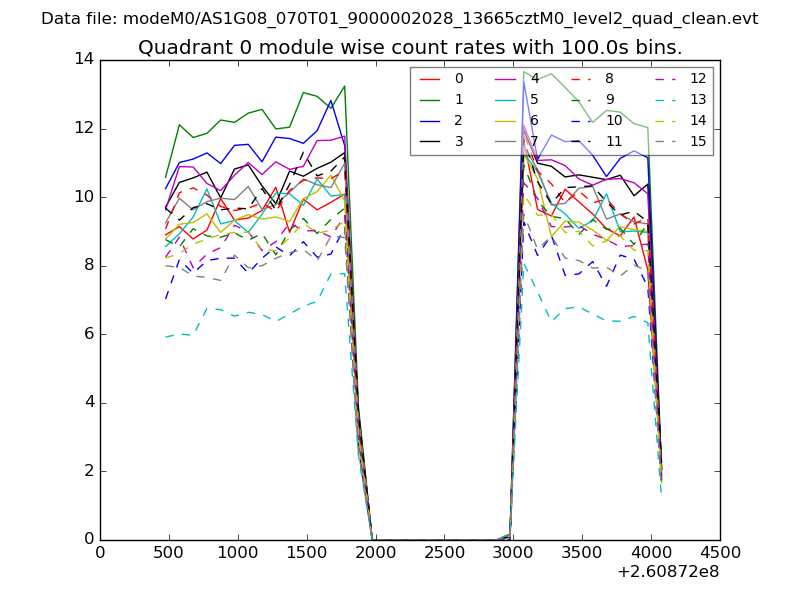 |
 |
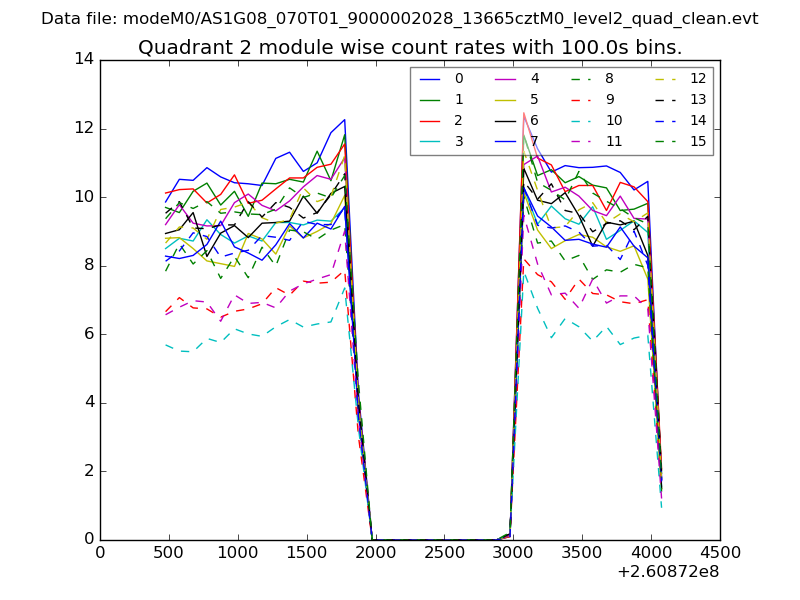
| Module-wise count rates for Quadrant B Data is divided into 100 sec bins |
 |
 |
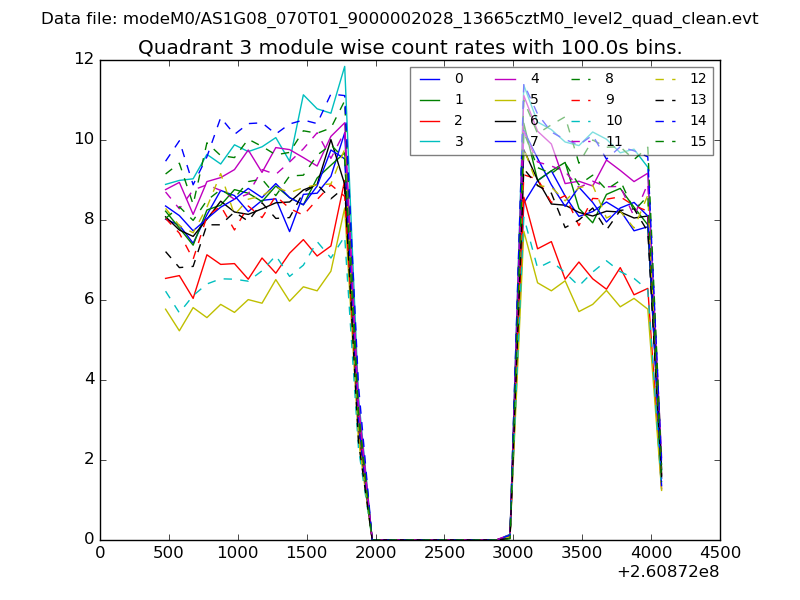
| Module-wise count rates for Quadrant C Data is divided into 100 sec bins |
 |
 |
| Module-wise count rates for Quadrant D Data is divided into 100 sec bins |
 |
 |
| Parameter | Plot |
|---|---|
| CZT HV Monitor | 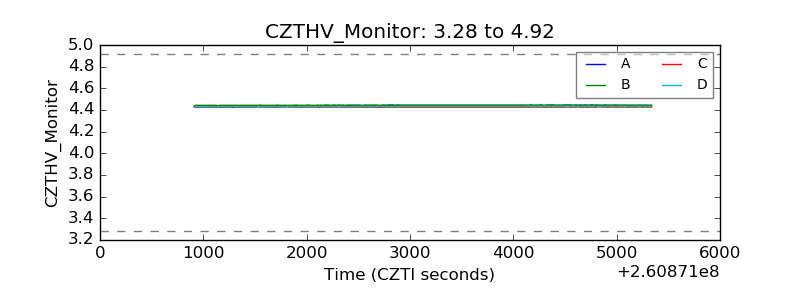 |
| D_VDD | 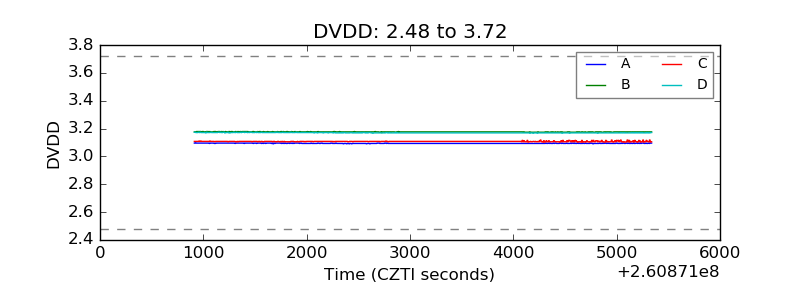 |
| Temperature 1 | 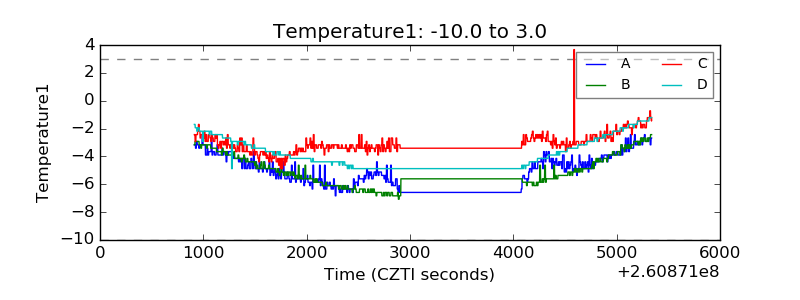 |
| Veto HV Monitor | 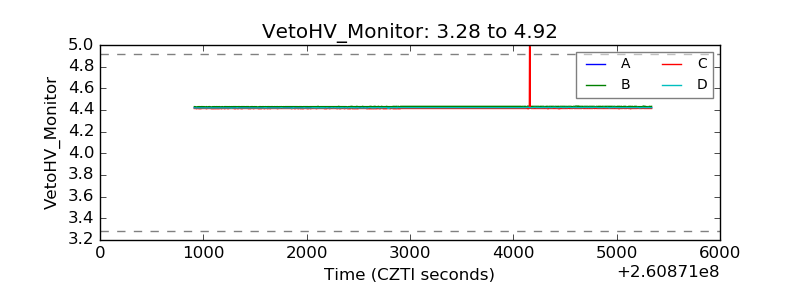 |
| Veto LLD |  |
| Alpha Counter | 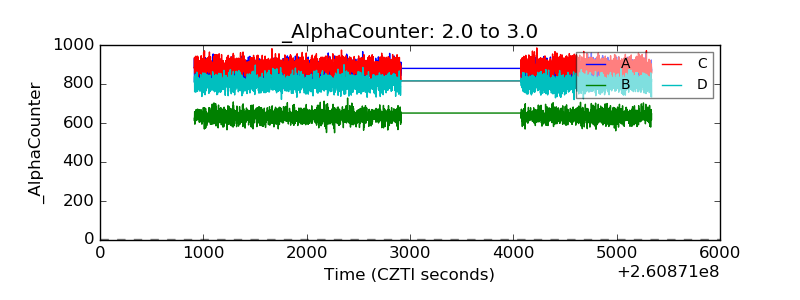 |
| _CPM_Rate | 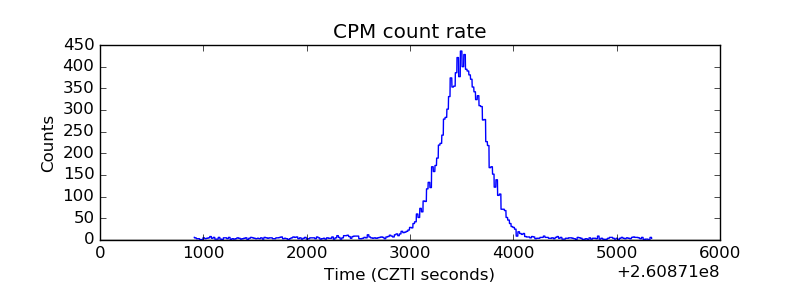 |
| CZT Counter | 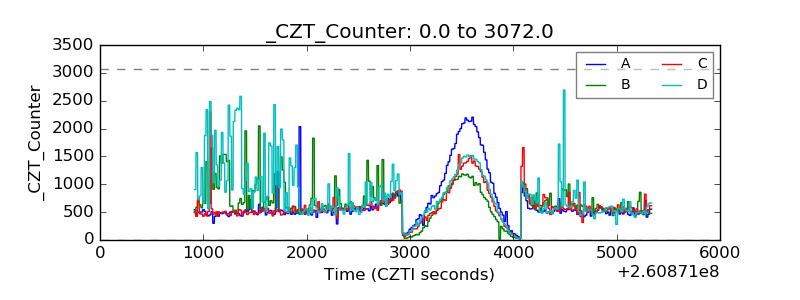 |
| +2.5 Volts monitor |  |
| +5 Volts monitor |  |
| _ROLL_ROT | 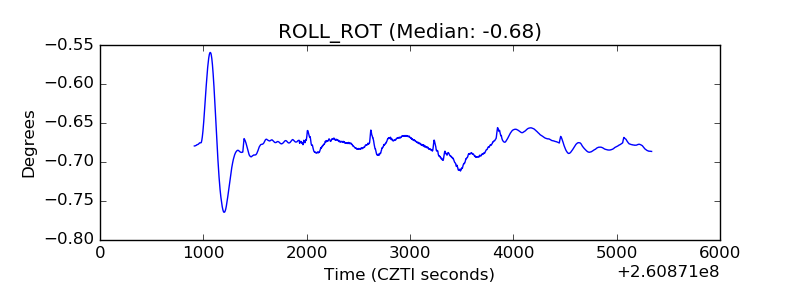 |
| _Roll_DEC | 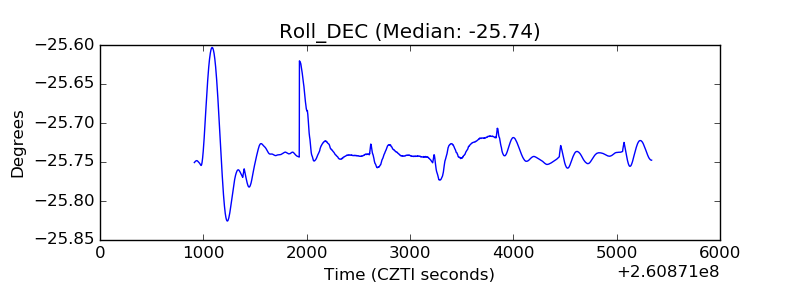 |
| _Roll_RA | 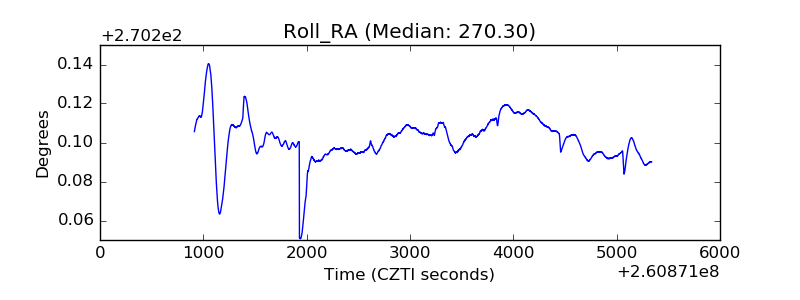 |
| Veto Counter | 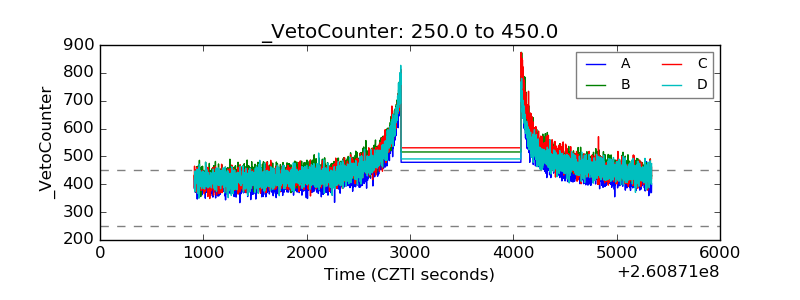 |