| Param | Original file | Final file |
|---|---|---|
| Filename | modeM0/AS1G08_070T01_9000002028_13666cztM0_level2.evt | modeM0/AS1G08_070T01_9000002028_13666cztM0_level2_quad_clean.evt |
| Size (bytes) | 531,984,960 | 80,415,360 |
| Size | 507.3 MB | 76.7 MB |
| Events in quadrant A | 3,322,233 | 505,423 |
| Events in quadrant B | 4,059,185 | 534,064 |
| Events in quadrant C | 3,525,993 | 480,073 |
| Events in quadrant D | 4,751,954 | 450,885 |
| Mode SS | |||
|---|---|---|---|
| Quadrant | BADHDUFLAG | Total packets | Discarded packets |
| A | 0 | 134 | 0 |
| B | 0 | 134 | 0 |
| C | 0 | 134 | 0 |
| D | 0 | 134 | 0 |
| Mode M9 | |||
|---|---|---|---|
| Quadrant | BADHDUFLAG | Total packets | Discarded packets |
| A | 0 | 9 | 0 |
| B | 0 | 9 | 0 |
| C | 0 | 9 | 0 |
| D | 0 | 9 | 0 |
| Mode M0 | |||
|---|---|---|---|
| Quadrant | BADHDUFLAG | Total packets | Discarded packets |
| A | 0 | 13830 | 2 |
| B | 0 | 16105 | 1 |
| C | 0 | 14151 | 1 |
| D | 0 | 18463 | 1 |
| Quadrant | Total seconds | Saturated seconds | Saturation percentage |
|---|---|---|---|
| A | 6668 | 96 | 1.439712% |
| B | 6668 | 187 | 2.804439% |
| C | 6668 | 71 | 1.064787% |
| D | 6668 | 182 | 2.729454% |
Noise dominated data is calculated using 1-second bins in cleaned event files. If a bin has >2000 counts, and if more than 50% of those come from <1% of pixels, then it is considered to be noise-dominated and hence unusable.
| Quadrant | # 1 sec bins | Bins with >0 counts | Bins with >2000 counts | High rate bins dominated by noise | Noise dominated (total time) | Noise dominated (detector-on time) | Marked lightcurve |
|---|---|---|---|---|---|---|---|
| A | 7514 | 6670 | 4 | 4 | 0.05% | 0.06% |  |
| B | 7514 | 6670 | 52 | 52 | 0.69% | 0.78% |  |
| C | 7514 | 6670 | 0 | 0 | 0.00% | 0.00% |  |
| D | 7514 | 6670 | 95 | 95 | 1.26% | 1.42% | 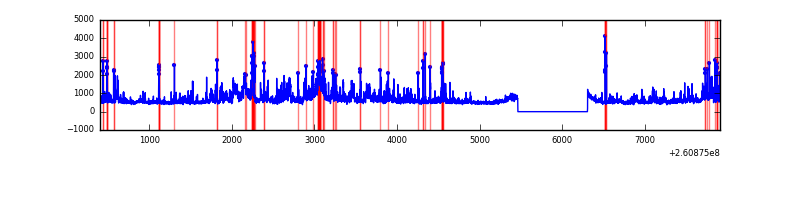 |
Top three noisy pixels from each quadrant. If the there are fewer than three noisy pixels in the level2.evt file, extra rows are filled as -1
| Pixel properties | Quadrant properties | ||||||
|---|---|---|---|---|---|---|---|
| Quadrant | DetID | PixID | Counts | Sigma | Mean | Median | Sigma |
| A | 1 | 162 | 24047 | 135.51 | 842 | 824 | 171.4 |
| A | 15 | 69 | 19932 | 111.5 | 842 | 824 | 171.4 |
| A | 9 | 143 | 12599 | 68.71 | 842 | 824 | 171.4 |
| B | 0 | 219 | 435162 | 2749.08 | 841 | 826 | 158.0 |
| B | 3 | 64 | 215982 | 1361.81 | 841 | 826 | 158.0 |
| B | 0 | 229 | 33571 | 207.26 | 841 | 826 | 158.0 |
| C | 3 | 233 | 357589 | 1930.16 | 804 | 811 | 184.8 |
| C | 8 | 128 | 9448 | 46.73 | 804 | 811 | 184.8 |
| C | 14 | 234 | 8357 | 40.82 | 804 | 811 | 184.8 |
| D | 1 | 52 | 561361 | 2908.87 | 801 | 778 | 192.7 |
| D | 5 | 222 | 441773 | 2288.33 | 801 | 778 | 192.7 |
| D | 8 | 195 | 414562 | 2147.13 | 801 | 778 | 192.7 |
Histogram calculated using DETX and DETY for each event in the final _common_clean file
| Quadrant A |  |
 |
Quadrant B |
|---|---|---|---|
| Quadrant D |  |
 |
Quadrant C |
| Plot type | Count rate plots | Images |
|---|---|---|
| Comparison with Poisson distribution Blue bars denote a histogram of data divided into 1 sec bins. Red curve is a Poisson curve with rate = median count rate of data. |
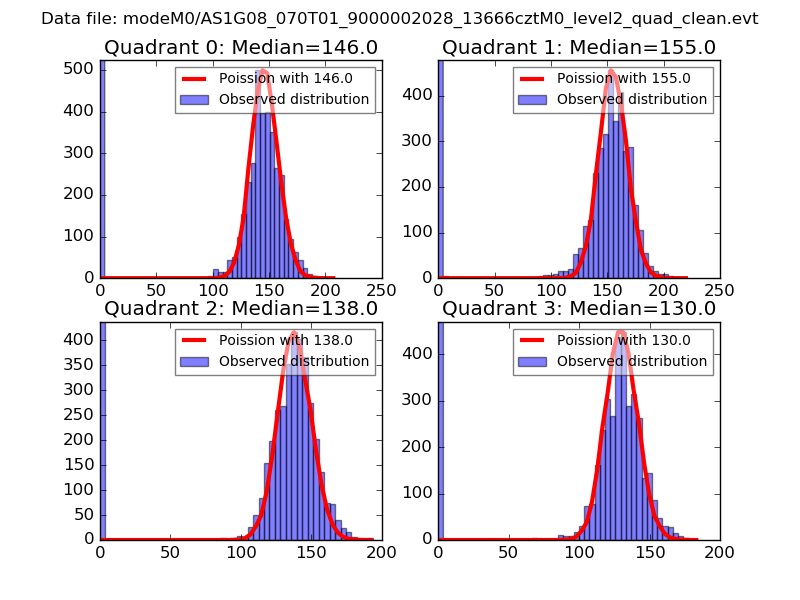 |
 |
| Quadrant-wise count rates Data is divided into 100 sec bins |
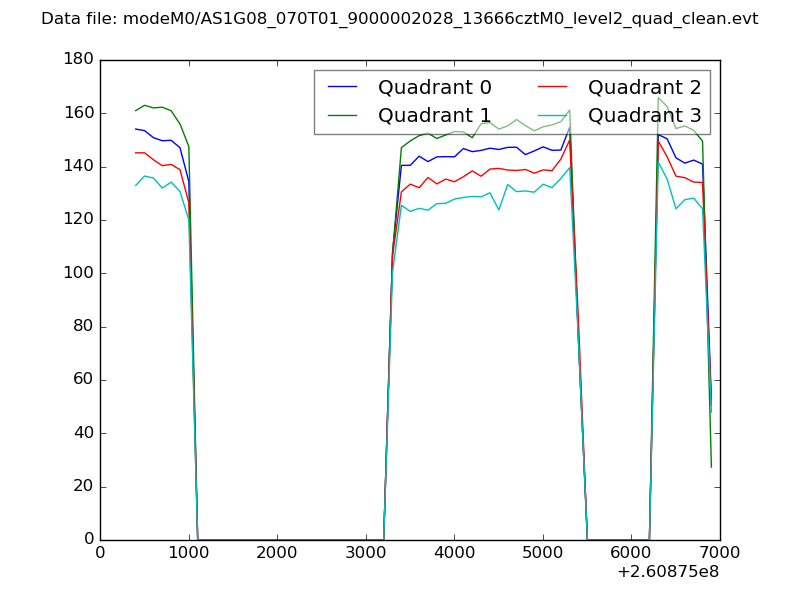 |
|
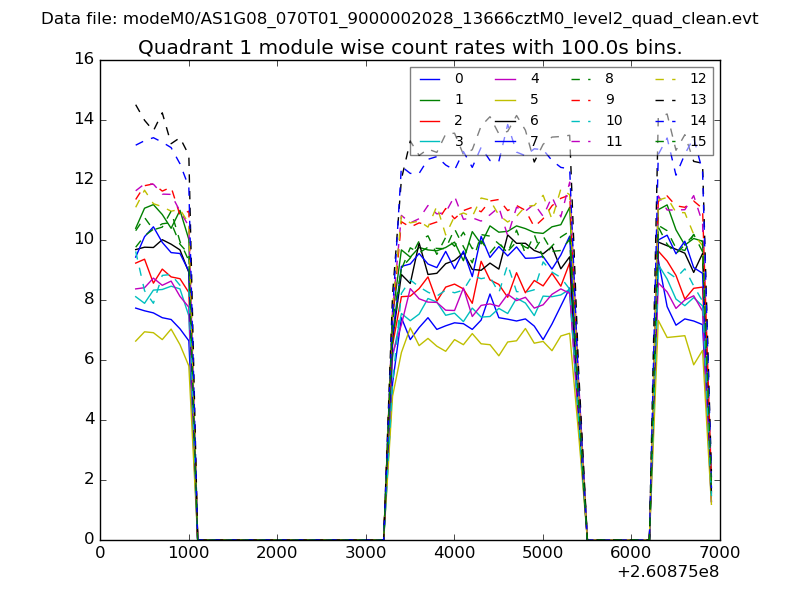
| Module-wise count rates for Quadrant A Data is divided into 100 sec bins |
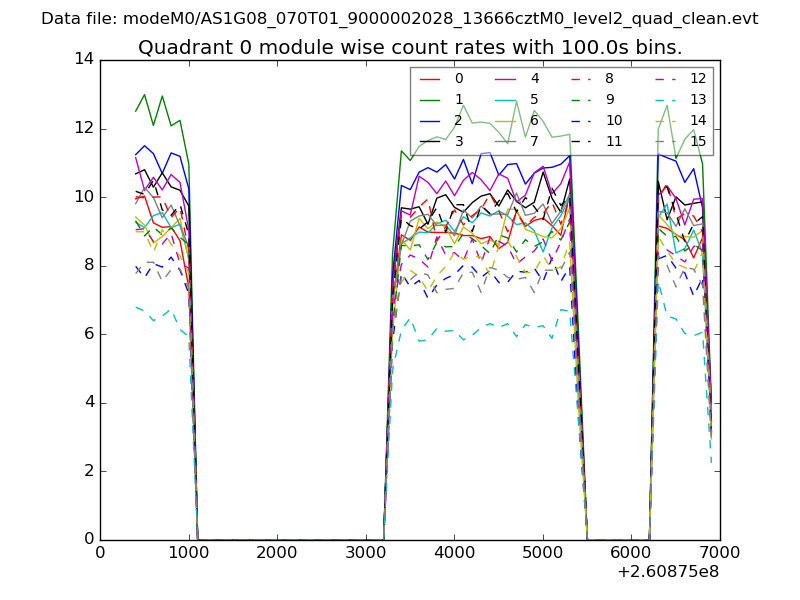 |
 |
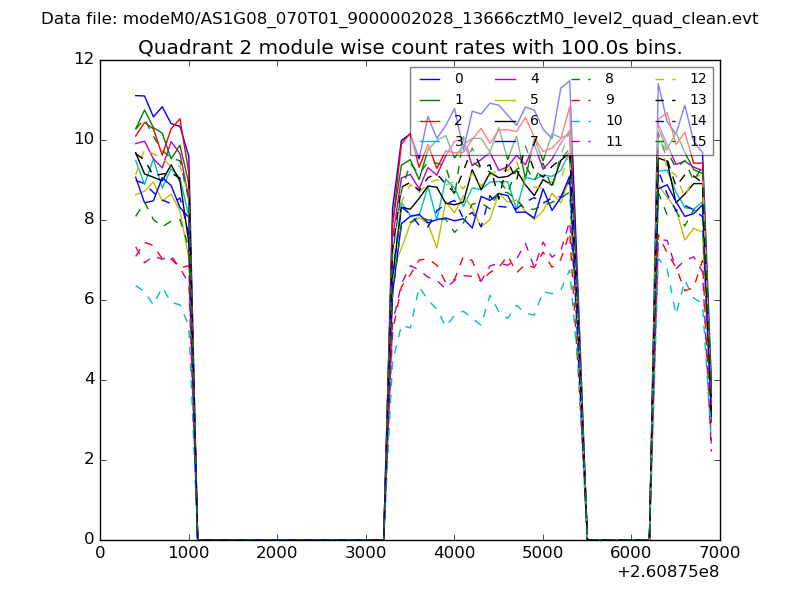
| Module-wise count rates for Quadrant B Data is divided into 100 sec bins |
 |
 |
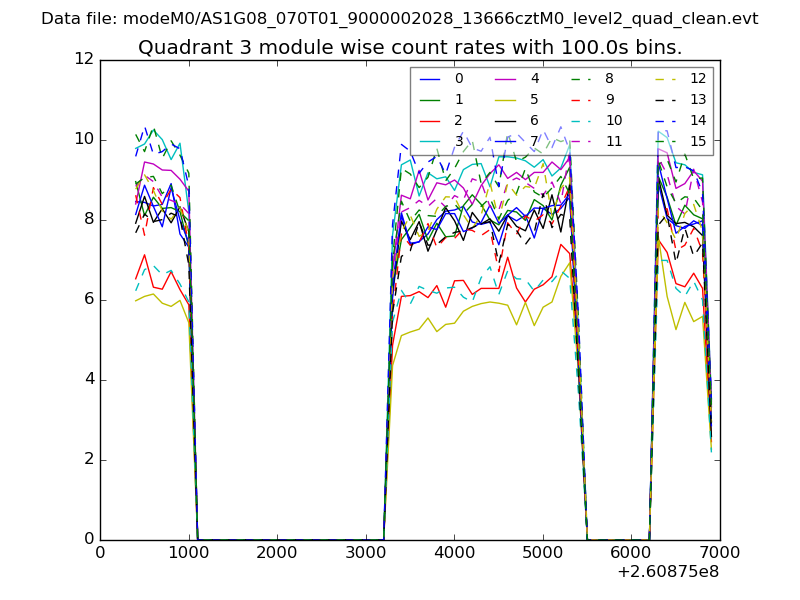
| Module-wise count rates for Quadrant C Data is divided into 100 sec bins |
 |
 |
| Module-wise count rates for Quadrant D Data is divided into 100 sec bins |
 |
 |
| Parameter | Plot |
|---|---|
| CZT HV Monitor | 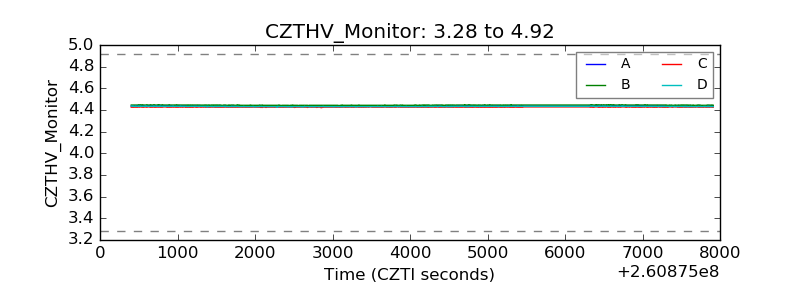 |
| D_VDD |  |
| Temperature 1 |  |
| Veto HV Monitor |  |
| Veto LLD |  |
| Alpha Counter | 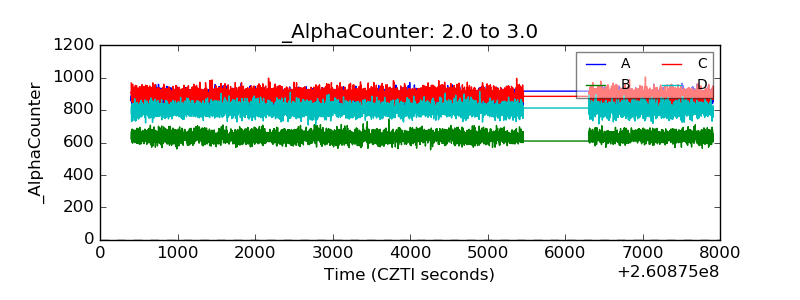 |
| _CPM_Rate | 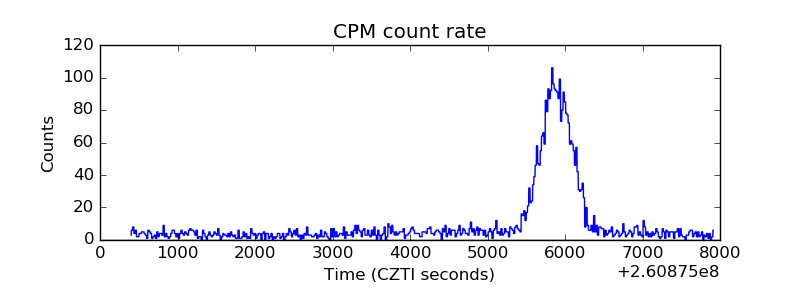 |
| CZT Counter |  |
| +2.5 Volts monitor |  |
| +5 Volts monitor |  |
| _ROLL_ROT | 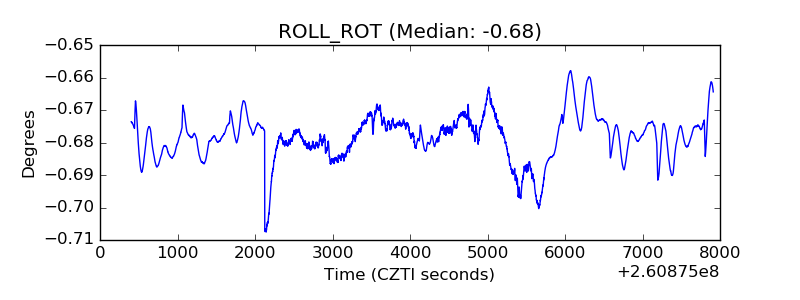 |
| _Roll_DEC |  |
| _Roll_RA |  |
| Veto Counter | 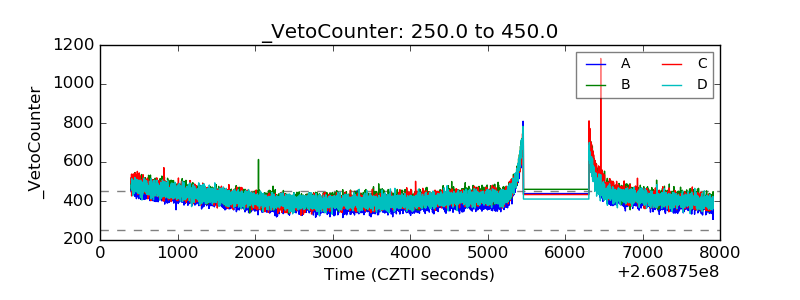 |