| Param | Original file | Final file |
|---|---|---|
| Filename | modeM0/AS1G08_070T01_9000002028_13667cztM0_level2.evt | modeM0/AS1G08_070T01_9000002028_13667cztM0_level2_quad_clean.evt |
| Size (bytes) | 584,426,880 | 81,915,840 |
| Size | 557.4 MB | 78.1 MB |
| Events in quadrant A | 3,533,734 | 506,746 |
| Events in quadrant B | 4,242,397 | 536,640 |
| Events in quadrant C | 3,744,828 | 485,211 |
| Events in quadrant D | 5,688,114 | 447,884 |
| Mode SS | |||
|---|---|---|---|
| Quadrant | BADHDUFLAG | Total packets | Discarded packets |
| A | 0 | 146 | 0 |
| B | 0 | 146 | 0 |
| C | 0 | 146 | 0 |
| D | 0 | 146 | 0 |
| Mode M9 | |||
|---|---|---|---|
| Quadrant | BADHDUFLAG | Total packets | Discarded packets |
| A | 0 | 4 | 0 |
| B | 0 | 4 | 0 |
| C | 0 | 4 | 0 |
| D | 0 | 4 | 0 |
| Mode M0 | |||
|---|---|---|---|
| Quadrant | BADHDUFLAG | Total packets | Discarded packets |
| A | 0 | 15068 | 2 |
| B | 0 | 17011 | 1 |
| C | 0 | 15211 | 1 |
| D | 0 | 21852 | 1 |
| Quadrant | Total seconds | Saturated seconds | Saturation percentage |
|---|---|---|---|
| A | 7239 | 132 | 1.823456% |
| B | 7239 | 258 | 3.564028% |
| C | 7239 | 81 | 1.118939% |
| D | 7239 | 333 | 4.600083% |
Noise dominated data is calculated using 1-second bins in cleaned event files. If a bin has >2000 counts, and if more than 50% of those come from <1% of pixels, then it is considered to be noise-dominated and hence unusable.
| Quadrant | # 1 sec bins | Bins with >0 counts | Bins with >2000 counts | High rate bins dominated by noise | Noise dominated (total time) | Noise dominated (detector-on time) | Marked lightcurve |
|---|---|---|---|---|---|---|---|
| A | 7640 | 7241 | 6 | 6 | 0.08% | 0.08% | 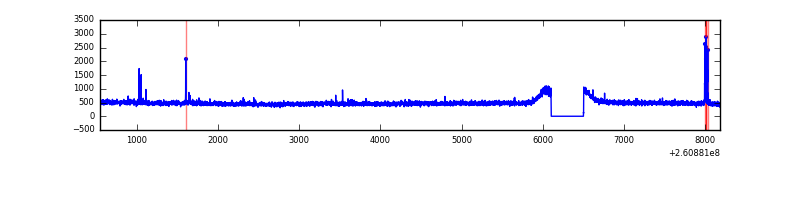 |
| B | 7640 | 7241 | 84 | 84 | 1.10% | 1.16% | 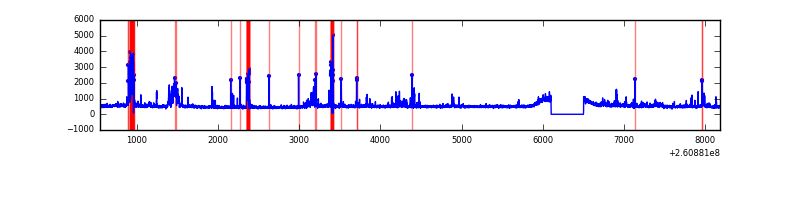 |
| C | 7640 | 7241 | 0 | 0 | 0.00% | 0.00% | 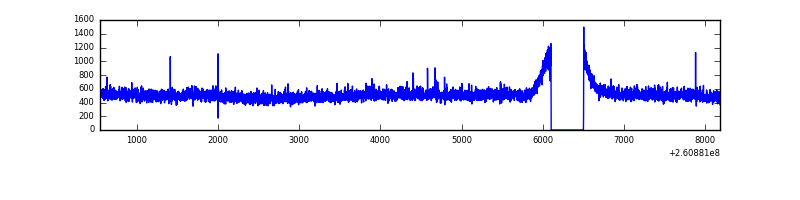 |
| D | 7640 | 7241 | 222 | 222 | 2.91% | 3.07% | 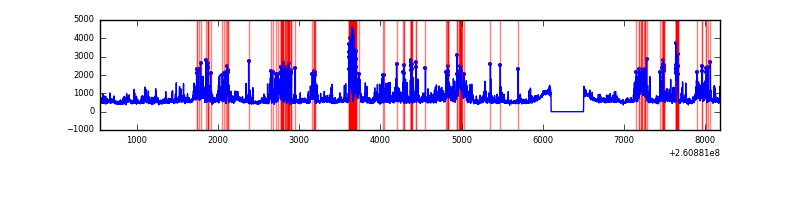 |
Top three noisy pixels from each quadrant. If the there are fewer than three noisy pixels in the level2.evt file, extra rows are filled as -1
| Pixel properties | Quadrant properties | ||||||
|---|---|---|---|---|---|---|---|
| Quadrant | DetID | PixID | Counts | Sigma | Mean | Median | Sigma |
| A | 15 | 69 | 38870 | 203.98 | 906 | 886 | 186.2 |
| A | 1 | 162 | 9819 | 47.97 | 906 | 886 | 186.2 |
| A | 0 | 226 | 8301 | 39.82 | 906 | 886 | 186.2 |
| B | 3 | 64 | 317339 | 1824.23 | 906 | 886 | 173.5 |
| B | 0 | 219 | 290515 | 1669.6 | 906 | 886 | 173.5 |
| B | 0 | 214 | 38802 | 218.57 | 906 | 886 | 173.5 |
| C | 3 | 233 | 353124 | 1742.67 | 870 | 874 | 202.1 |
| C | 13 | 61 | 6153 | 26.12 | 870 | 874 | 202.1 |
| C | 14 | 234 | 2380 | 7.45 | 870 | 874 | 202.1 |
| D | 1 | 52 | 786690 | 3783.64 | 859 | 835 | 207.7 |
| D | 5 | 222 | 556093 | 2673.39 | 859 | 835 | 207.7 |
| D | 8 | 195 | 476096 | 2288.23 | 859 | 835 | 207.7 |
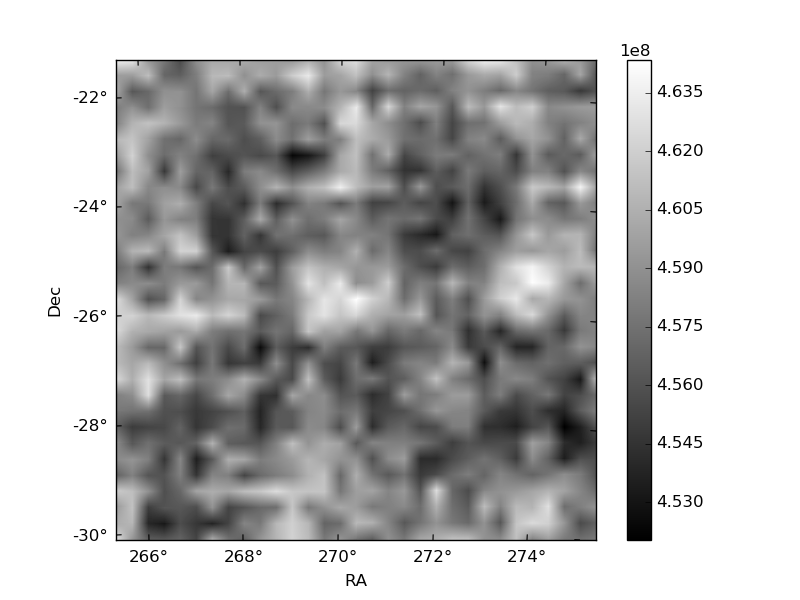
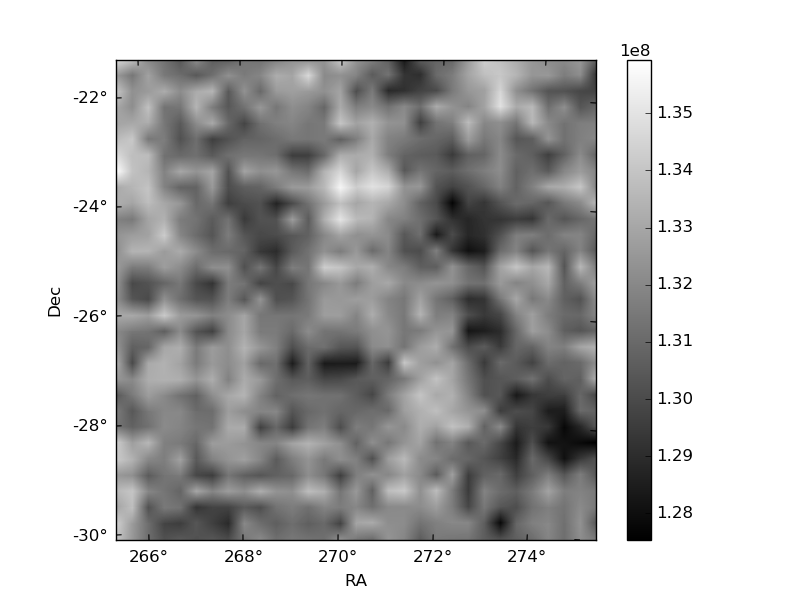
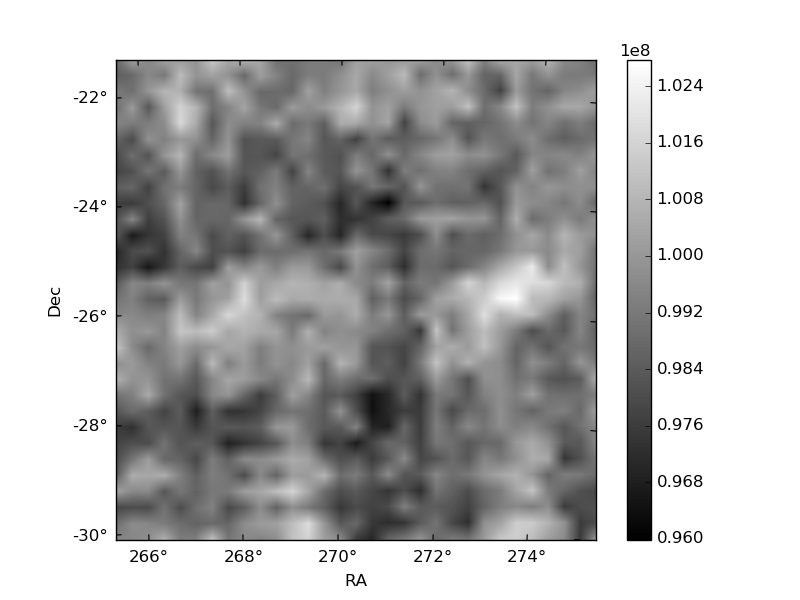
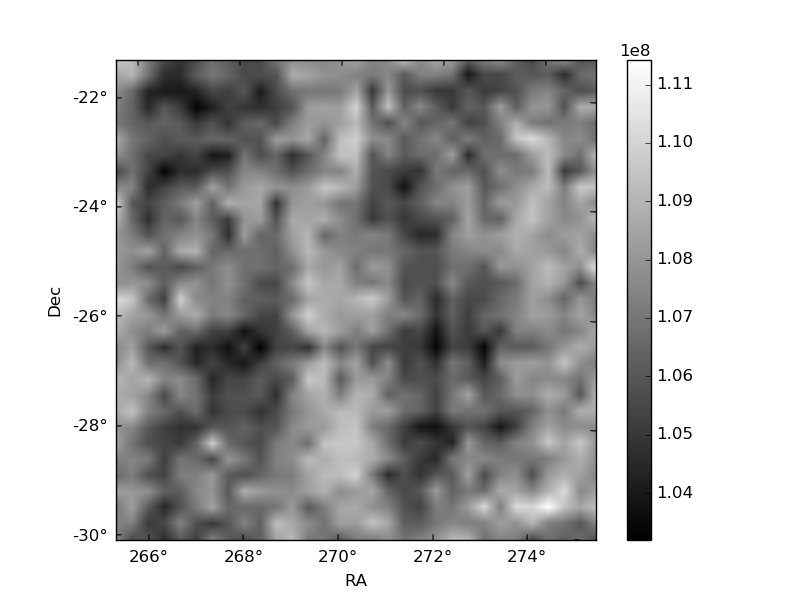
Histogram calculated using DETX and DETY for each event in the final _common_clean file
| Quadrant A | 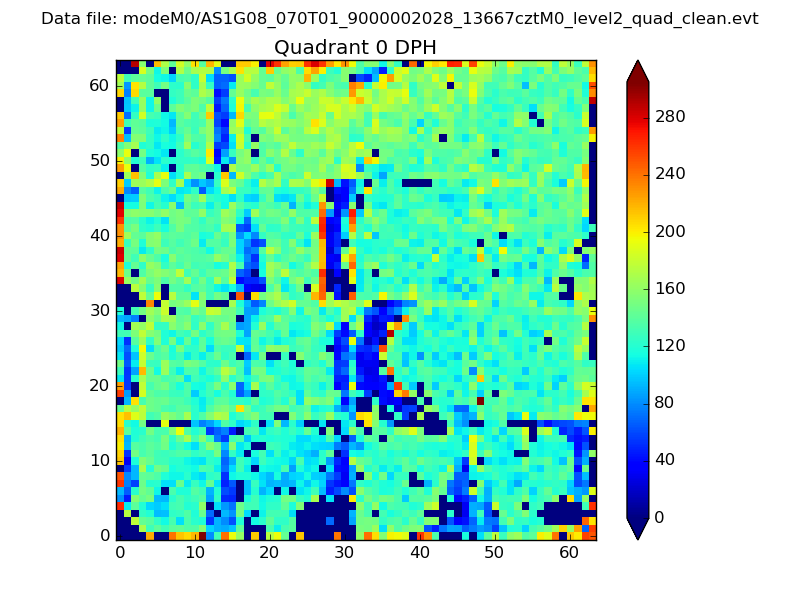 |
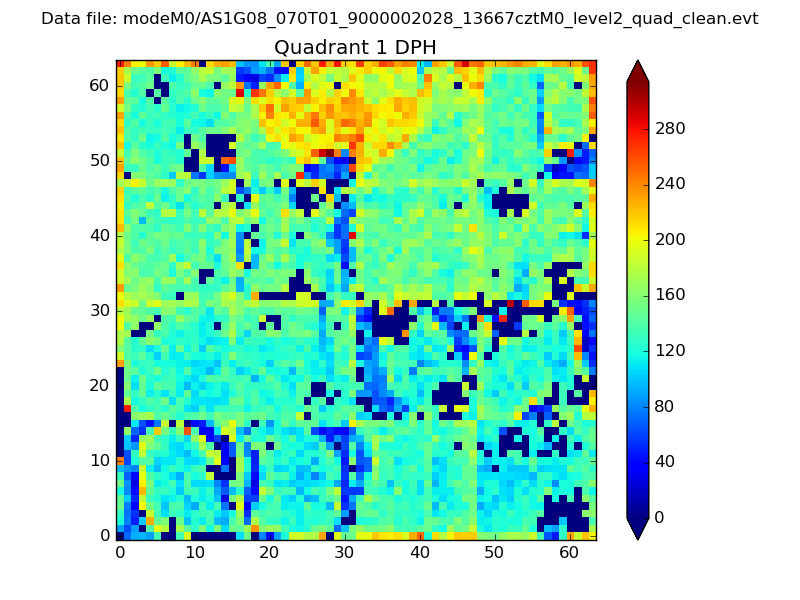 |
Quadrant B |
|---|---|---|---|
| Quadrant D | 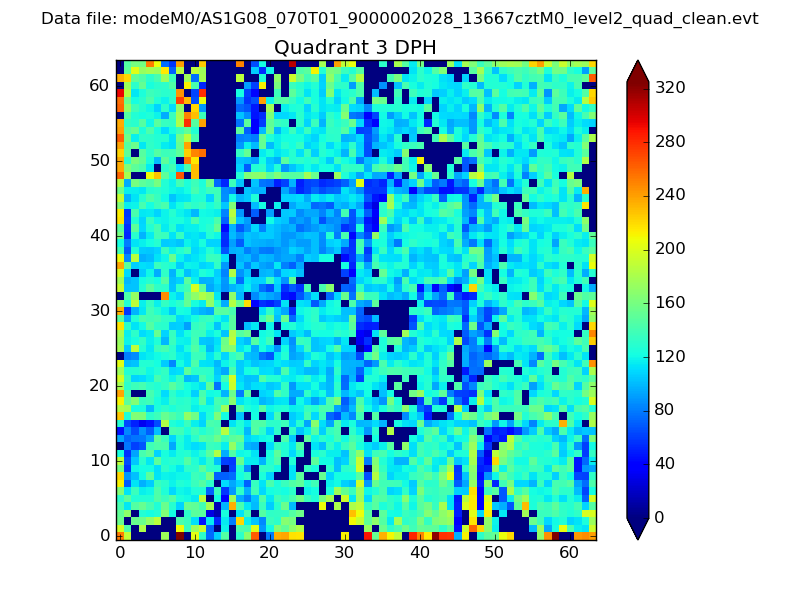 |
 |
Quadrant C |
| Plot type | Count rate plots | Images |
|---|---|---|
| Comparison with Poisson distribution Blue bars denote a histogram of data divided into 1 sec bins. Red curve is a Poisson curve with rate = median count rate of data. |
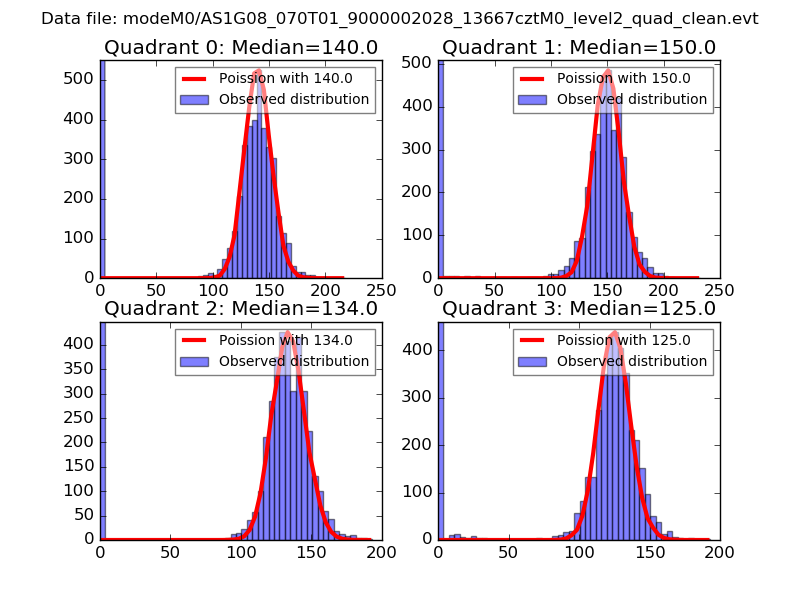 |
 |
| Quadrant-wise count rates Data is divided into 100 sec bins |
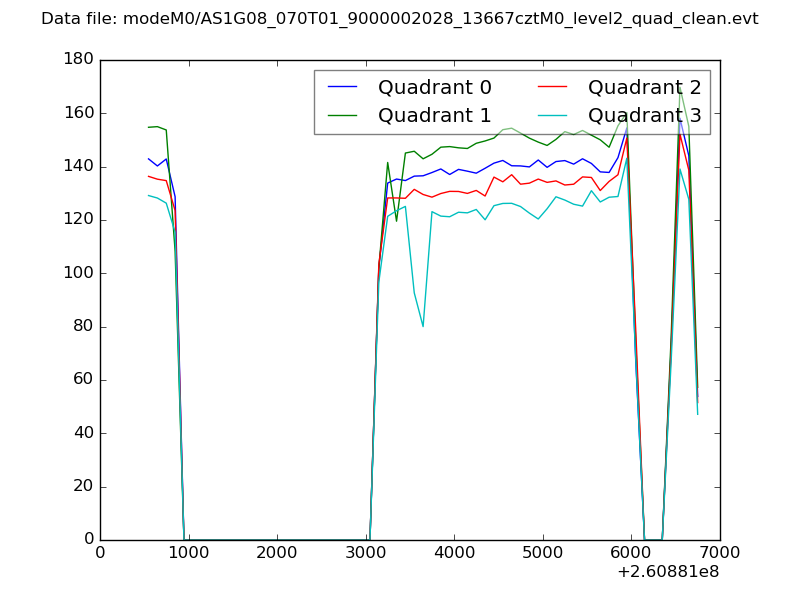 |
|
| Module-wise count rates for Quadrant A Data is divided into 100 sec bins |
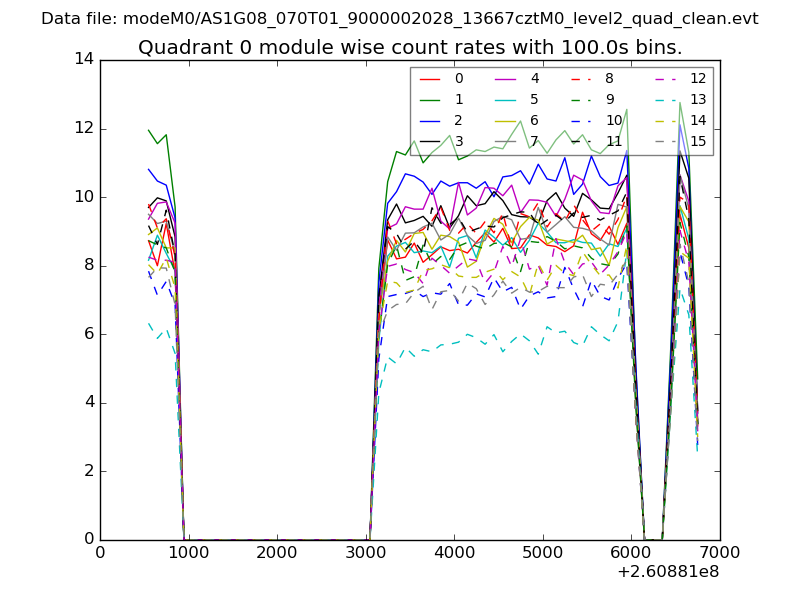 |
 |
| Module-wise count rates for Quadrant B Data is divided into 100 sec bins |
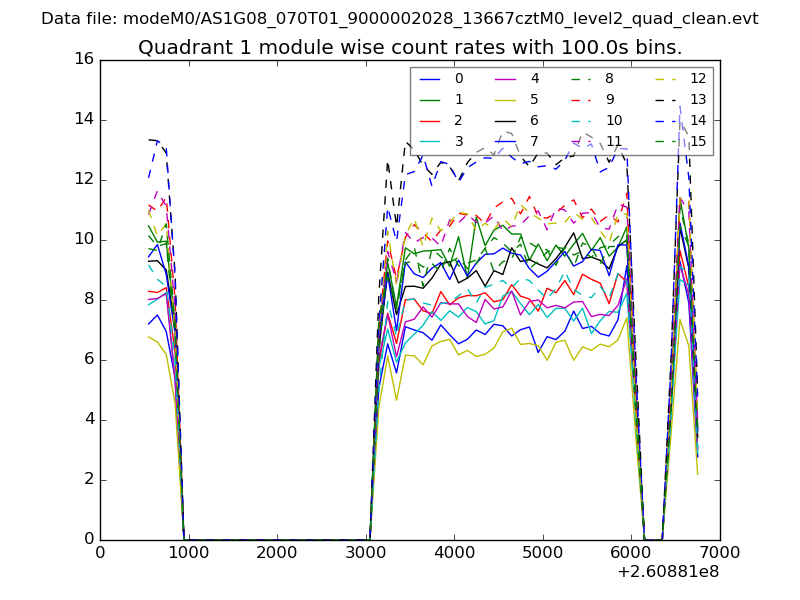 |
 |
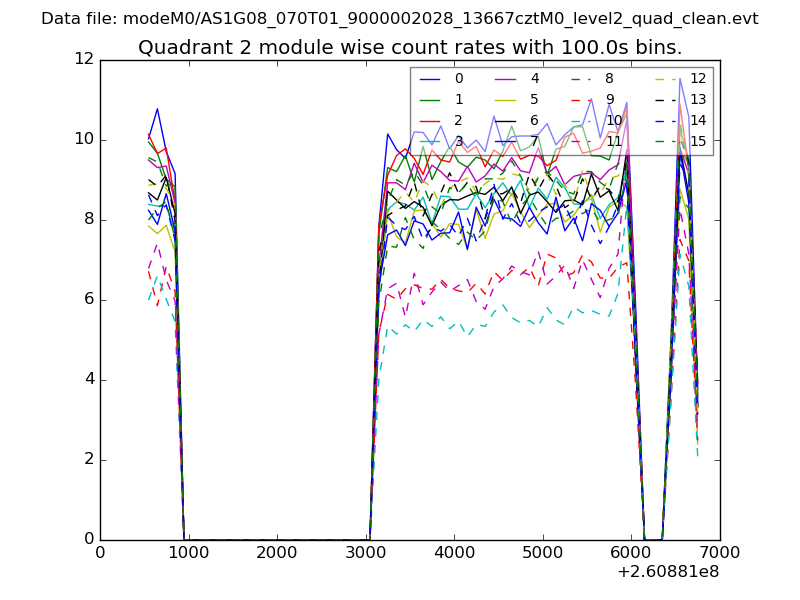
| Module-wise count rates for Quadrant C Data is divided into 100 sec bins |
 |
 |
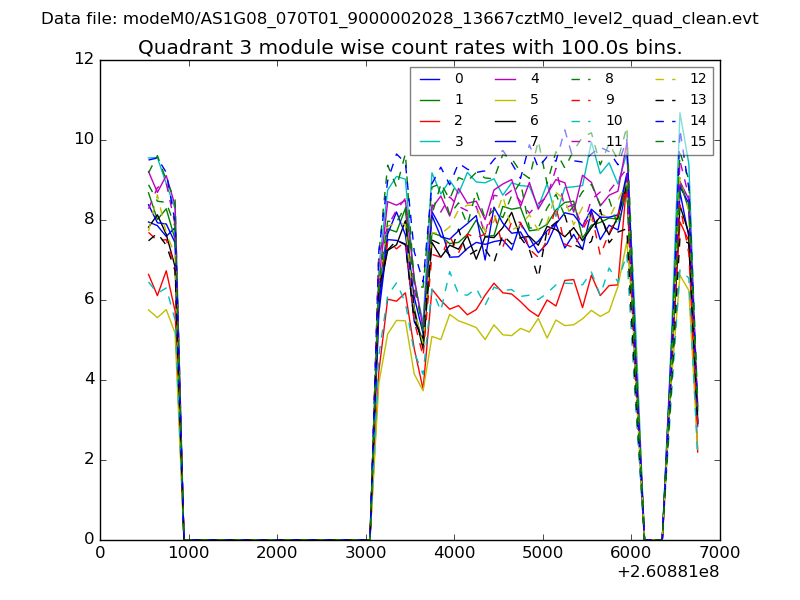
| Module-wise count rates for Quadrant D Data is divided into 100 sec bins |
 |
 |
| Parameter | Plot |
|---|---|
| CZT HV Monitor | 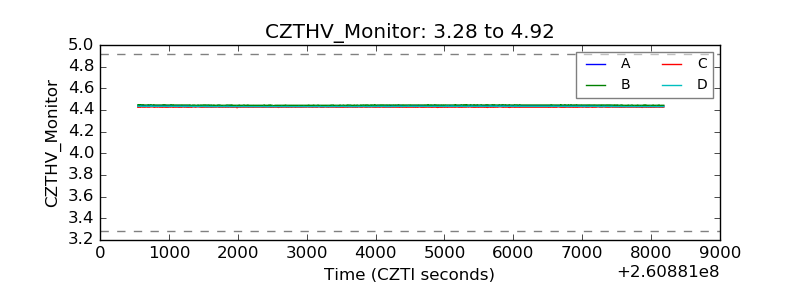 |
| D_VDD | 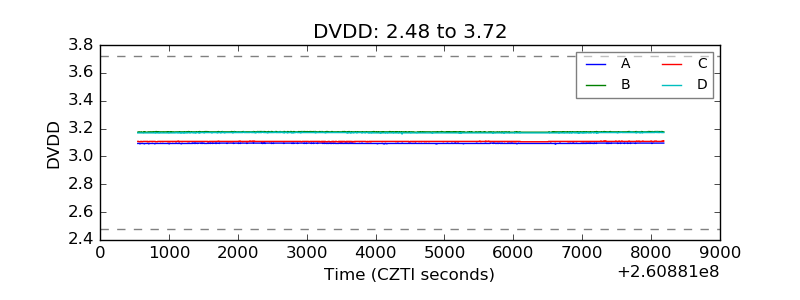 |
| Temperature 1 | 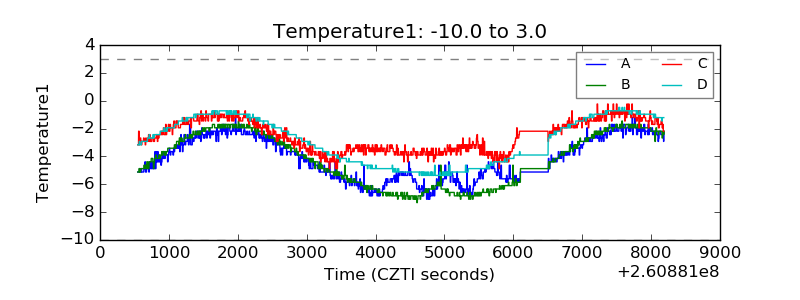 |
| Veto HV Monitor | 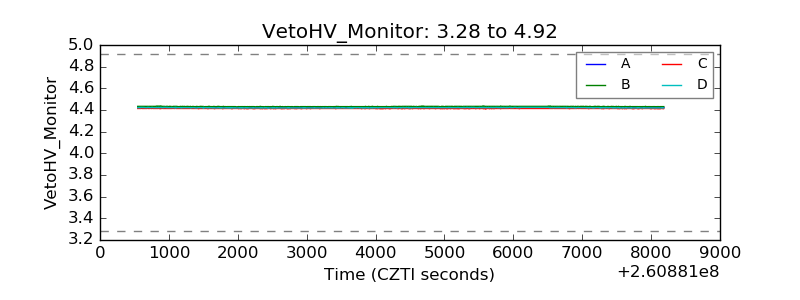 |
| Veto LLD | 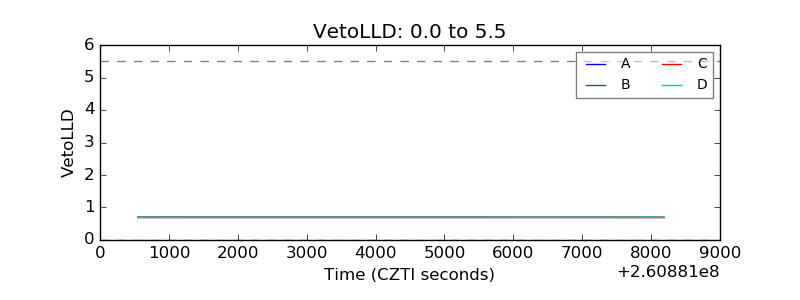 |
| Alpha Counter | 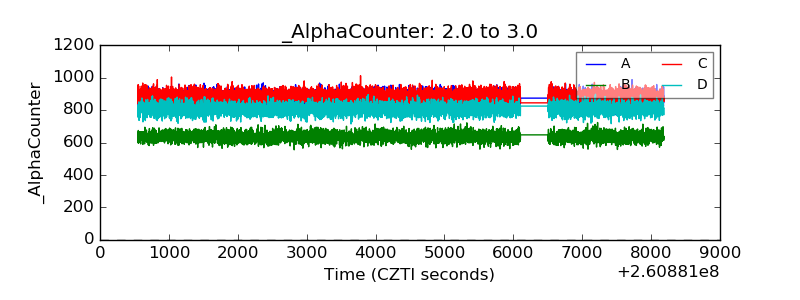 |
| _CPM_Rate | 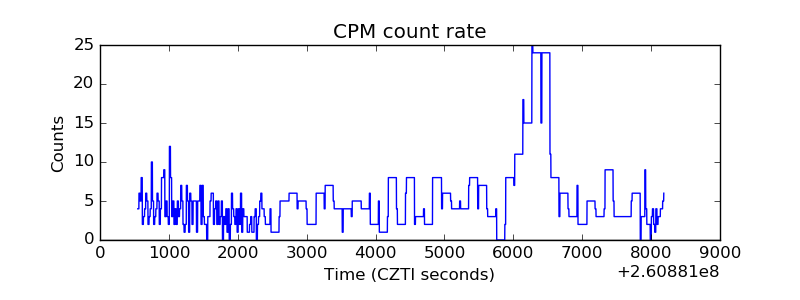 |
| CZT Counter |  |
| +2.5 Volts monitor | 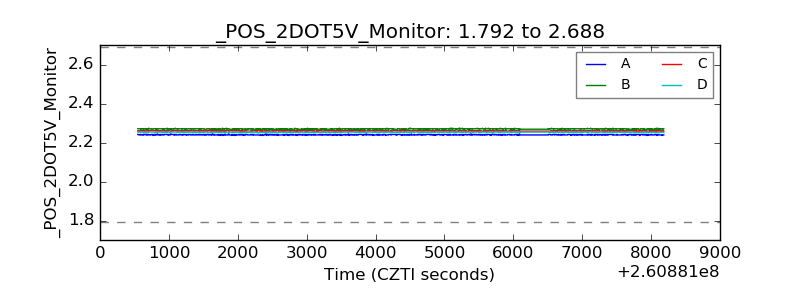 |
| +5 Volts monitor |  |
| _ROLL_ROT | 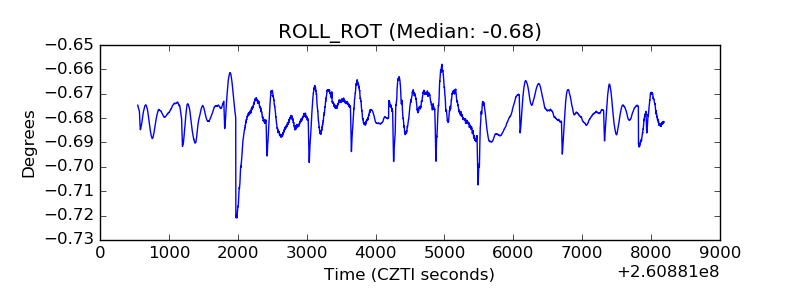 |
| _Roll_DEC | 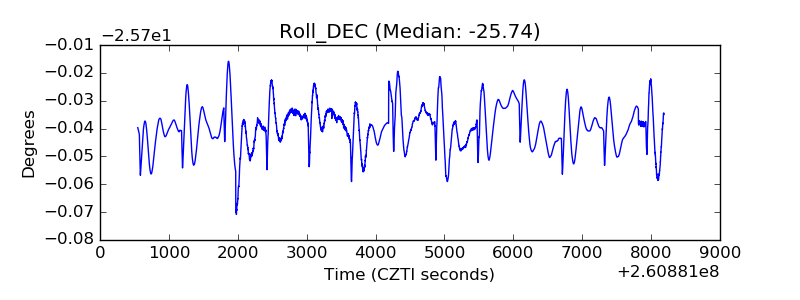 |
| _Roll_RA | 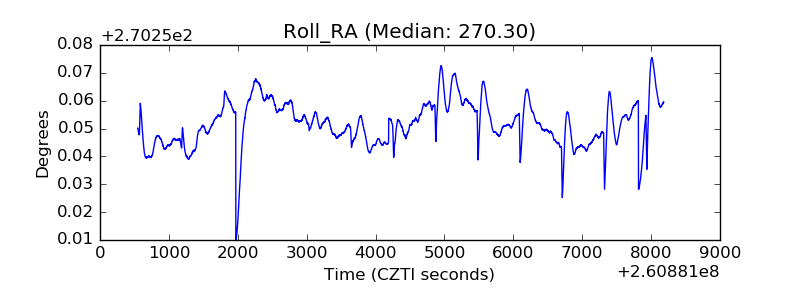 |
| Veto Counter | 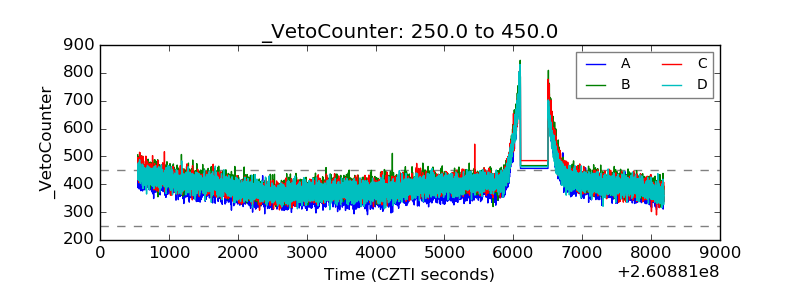 |