| Param | Original file | Final file |
|---|---|---|
| Filename | modeM0/AS1G08_070T01_9000002028_13668cztM0_level2.evt | modeM0/AS1G08_070T01_9000002028_13668cztM0_level2_quad_clean.evt |
| Size (bytes) | 607,538,880 | 87,171,840 |
| Size | 579.4 MB | 83.1 MB |
| Events in quadrant A | 3,899,451 | 534,950 |
| Events in quadrant B | 4,293,335 | 572,874 |
| Events in quadrant C | 4,165,057 | 511,782 |
| Events in quadrant D | 5,514,677 | 479,302 |
| Mode SS | |||
|---|---|---|---|
| Quadrant | BADHDUFLAG | Total packets | Discarded packets |
| A | 0 | 156 | 0 |
| B | 0 | 156 | 0 |
| C | 0 | 156 | 0 |
| D | 0 | 156 | 0 |
| Mode M9 | |||
|---|---|---|---|
| Quadrant | BADHDUFLAG | Total packets | Discarded packets |
| A | 0 | 1 | 0 |
| B | 0 | 1 | 0 |
| C | 0 | 1 | 0 |
| D | 0 | 2 | 0 |
| Mode M0 | |||
|---|---|---|---|
| Quadrant | BADHDUFLAG | Total packets | Discarded packets |
| A | 0 | 16540 | 4 |
| B | 0 | 17519 | 3 |
| C | 0 | 16926 | 3 |
| D | 0 | 21583 | 3 |
| Quadrant | Total seconds | Saturated seconds | Saturation percentage |
|---|---|---|---|
| A | 7777 | 273 | 3.510351% |
| B | 7777 | 312 | 4.011830% |
| C | 7777 | 198 | 2.545969% |
| D | 7777 | 358 | 4.603317% |
Noise dominated data is calculated using 1-second bins in cleaned event files. If a bin has >2000 counts, and if more than 50% of those come from <1% of pixels, then it is considered to be noise-dominated and hence unusable.
| Quadrant | # 1 sec bins | Bins with >0 counts | Bins with >2000 counts | High rate bins dominated by noise | Noise dominated (total time) | Noise dominated (detector-on time) | Marked lightcurve |
|---|---|---|---|---|---|---|---|
| A | 7823 | 7780 | 5 | 5 | 0.06% | 0.06% | 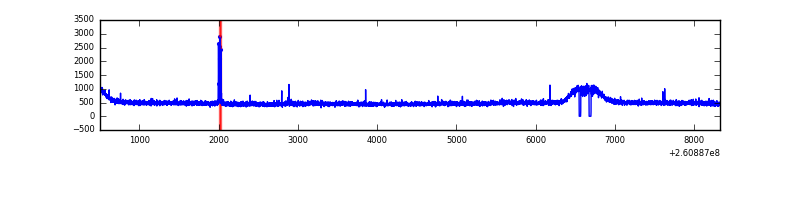 |
| B | 7823 | 7780 | 6 | 6 | 0.08% | 0.08% | 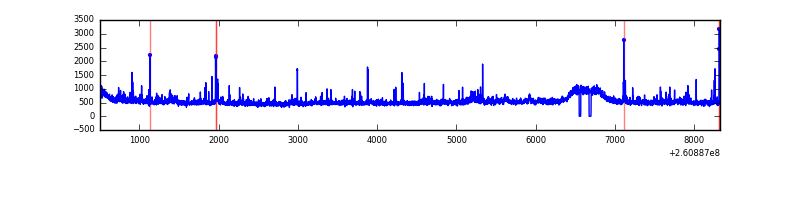 |
| C | 7823 | 7780 | 0 | 0 | 0.00% | 0.00% | 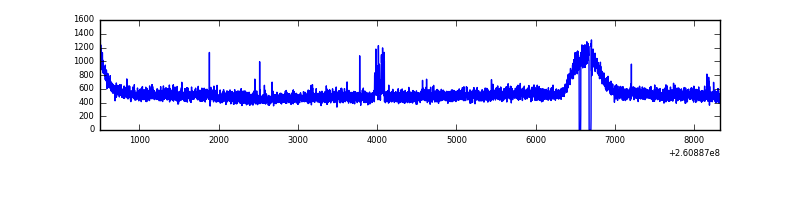 |
| D | 7823 | 7780 | 130 | 130 | 1.66% | 1.67% | 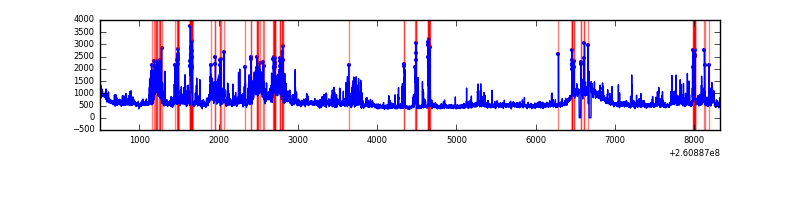 |
Top three noisy pixels from each quadrant. If the there are fewer than three noisy pixels in the level2.evt file, extra rows are filled as -1
| Pixel properties | Quadrant properties | ||||||
|---|---|---|---|---|---|---|---|
| Quadrant | DetID | PixID | Counts | Sigma | Mean | Median | Sigma |
| A | 15 | 69 | 35248 | 167.69 | 999 | 975 | 204.4 |
| A | 1 | 162 | 18843 | 87.42 | 999 | 975 | 204.4 |
| A | 0 | 226 | 8916 | 38.85 | 999 | 975 | 204.4 |
| B | 0 | 219 | 168958 | 870.82 | 1003 | 981 | 192.9 |
| B | 0 | 214 | 87671 | 449.42 | 1003 | 981 | 192.9 |
| B | 3 | 209 | 38988 | 197.03 | 1003 | 981 | 192.9 |
| C | 3 | 233 | 377797 | 1672.47 | 961 | 966 | 225.3 |
| C | 14 | 220 | 37487 | 162.09 | 961 | 966 | 225.3 |
| C | 13 | 61 | 6935 | 26.49 | 961 | 966 | 225.3 |
| D | 5 | 222 | 702073 | 3030.61 | 952 | 927 | 231.4 |
| D | 1 | 52 | 489014 | 2109.69 | 952 | 927 | 231.4 |
| D | 8 | 195 | 340412 | 1467.38 | 952 | 927 | 231.4 |
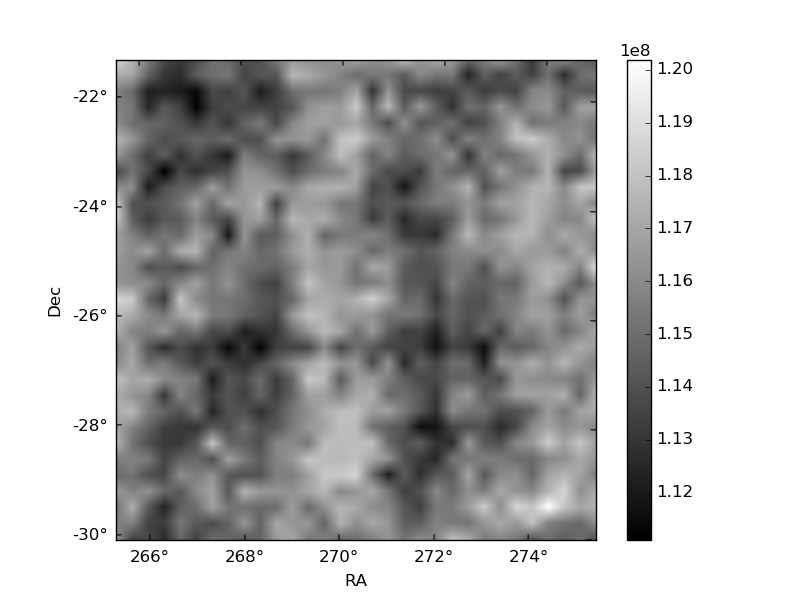
Histogram calculated using DETX and DETY for each event in the final _common_clean file
| Quadrant A | 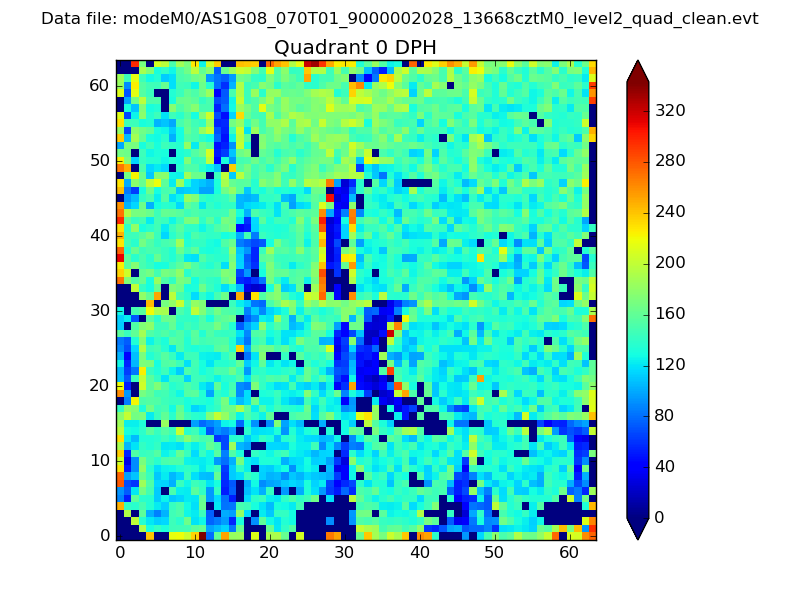 |
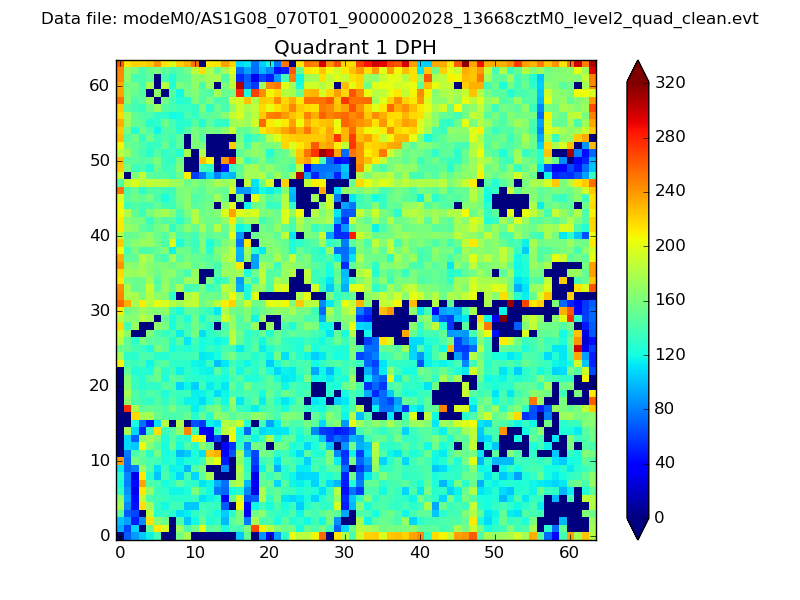 |
Quadrant B |
|---|---|---|---|
| Quadrant D | 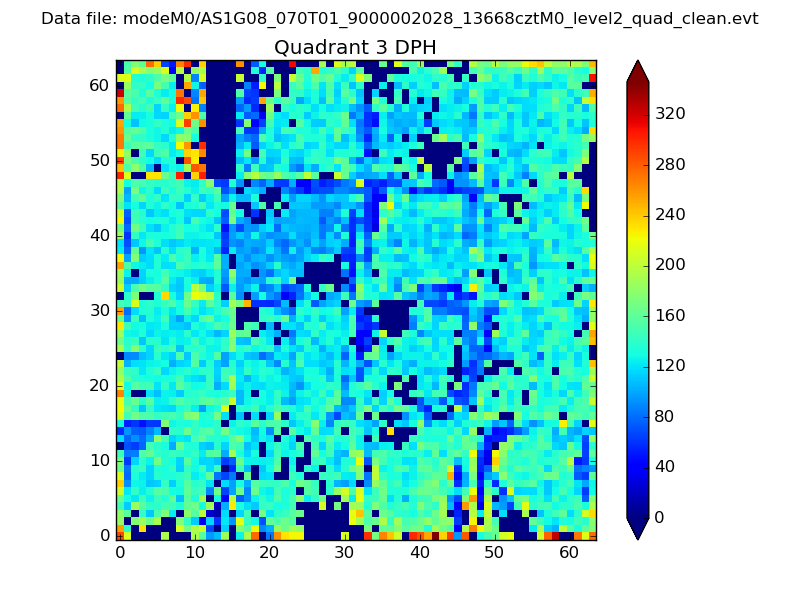 |
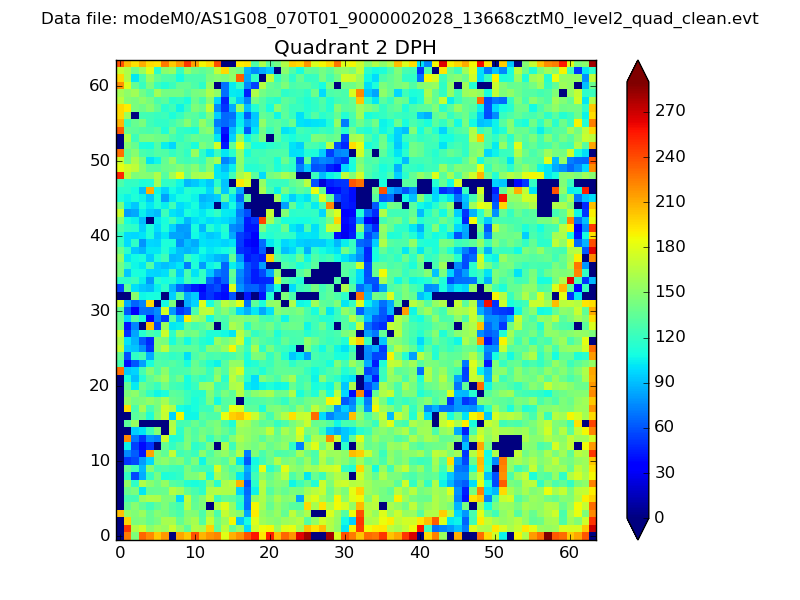 |
Quadrant C |
| Plot type | Count rate plots | Images |
|---|---|---|
| Comparison with Poisson distribution Blue bars denote a histogram of data divided into 1 sec bins. Red curve is a Poisson curve with rate = median count rate of data. |
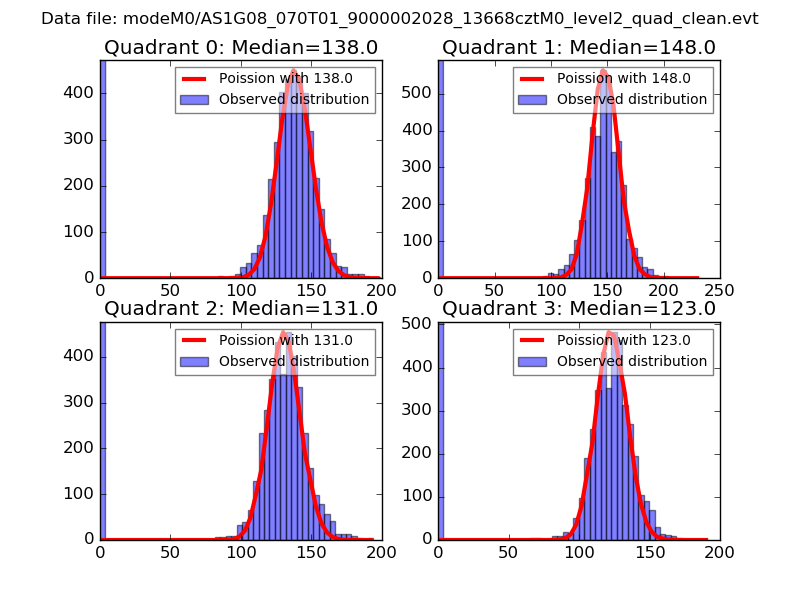 |
 |
| Quadrant-wise count rates Data is divided into 100 sec bins |
 |
|
| Module-wise count rates for Quadrant A Data is divided into 100 sec bins |
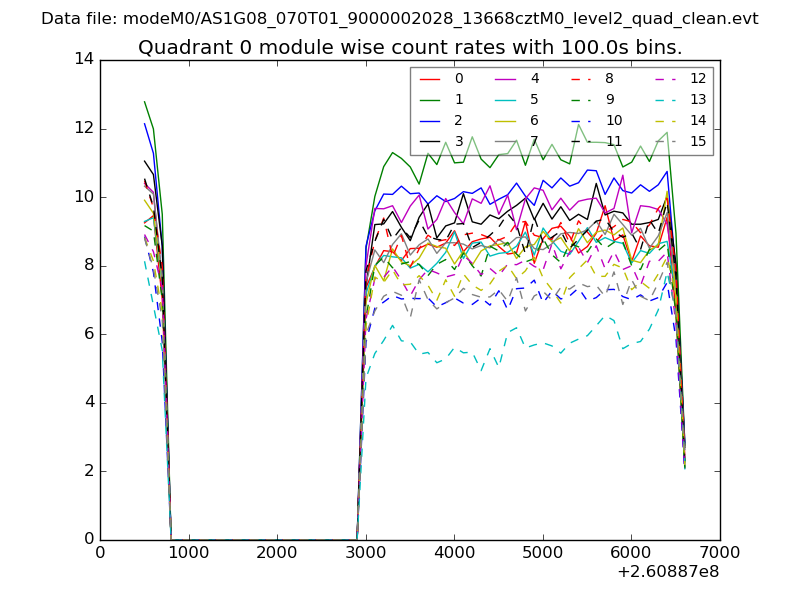 |
 |
| Module-wise count rates for Quadrant B Data is divided into 100 sec bins |
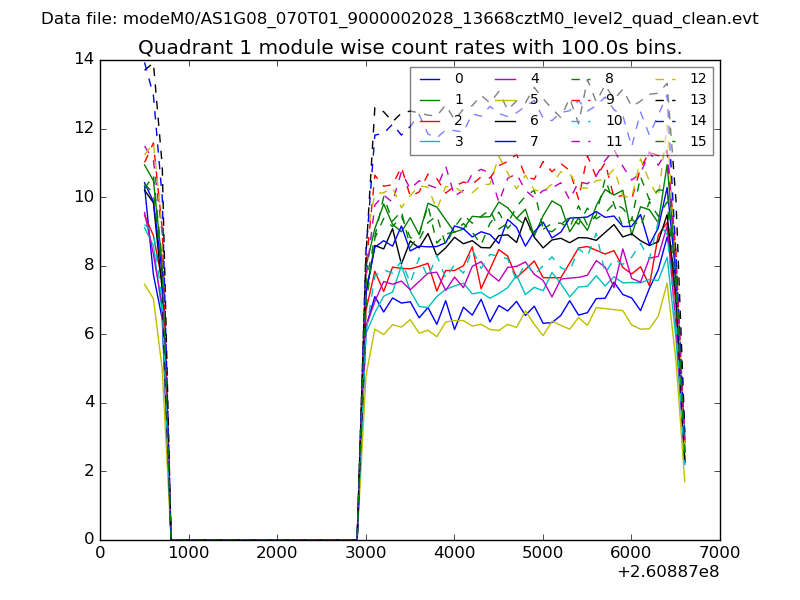 |
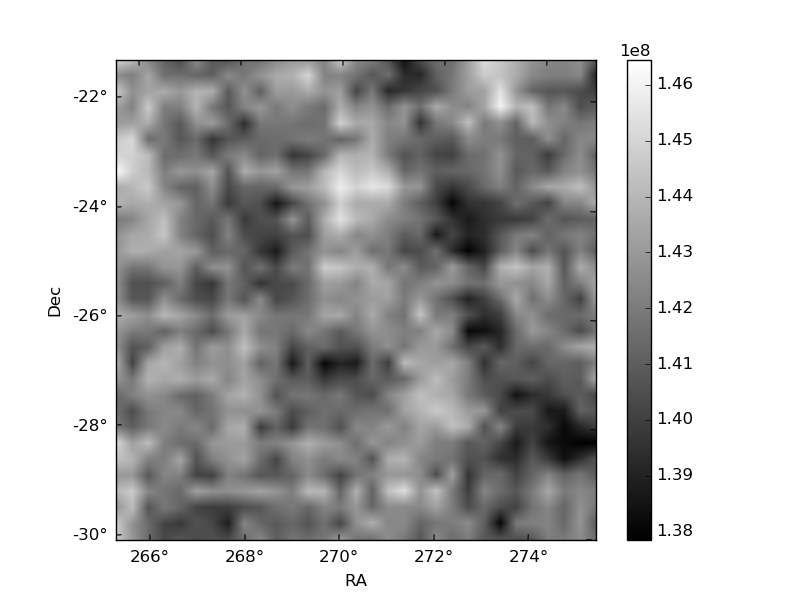 |
| Module-wise count rates for Quadrant C Data is divided into 100 sec bins |
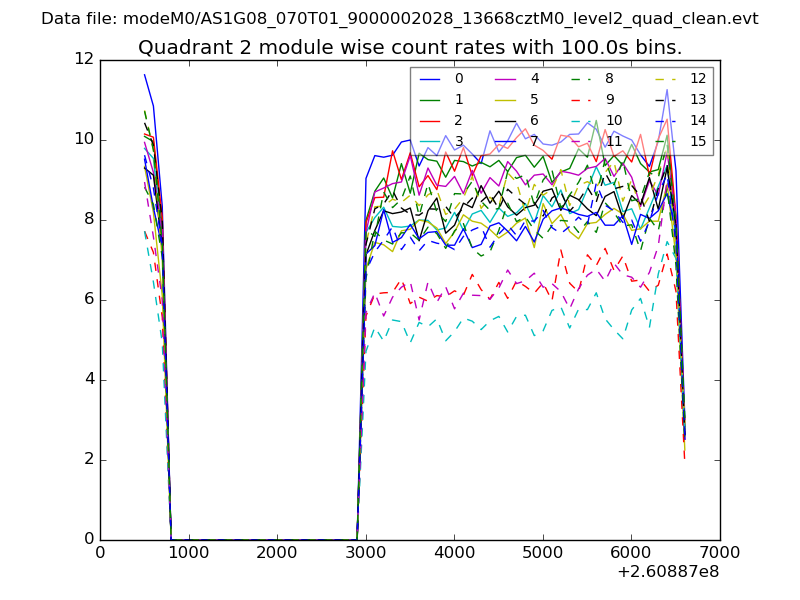 |
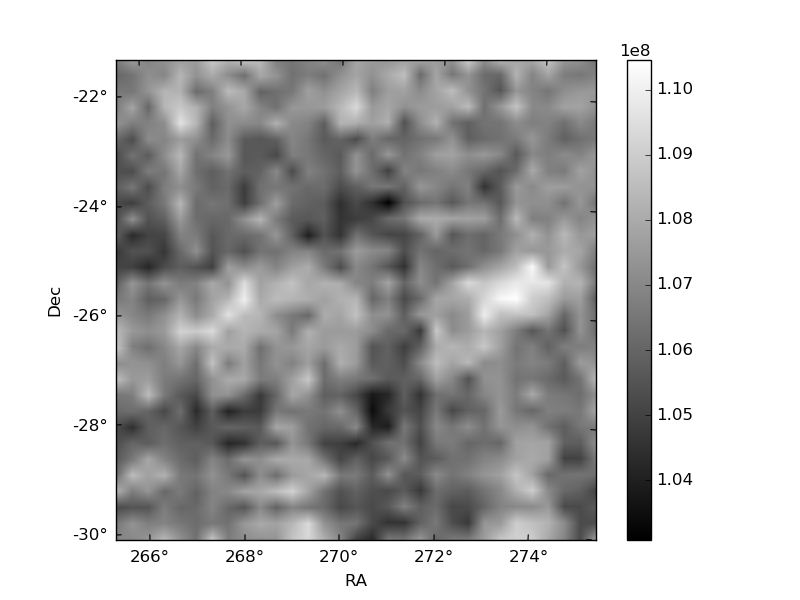 |
| Module-wise count rates for Quadrant D Data is divided into 100 sec bins |
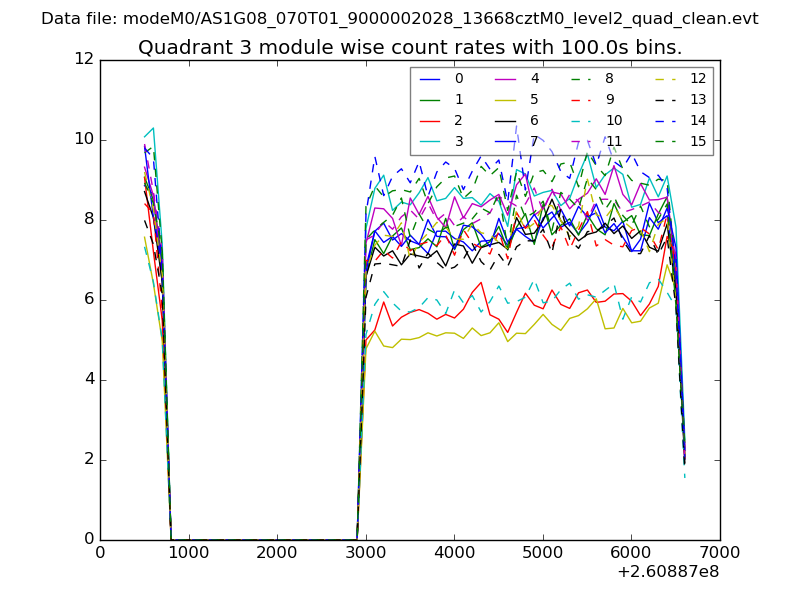 |
 |
| Parameter | Plot |
|---|---|
| CZT HV Monitor | 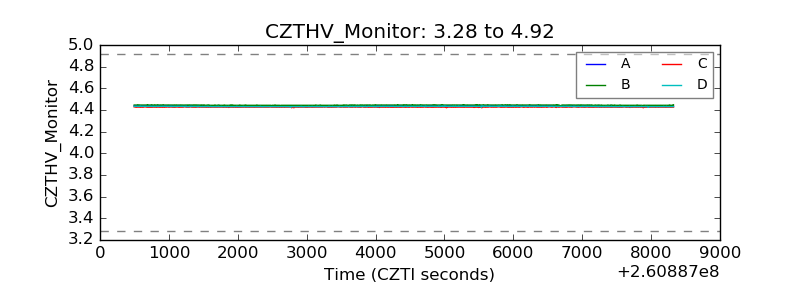 |
| D_VDD | 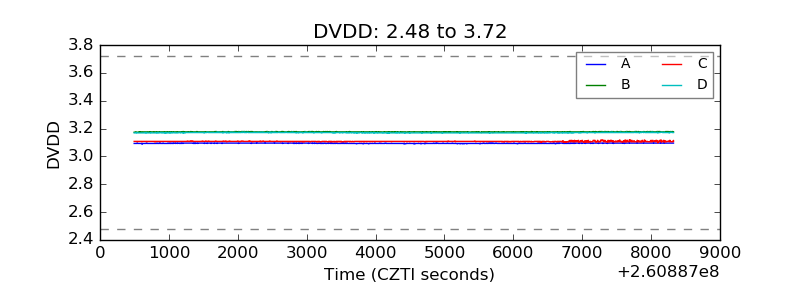 |
| Temperature 1 | 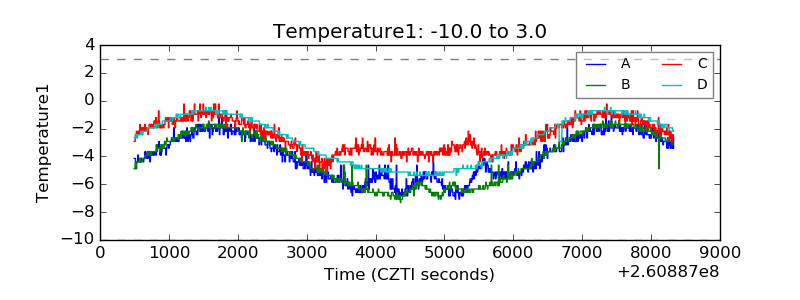 |
| Veto HV Monitor | 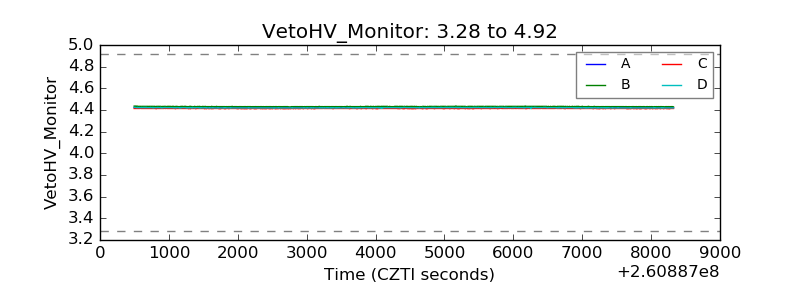 |
| Veto LLD | 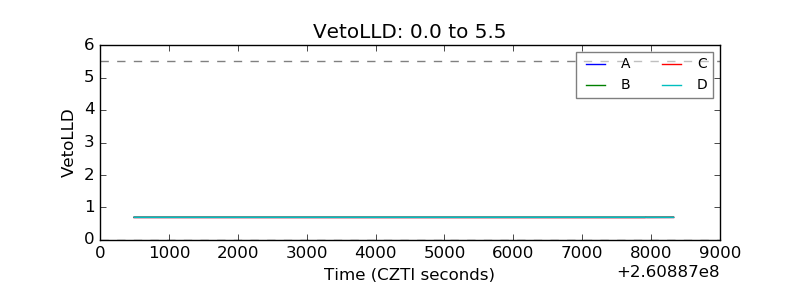 |
| Alpha Counter | 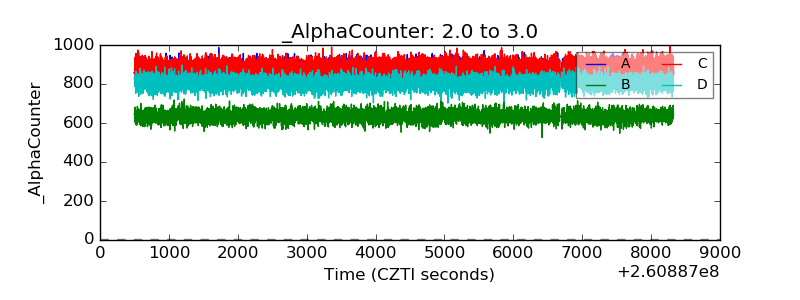 |
| _CPM_Rate | 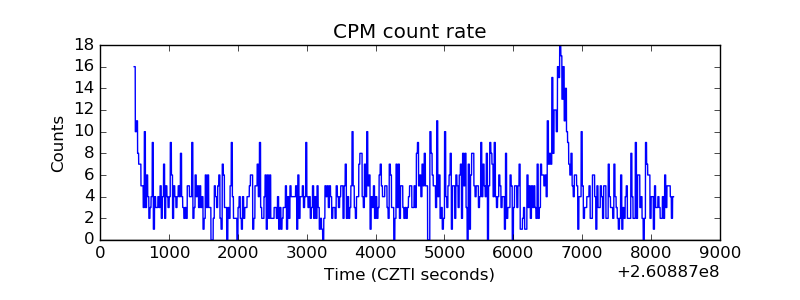 |
| CZT Counter | 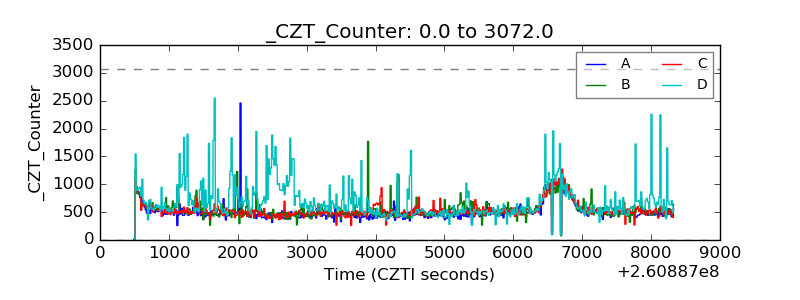 |
| +2.5 Volts monitor |  |
| +5 Volts monitor |  |
| _ROLL_ROT | 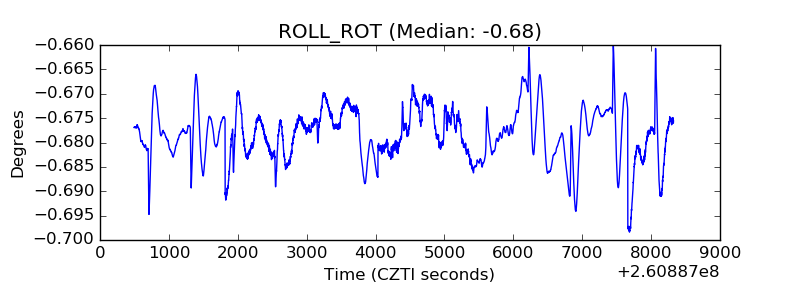 |
| _Roll_DEC | 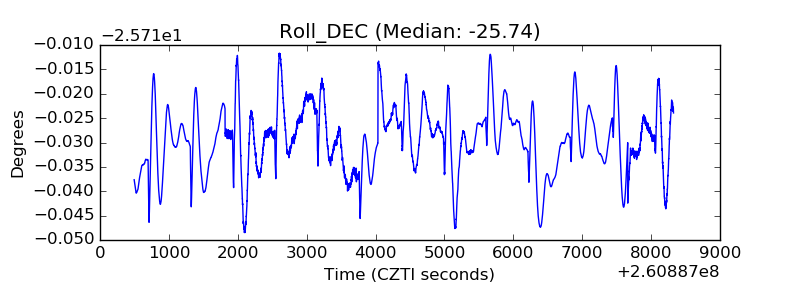 |
| _Roll_RA |  |
| Veto Counter | 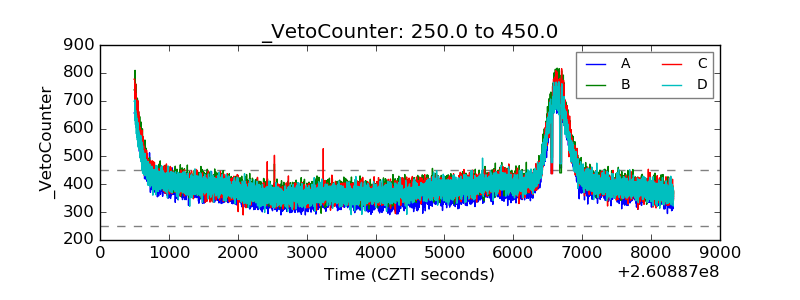 |