| Param | Original file | Final file |
|---|---|---|
| Filename | modeM0/AS1G08_070T01_9000002028_13669cztM0_level2.evt | modeM0/AS1G08_070T01_9000002028_13669cztM0_level2_quad_clean.evt |
| Size (bytes) | 626,448,960 | 86,434,560 |
| Size | 597.4 MB | 82.4 MB |
| Events in quadrant A | 4,027,443 | 526,591 |
| Events in quadrant B | 4,488,872 | 561,893 |
| Events in quadrant C | 4,257,179 | 501,094 |
| Events in quadrant D | 5,654,469 | 469,633 |
| Mode SS | |||
|---|---|---|---|
| Quadrant | BADHDUFLAG | Total packets | Discarded packets |
| A | 0 | 164 | 0 |
| B | 0 | 164 | 0 |
| C | 0 | 164 | 0 |
| D | 0 | 164 | 0 |
| Mode M9 | |||
|---|---|---|---|
| Quadrant | BADHDUFLAG | Total packets | Discarded packets |
| A | 0 | 4 | 0 |
| B | 0 | 4 | 0 |
| C | 0 | 4 | 0 |
| D | 0 | 4 | 0 |
| Mode M0 | |||
|---|---|---|---|
| Quadrant | BADHDUFLAG | Total packets | Discarded packets |
| A | 0 | 17114 | 4 |
| B | 0 | 18260 | 3 |
| C | 0 | 17339 | 3 |
| D | 0 | 22075 | 3 |
| Quadrant | Total seconds | Saturated seconds | Saturation percentage |
|---|---|---|---|
| A | 8031 | 305 | 3.797784% |
| B | 8031 | 369 | 4.594696% |
| C | 8031 | 229 | 2.851451% |
| D | 8031 | 388 | 4.831279% |
Noise dominated data is calculated using 1-second bins in cleaned event files. If a bin has >2000 counts, and if more than 50% of those come from <1% of pixels, then it is considered to be noise-dominated and hence unusable.
| Quadrant | # 1 sec bins | Bins with >0 counts | Bins with >2000 counts | High rate bins dominated by noise | Noise dominated (total time) | Noise dominated (detector-on time) | Marked lightcurve |
|---|---|---|---|---|---|---|---|
| A | 8377 | 8035 | 0 | 0 | 0.00% | 0.00% | 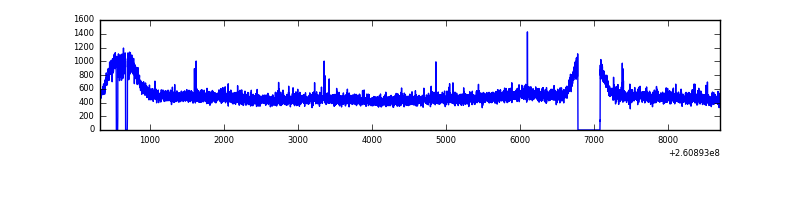 |
| B | 8377 | 8035 | 12 | 12 | 0.14% | 0.15% | 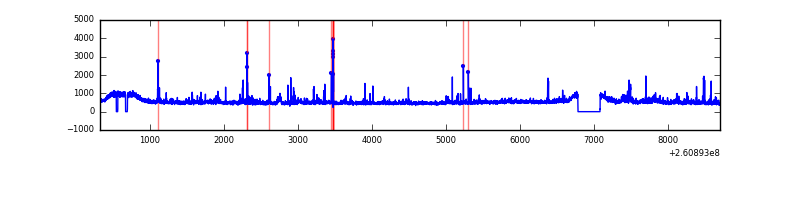 |
| C | 8377 | 8035 | 0 | 0 | 0.00% | 0.00% | 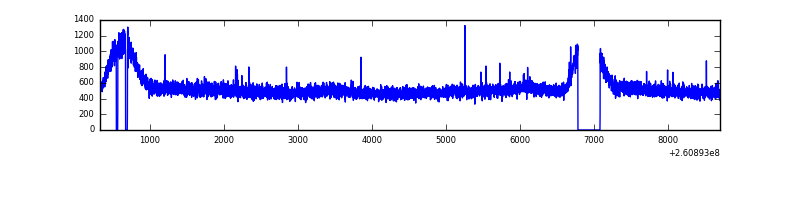 |
| D | 8377 | 8035 | 94 | 94 | 1.12% | 1.17% | 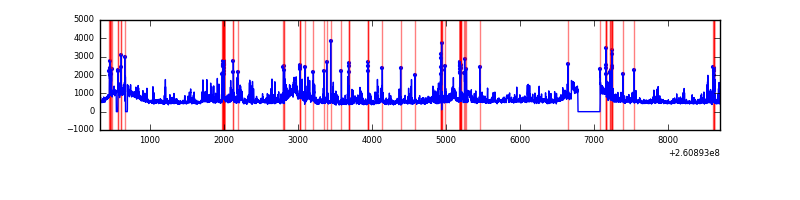 |
Top three noisy pixels from each quadrant. If the there are fewer than three noisy pixels in the level2.evt file, extra rows are filled as -1
| Pixel properties | Quadrant properties | ||||||
|---|---|---|---|---|---|---|---|
| Quadrant | DetID | PixID | Counts | Sigma | Mean | Median | Sigma |
| A | 1 | 162 | 20574 | 91.76 | 1036 | 1011 | 213.2 |
| A | 0 | 226 | 9199 | 38.4 | 1036 | 1011 | 213.2 |
| A | 12 | 194 | 8030 | 32.92 | 1036 | 1011 | 213.2 |
| B | 0 | 219 | 183215 | 909.72 | 1037 | 1016 | 200.3 |
| B | 4 | 142 | 82254 | 405.62 | 1037 | 1016 | 200.3 |
| B | 3 | 209 | 49257 | 240.87 | 1037 | 1016 | 200.3 |
| C | 3 | 233 | 360926 | 1536.92 | 995 | 1001 | 234.2 |
| C | 8 | 128 | 8765 | 33.15 | 995 | 1001 | 234.2 |
| C | 13 | 61 | 7207 | 26.5 | 995 | 1001 | 234.2 |
| D | 1 | 52 | 626039 | 2577.97 | 987 | 959 | 242.5 |
| D | 13 | 122 | 463096 | 1905.96 | 987 | 959 | 242.5 |
| D | 8 | 195 | 304594 | 1252.26 | 987 | 959 | 242.5 |
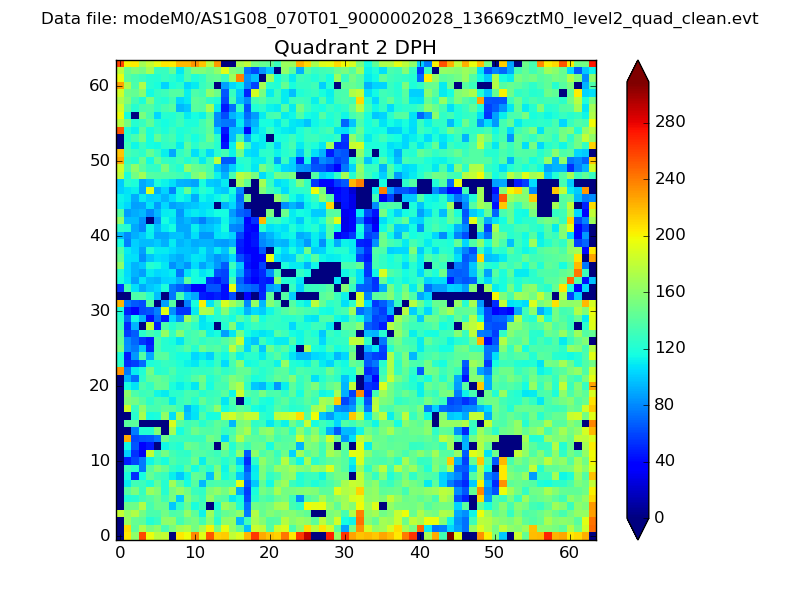
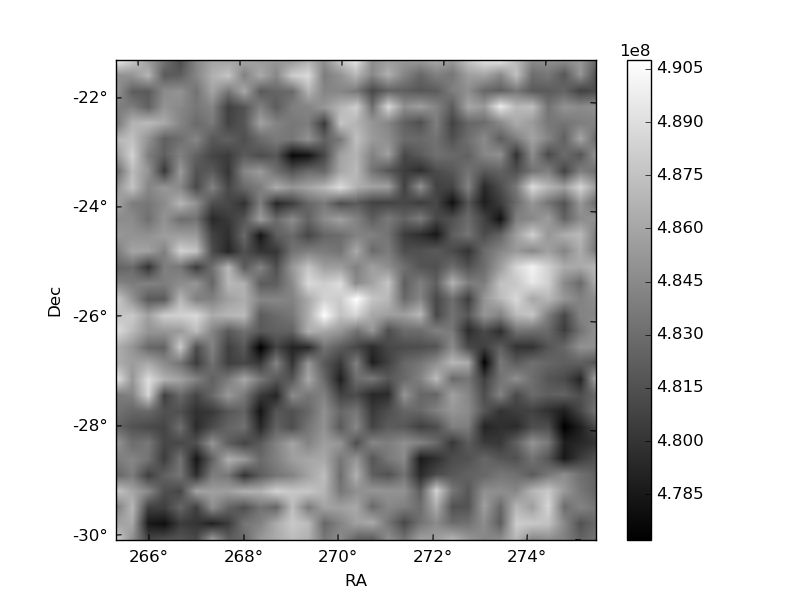
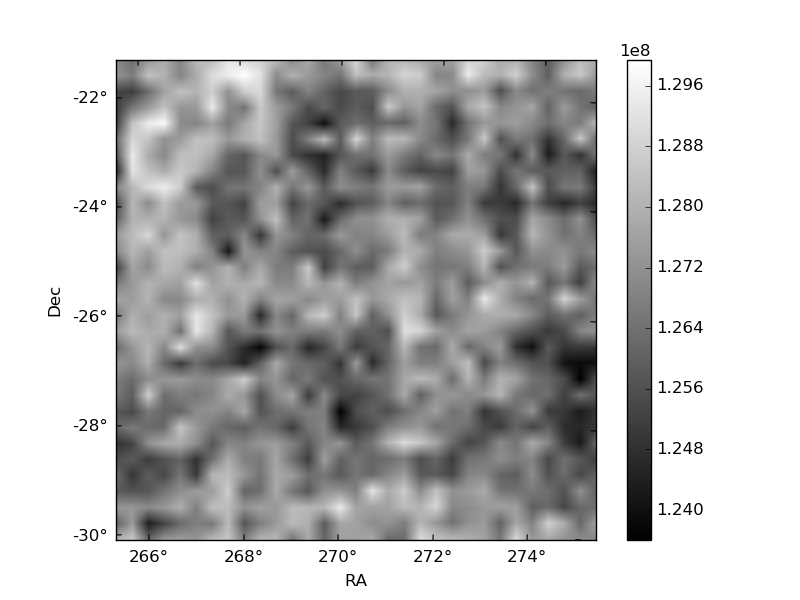
Histogram calculated using DETX and DETY for each event in the final _common_clean file
| Quadrant A | 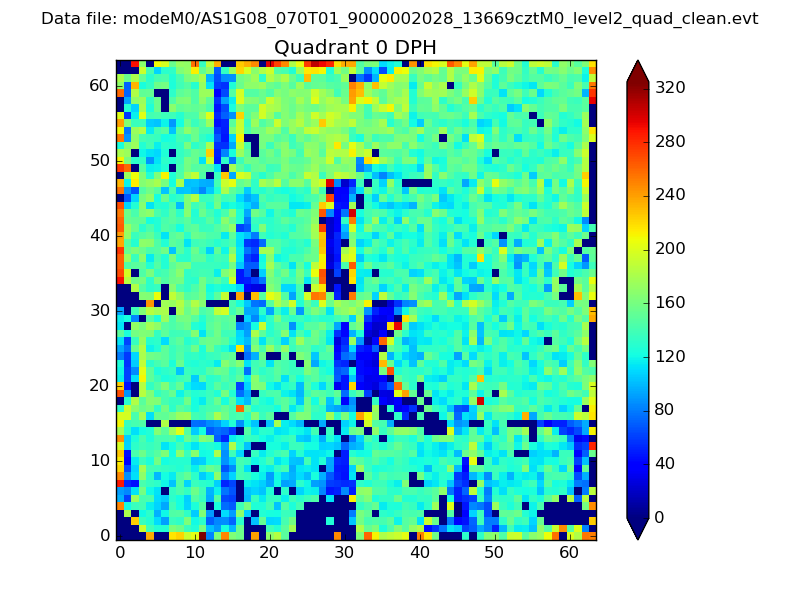 |
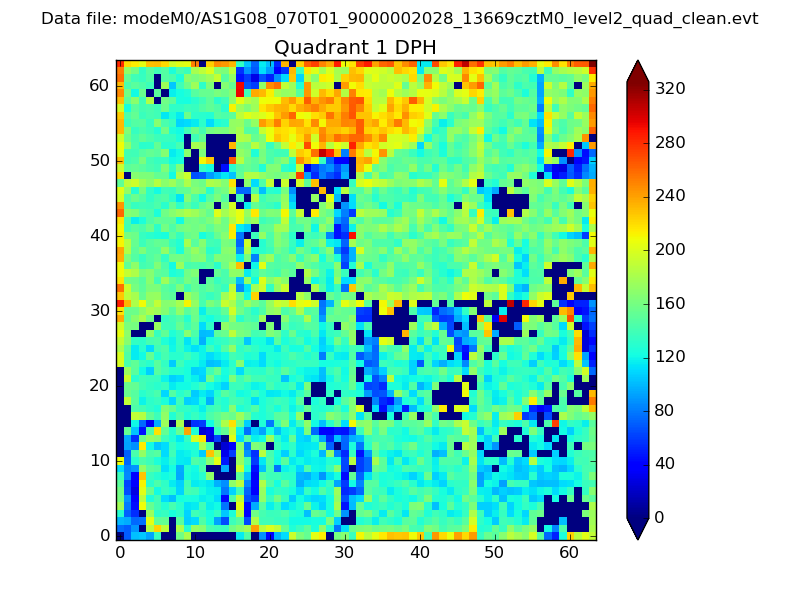 |
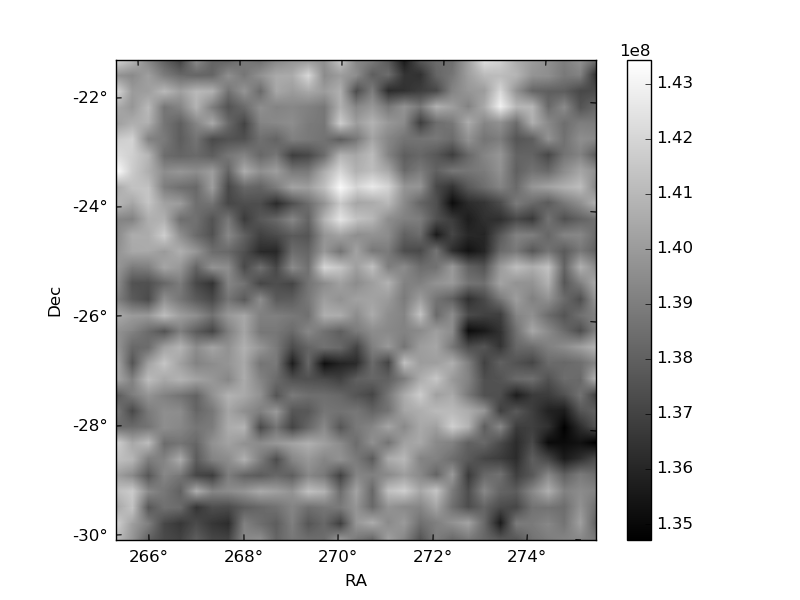
Quadrant B |
|---|---|---|---|
| Quadrant D | 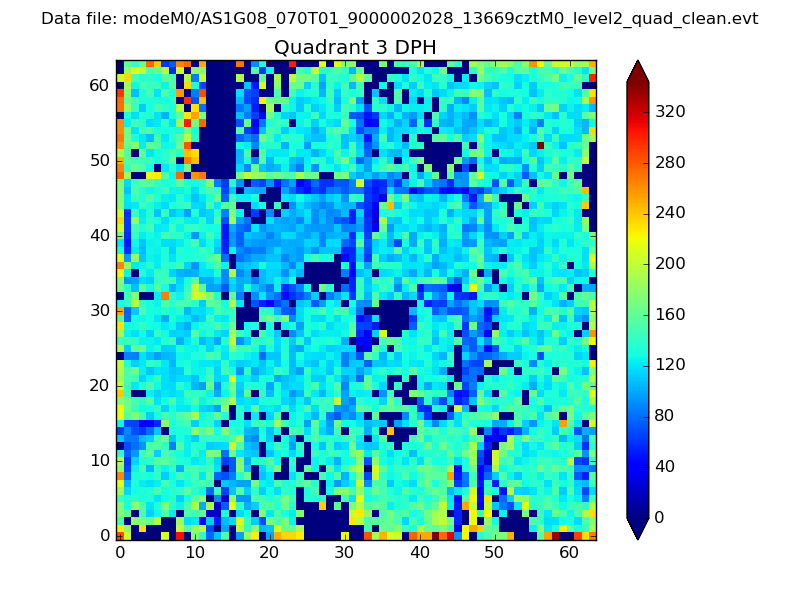 |
 |
Quadrant C |
| Plot type | Count rate plots | Images |
|---|---|---|
| Comparison with Poisson distribution Blue bars denote a histogram of data divided into 1 sec bins. Red curve is a Poisson curve with rate = median count rate of data. |
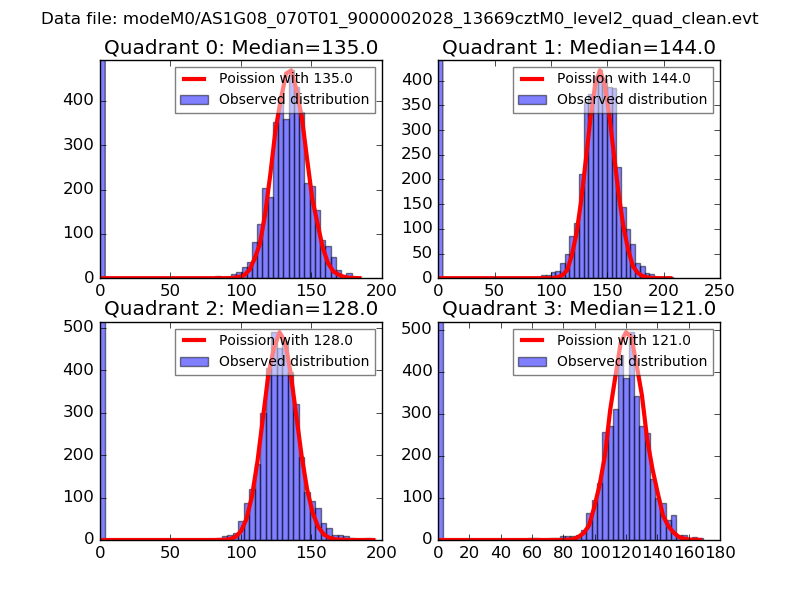 |
 |
| Quadrant-wise count rates Data is divided into 100 sec bins |
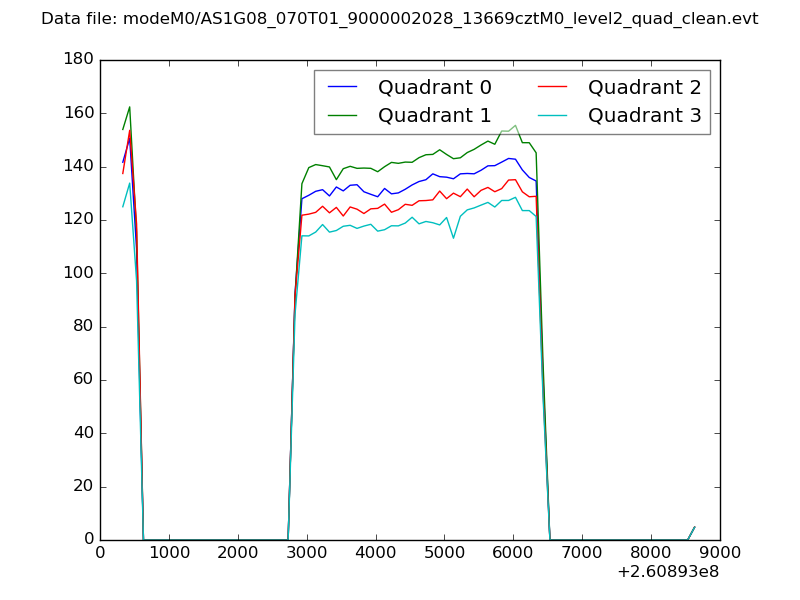 |
|
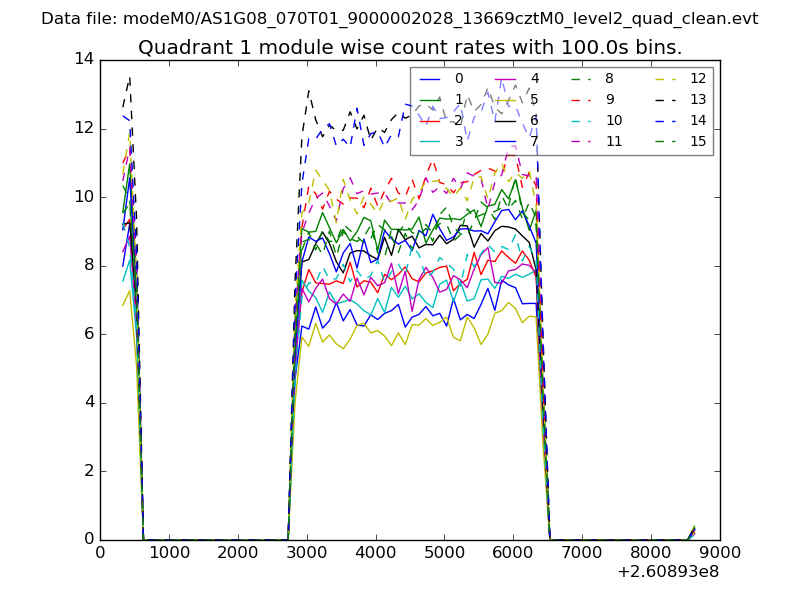
| Module-wise count rates for Quadrant A Data is divided into 100 sec bins |
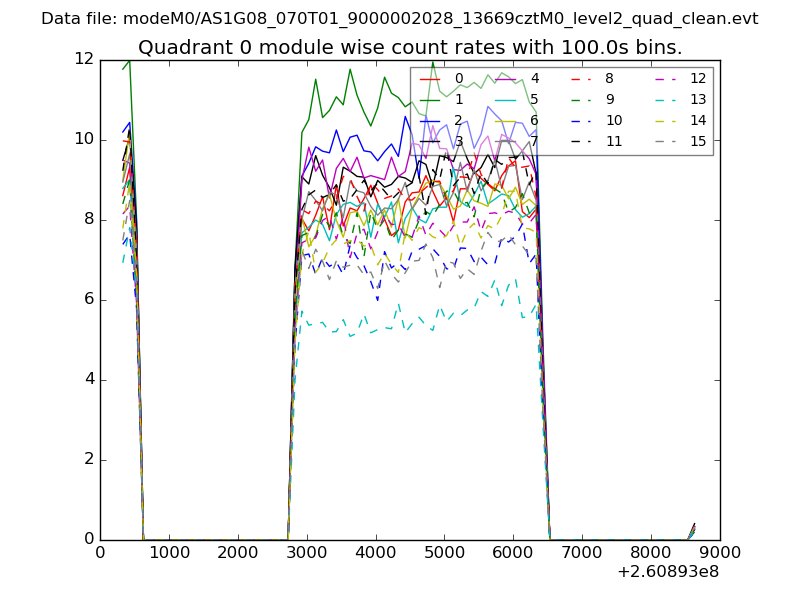 |
 |
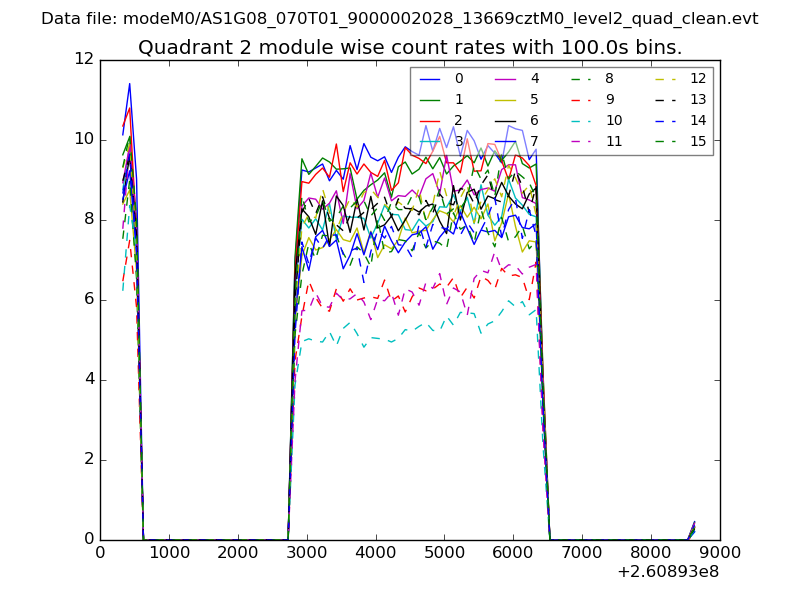
| Module-wise count rates for Quadrant B Data is divided into 100 sec bins |
 |
 |
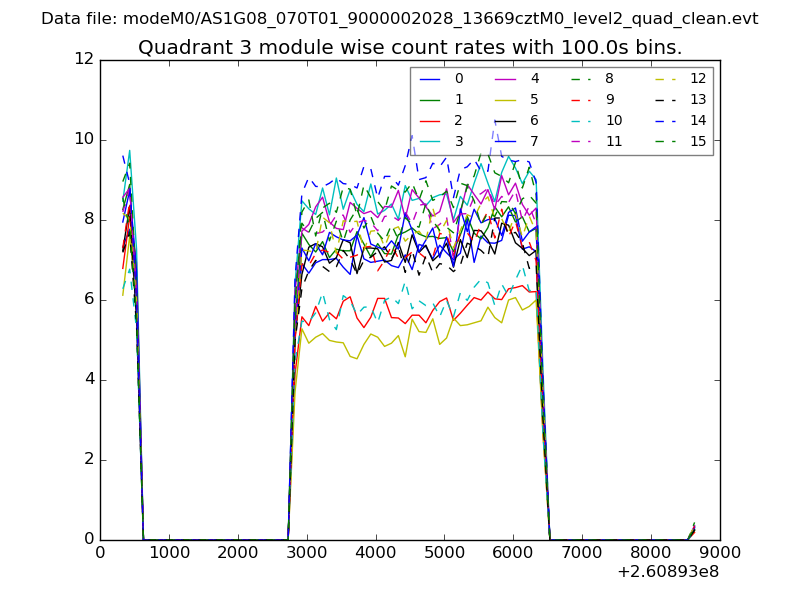
| Module-wise count rates for Quadrant C Data is divided into 100 sec bins |
 |
 |
| Module-wise count rates for Quadrant D Data is divided into 100 sec bins |
 |
 |
| Parameter | Plot |
|---|---|
| CZT HV Monitor | 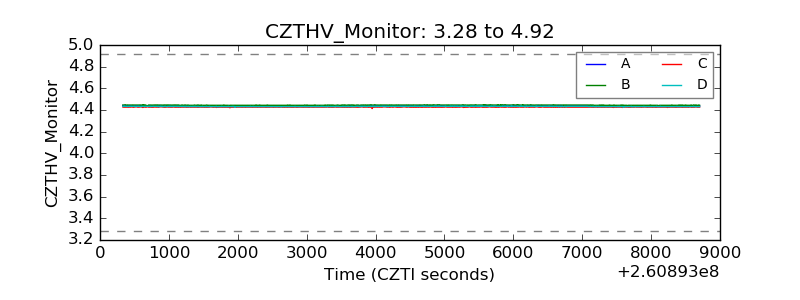 |
| D_VDD | 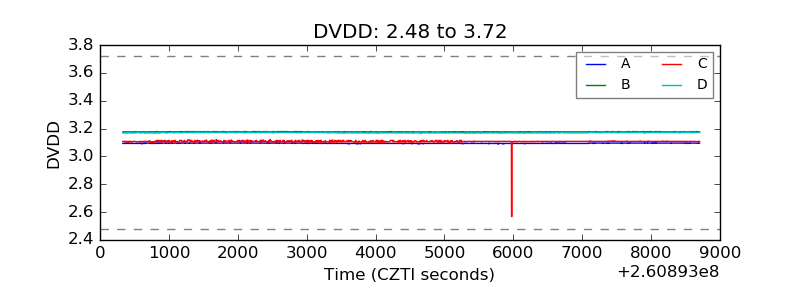 |
| Temperature 1 |  |
| Veto HV Monitor | 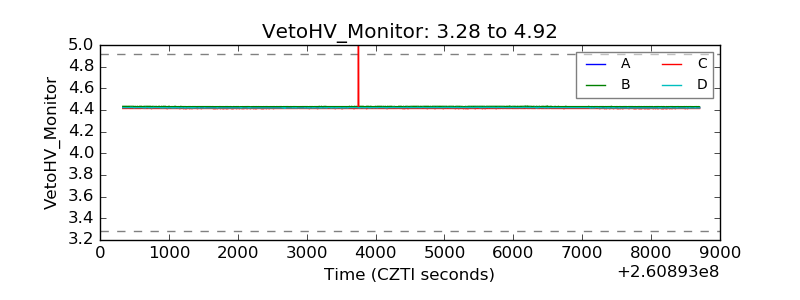 |
| Veto LLD | 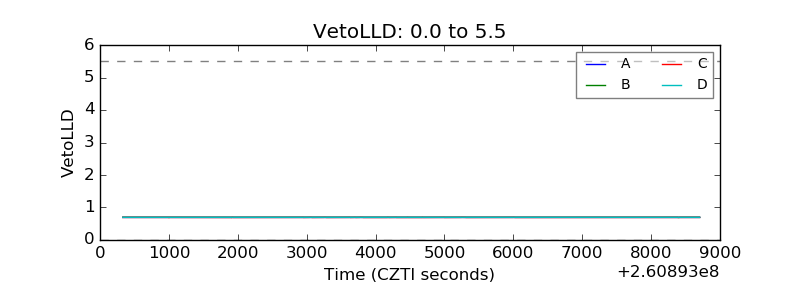 |
| Alpha Counter | 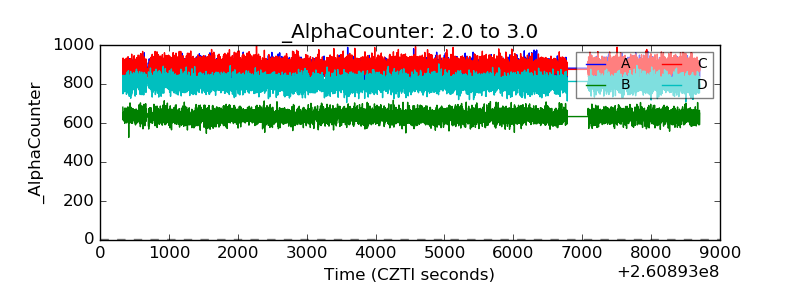 |
| _CPM_Rate | 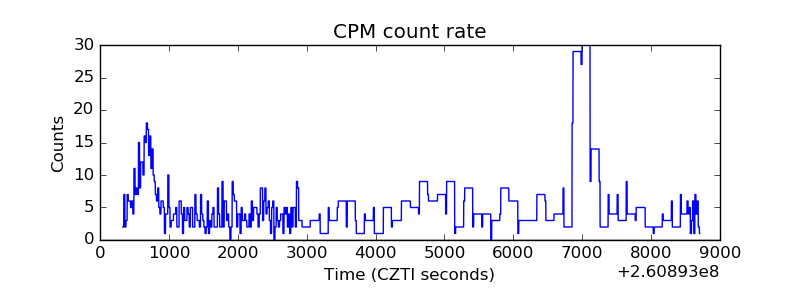 |
| CZT Counter |  |
| +2.5 Volts monitor |  |
| +5 Volts monitor |  |
| _ROLL_ROT | 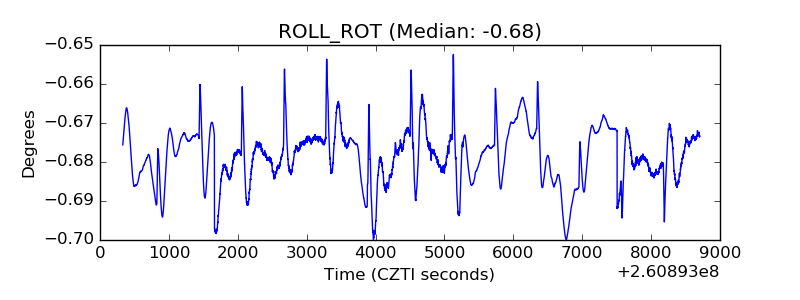 |
| _Roll_DEC | 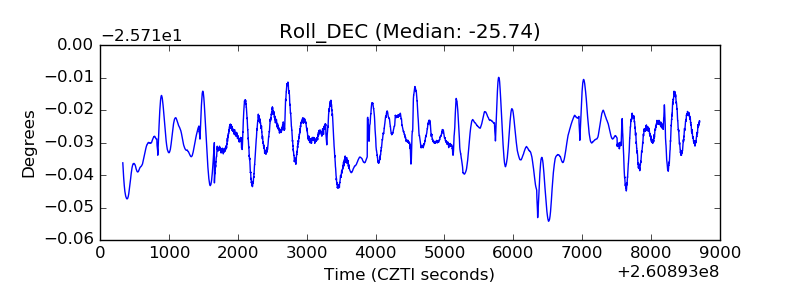 |
| _Roll_RA | 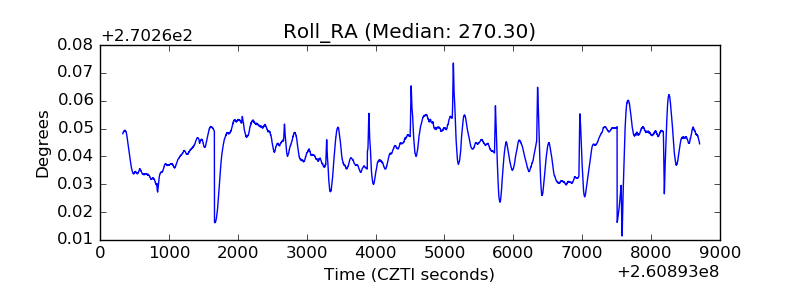 |
| Veto Counter | 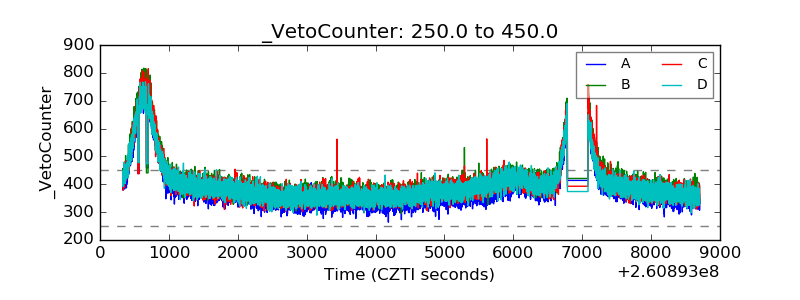 |