| Param | Original file | Final file |
|---|---|---|
| Filename | modeM0/AS1G08_070T01_9000002028_13671cztM0_level2.evt | modeM0/AS1G08_070T01_9000002028_13671cztM0_level2_quad_clean.evt |
| Size (bytes) | 977,405,760 | 173,136,960 |
| Size | 932.1 MB | 165.1 MB |
| Events in quadrant A | 6,470,140 | 1,099,046 |
| Events in quadrant B | 7,265,247 | 1,177,467 |
| Events in quadrant C | 6,774,915 | 1,046,592 |
| Events in quadrant D | 8,175,753 | 986,572 |
| Mode SS | |||
|---|---|---|---|
| Quadrant | BADHDUFLAG | Total packets | Discarded packets |
| A | 0 | 276 | 0 |
| B | 0 | 276 | 0 |
| C | 0 | 276 | 0 |
| D | 0 | 276 | 0 |
| Mode M9 | |||
|---|---|---|---|
| Quadrant | BADHDUFLAG | Total packets | Discarded packets |
| A | 0 | 15 | 0 |
| B | 0 | 15 | 0 |
| C | 0 | 15 | 0 |
| D | 0 | 15 | 0 |
| Mode M0 | |||
|---|---|---|---|
| Quadrant | BADHDUFLAG | Total packets | Discarded packets |
| A | 0 | 27852 | 4 |
| B | 0 | 29965 | 3 |
| C | 0 | 28028 | 3 |
| D | 0 | 32902 | 3 |
| Quadrant | Total seconds | Saturated seconds | Saturation percentage |
|---|---|---|---|
| A | 13525 | 132 | 0.975970% |
| B | 13525 | 235 | 1.737523% |
| C | 13525 | 83 | 0.613678% |
| D | 13525 | 283 | 2.092421% |
Noise dominated data is calculated using 1-second bins in cleaned event files. If a bin has >2000 counts, and if more than 50% of those come from <1% of pixels, then it is considered to be noise-dominated and hence unusable.
| Quadrant | # 1 sec bins | Bins with >0 counts | Bins with >2000 counts | High rate bins dominated by noise | Noise dominated (total time) | Noise dominated (detector-on time) | Marked lightcurve |
|---|---|---|---|---|---|---|---|
| A | 15001 | 13529 | 1 | 1 | 0.01% | 0.01% | 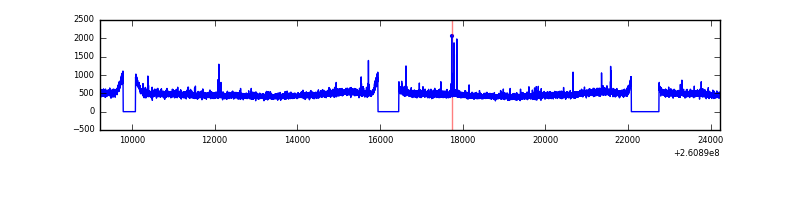 |
| B | 15001 | 13529 | 25 | 25 | 0.17% | 0.18% | 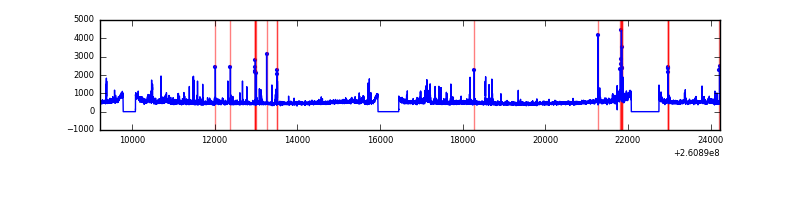 |
| C | 15001 | 13529 | 1 | 1 | 0.01% | 0.01% | 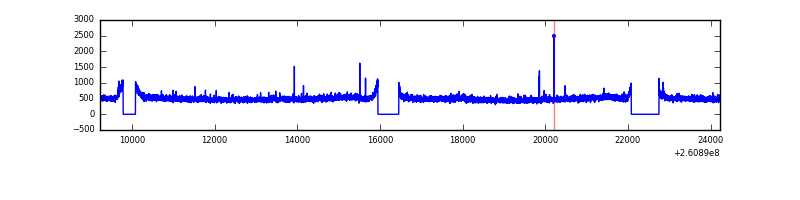 |
| D | 15001 | 13529 | 132 | 132 | 0.88% | 0.98% | 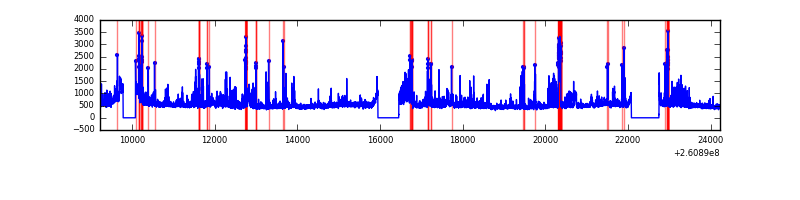 |
Top three noisy pixels from each quadrant. If the there are fewer than three noisy pixels in the level2.evt file, extra rows are filled as -1
| Pixel properties | Quadrant properties | ||||||
|---|---|---|---|---|---|---|---|
| Quadrant | DetID | PixID | Counts | Sigma | Mean | Median | Sigma |
| A | 15 | 69 | 24472 | 66.96 | 1667 | 1628 | 341.1 |
| A | 1 | 162 | 19408 | 52.12 | 1667 | 1628 | 341.1 |
| A | 0 | 226 | 14630 | 38.11 | 1667 | 1628 | 341.1 |
| B | 0 | 219 | 319411 | 995.39 | 1684 | 1653 | 319.2 |
| B | 3 | 64 | 102459 | 315.78 | 1684 | 1653 | 319.2 |
| B | 4 | 142 | 60799 | 185.28 | 1684 | 1653 | 319.2 |
| C | 3 | 233 | 522883 | 1405.16 | 1599 | 1607 | 371.0 |
| C | 14 | 234 | 14149 | 33.81 | 1599 | 1607 | 371.0 |
| C | 13 | 61 | 11583 | 26.89 | 1599 | 1607 | 371.0 |
| D | 5 | 222 | 590937 | 1530.15 | 1582 | 1535 | 385.2 |
| D | 1 | 52 | 450834 | 1166.43 | 1582 | 1535 | 385.2 |
| D | 13 | 122 | 404464 | 1046.05 | 1582 | 1535 | 385.2 |
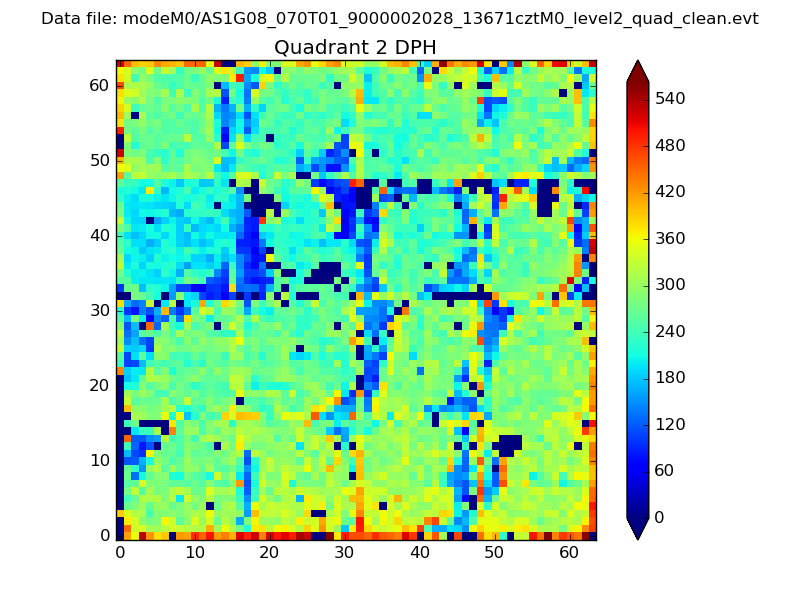
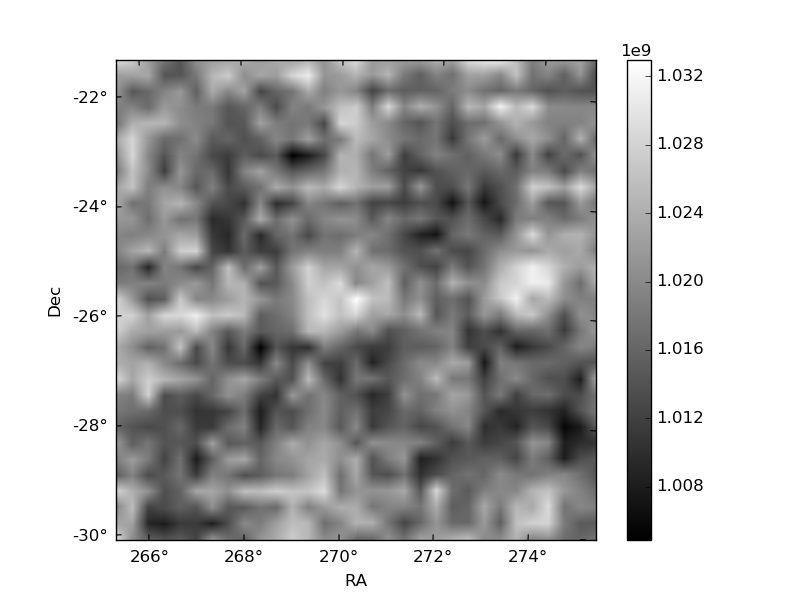
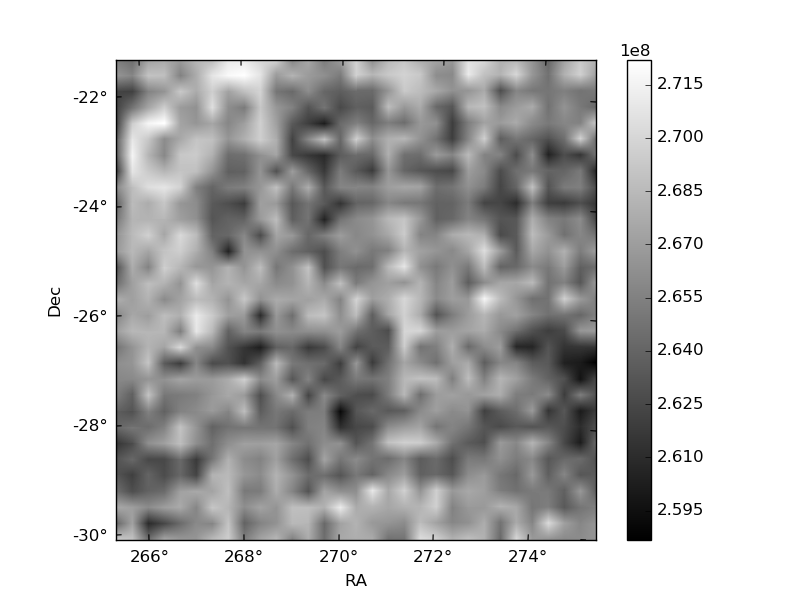
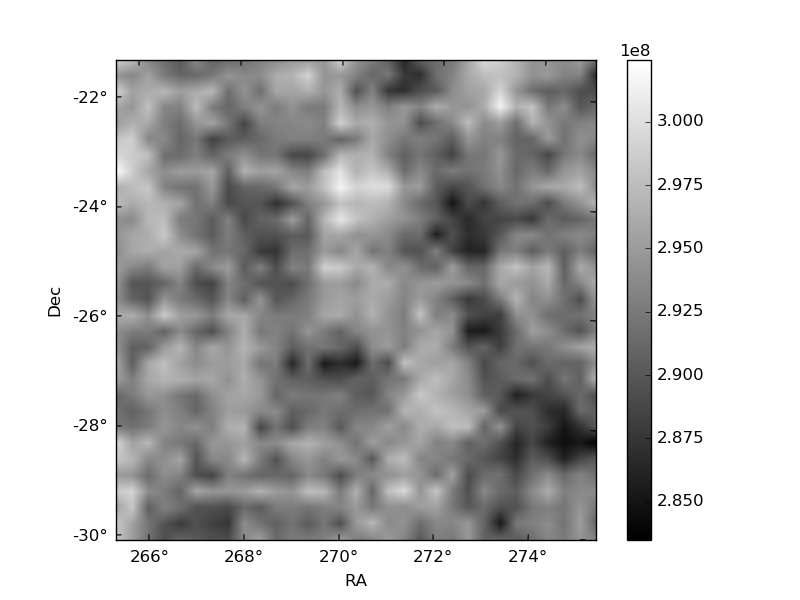
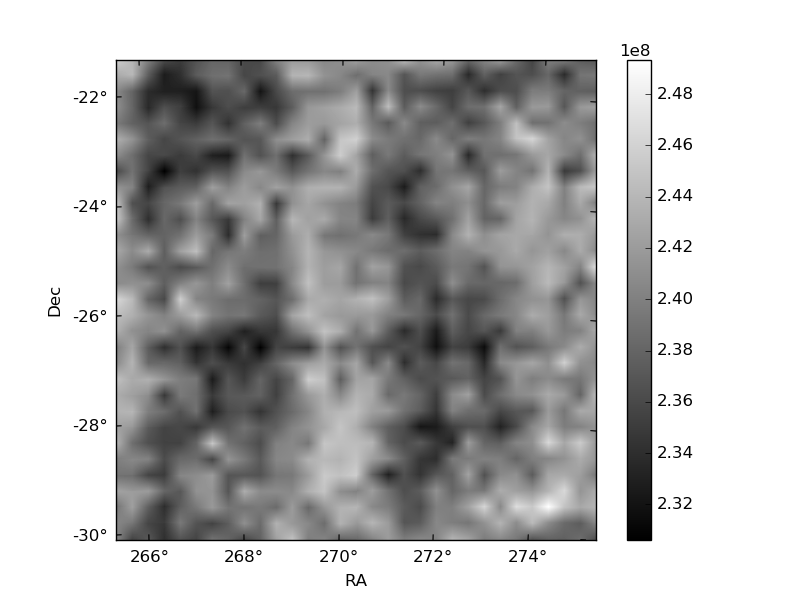
Histogram calculated using DETX and DETY for each event in the final _common_clean file
| Quadrant A | 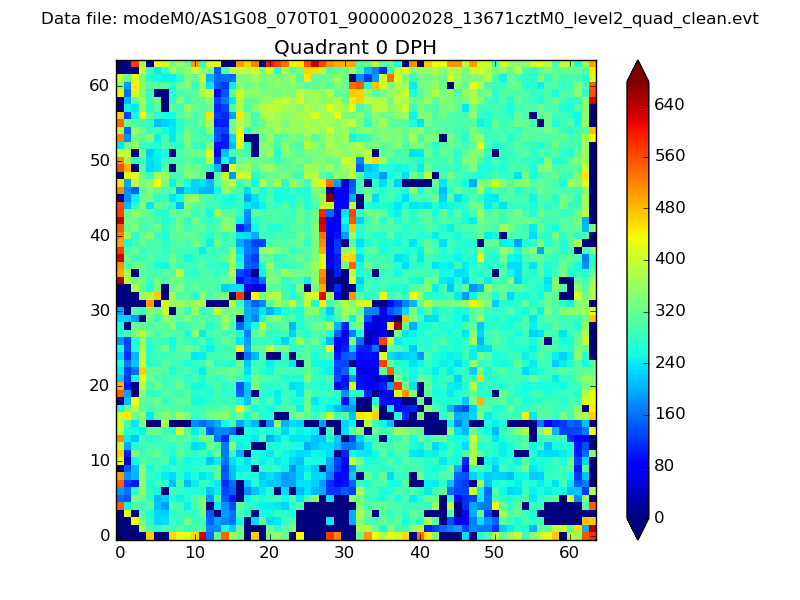 |
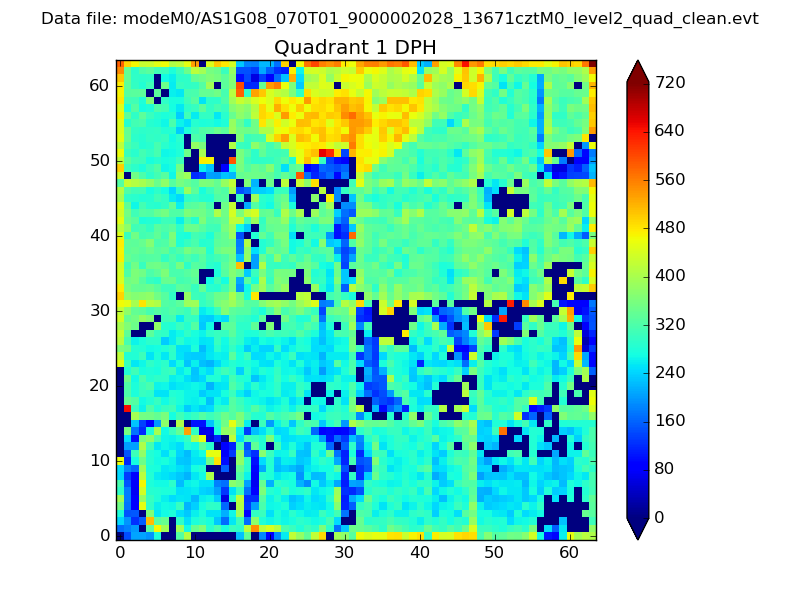 |
Quadrant B |
|---|---|---|---|
| Quadrant D | 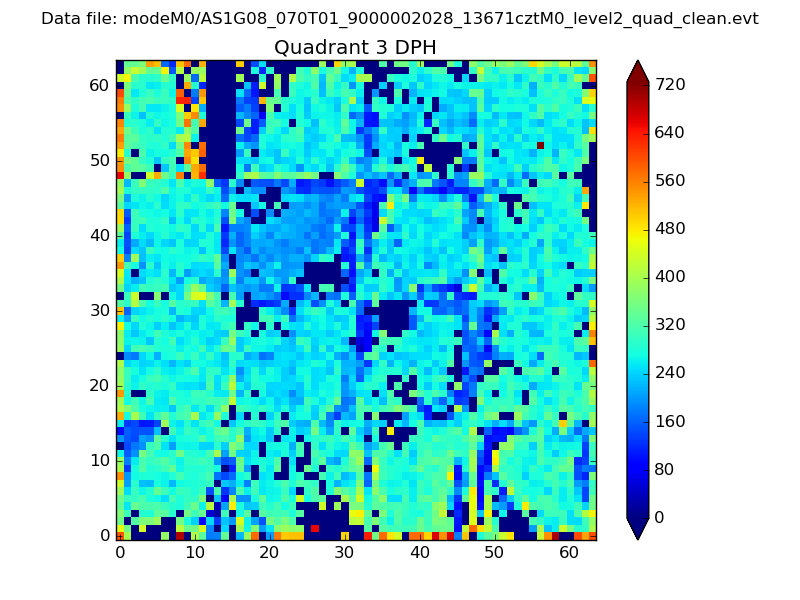 |
 |
Quadrant C |
| Plot type | Count rate plots | Images |
|---|---|---|
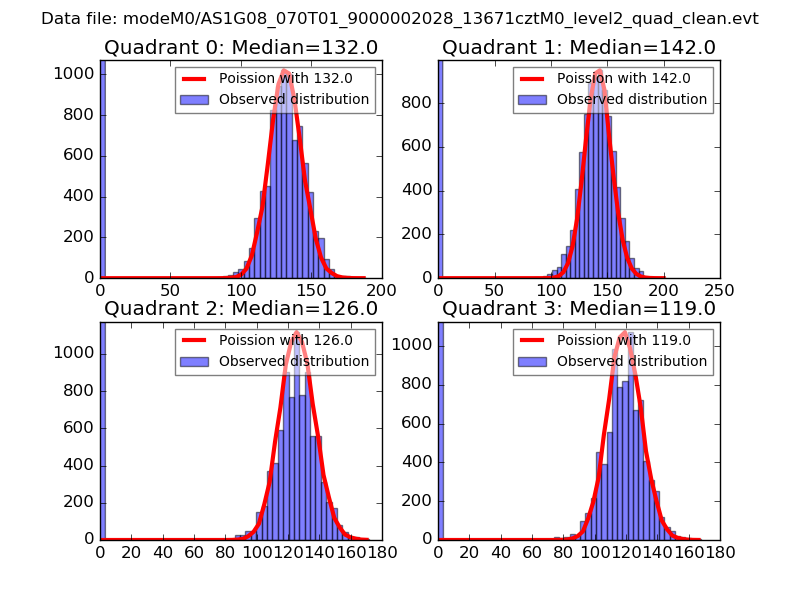
| Comparison with Poisson distribution Blue bars denote a histogram of data divided into 1 sec bins. Red curve is a Poisson curve with rate = median count rate of data. |
 |
 |
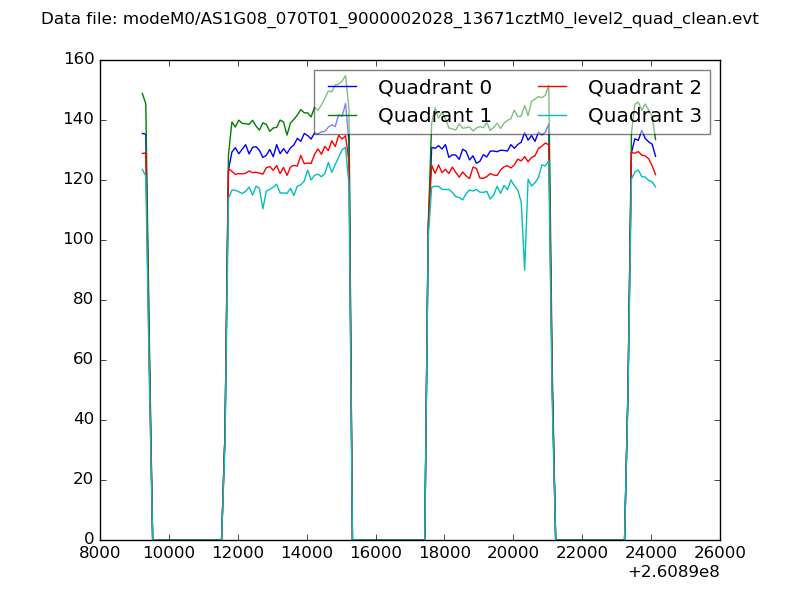
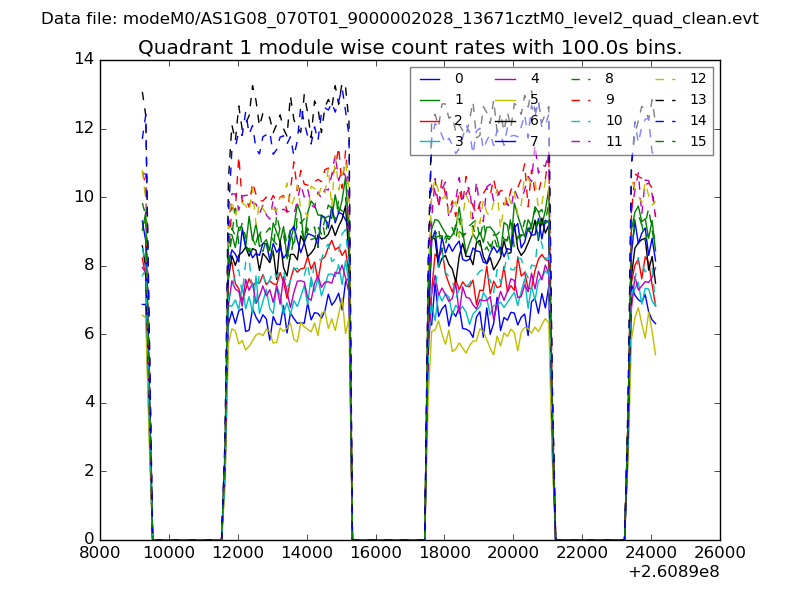
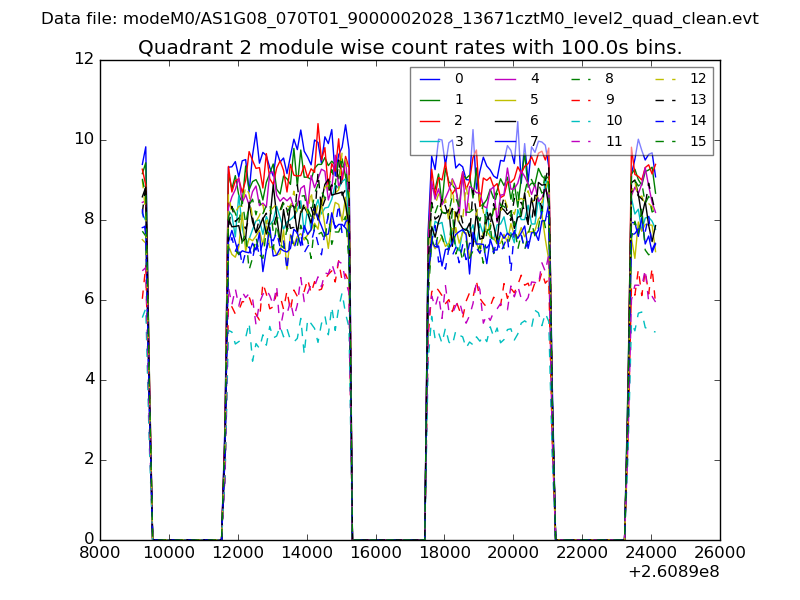
| Quadrant-wise count rates Data is divided into 100 sec bins |
 |
|
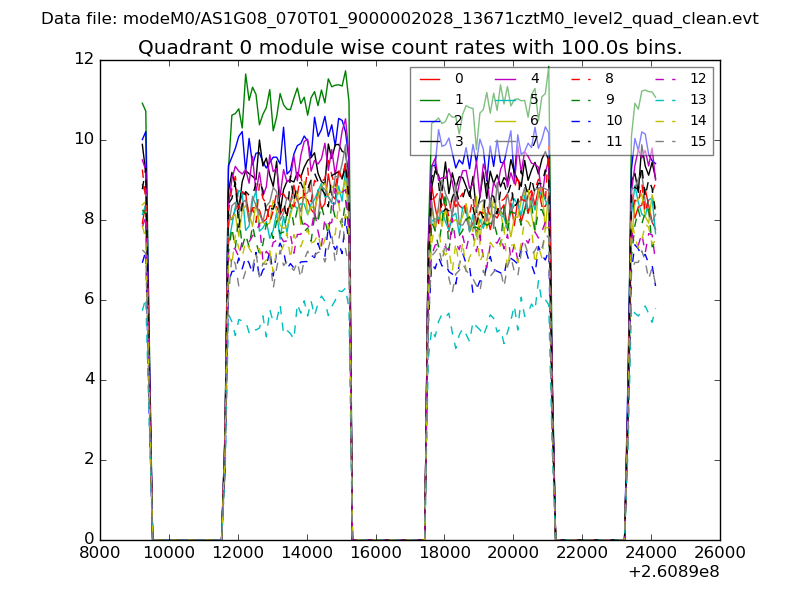
| Module-wise count rates for Quadrant A Data is divided into 100 sec bins |
 |
 |
| Module-wise count rates for Quadrant B Data is divided into 100 sec bins |
 |
 |
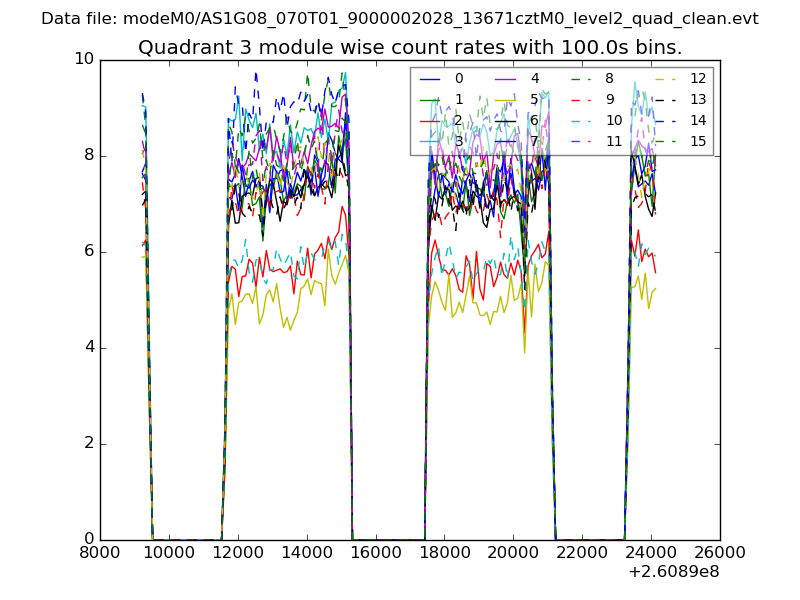
| Module-wise count rates for Quadrant C Data is divided into 100 sec bins |
 |
 |
| Module-wise count rates for Quadrant D Data is divided into 100 sec bins |
 |
 |
| Parameter | Plot |
|---|---|
| CZT HV Monitor | 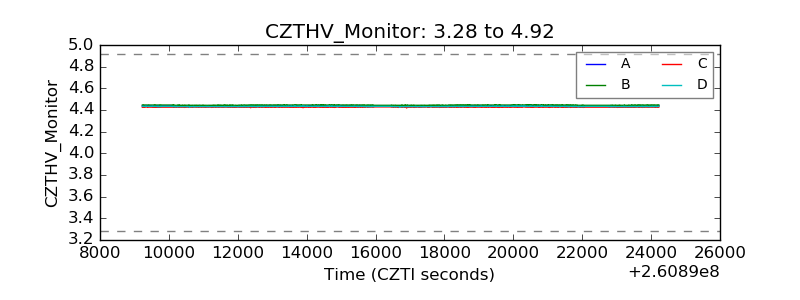 |
| D_VDD | 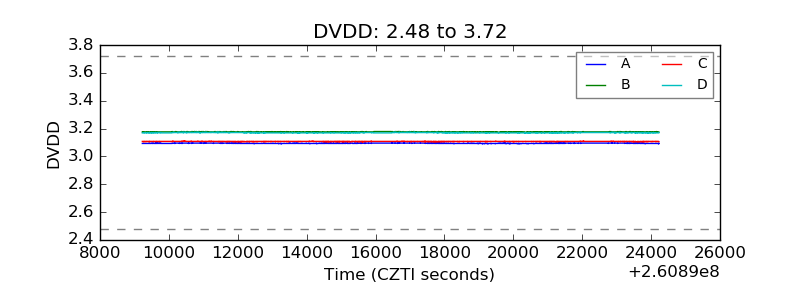 |
| Temperature 1 |  |
| Veto HV Monitor | 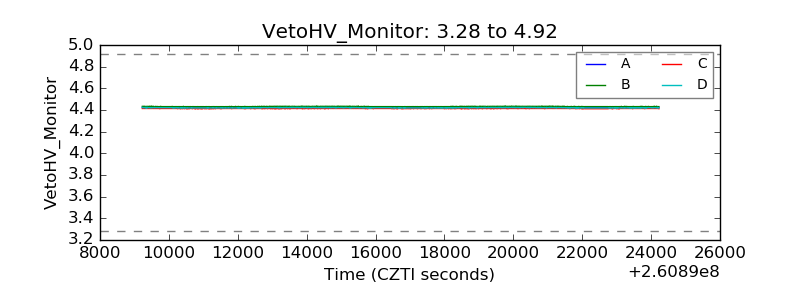 |
| Veto LLD | 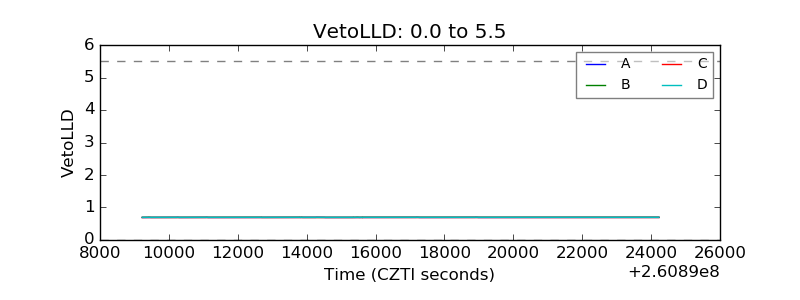 |
| Alpha Counter | 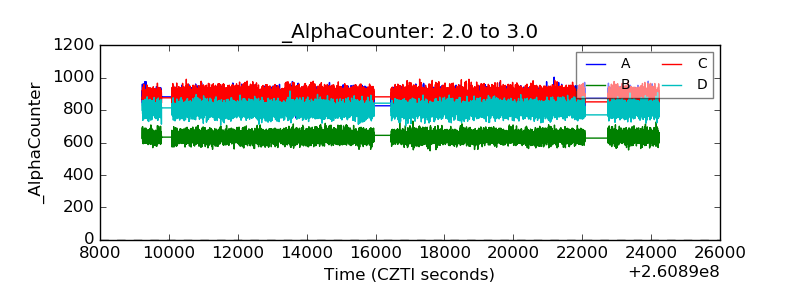 |
| _CPM_Rate | 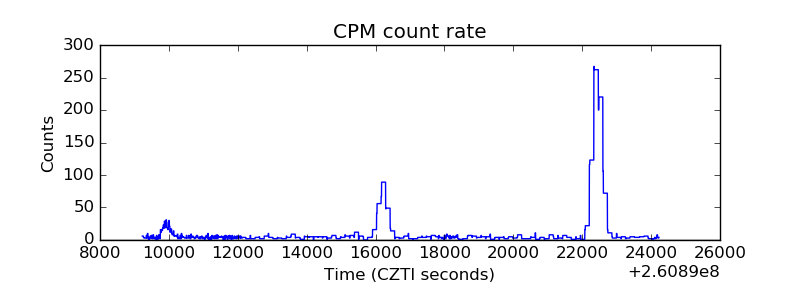 |
| CZT Counter | 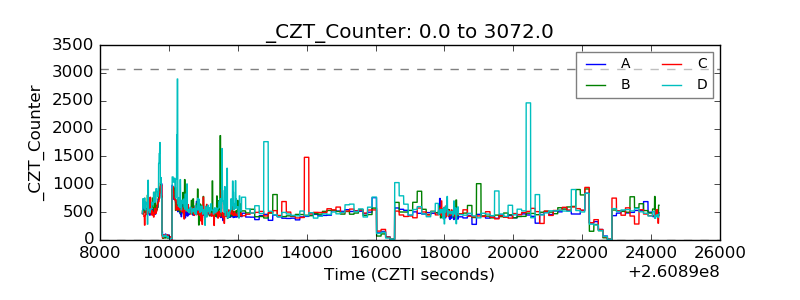 |
| +2.5 Volts monitor |  |
| +5 Volts monitor |  |
| _ROLL_ROT | 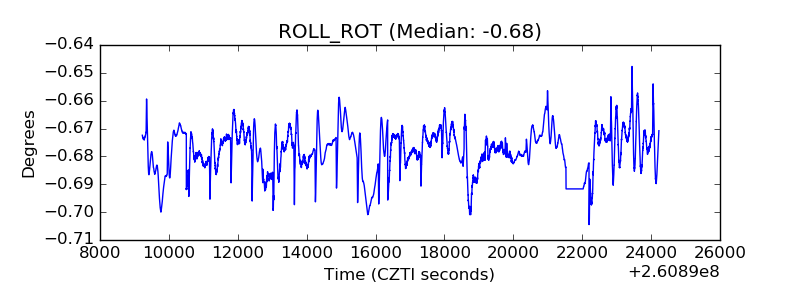 |
| _Roll_DEC |  |
| _Roll_RA | 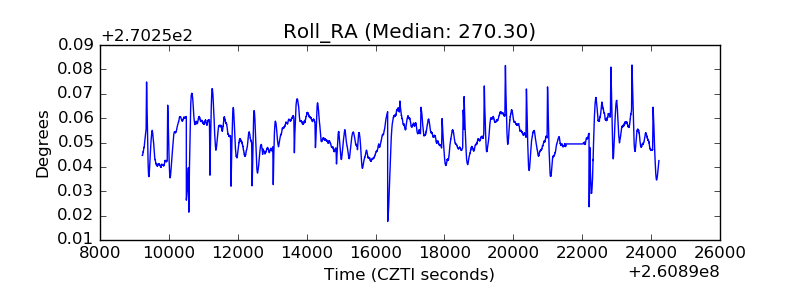 |
| Veto Counter | 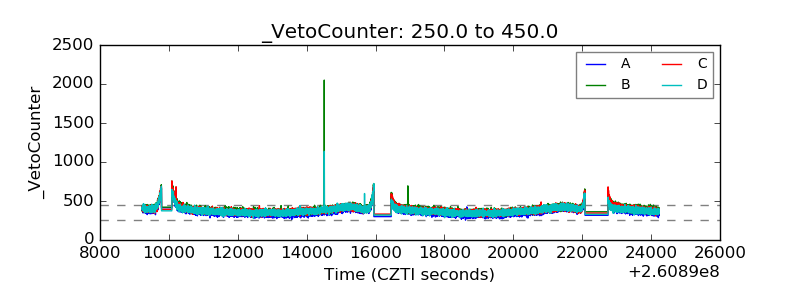 |