| Param | Original file | Final file |
|---|---|---|
| Filename | modeM0/AS1G08_070T01_9000002028_13672cztM0_level2.evt | modeM0/AS1G08_070T01_9000002028_13672cztM0_level2_quad_clean.evt |
| Size (bytes) | 530,844,480 | 97,692,480 |
| Size | 506.3 MB | 93.2 MB |
| Events in quadrant A | 3,227,931 | 635,524 |
| Events in quadrant B | 3,599,603 | 681,930 |
| Events in quadrant C | 3,441,527 | 606,825 |
| Events in quadrant D | 5,345,504 | 559,495 |
| Mode SS | |||
|---|---|---|---|
| Quadrant | BADHDUFLAG | Total packets | Discarded packets |
| A | 0 | 140 | 0 |
| B | 0 | 140 | 0 |
| C | 0 | 140 | 0 |
| D | 0 | 140 | 0 |
| Mode M9 | |||
|---|---|---|---|
| Quadrant | BADHDUFLAG | Total packets | Discarded packets |
| A | 0 | 8 | 0 |
| B | 0 | 8 | 0 |
| C | 0 | 8 | 0 |
| D | 0 | 8 | 0 |
| Mode M0 | |||
|---|---|---|---|
| Quadrant | BADHDUFLAG | Total packets | Discarded packets |
| A | 0 | 13900 | 3 |
| B | 0 | 14934 | 2 |
| C | 0 | 14290 | 2 |
| D | 0 | 20607 | 2 |
| Quadrant | Total seconds | Saturated seconds | Saturation percentage |
|---|---|---|---|
| A | 6804 | 40 | 0.587889% |
| B | 6804 | 64 | 0.940623% |
| C | 6804 | 34 | 0.499706% |
| D | 6804 | 626 | 9.200470% |
Noise dominated data is calculated using 1-second bins in cleaned event files. If a bin has >2000 counts, and if more than 50% of those come from <1% of pixels, then it is considered to be noise-dominated and hence unusable.
| Quadrant | # 1 sec bins | Bins with >0 counts | Bins with >2000 counts | High rate bins dominated by noise | Noise dominated (total time) | Noise dominated (detector-on time) | Marked lightcurve |
|---|---|---|---|---|---|---|---|
| A | 7640 | 6806 | 0 | 0 | 0.00% | 0.00% | 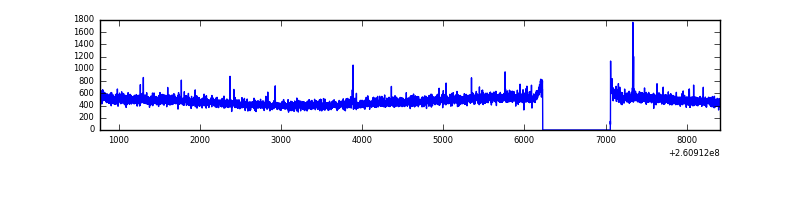 |
| B | 7640 | 6806 | 10 | 10 | 0.13% | 0.15% | 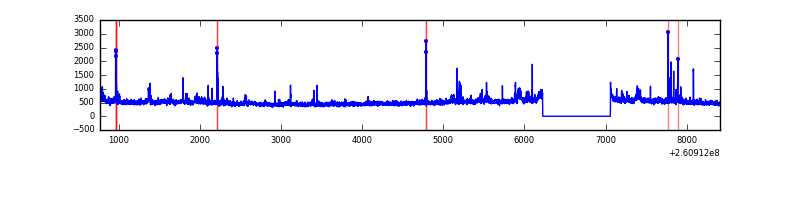 |
| C | 7640 | 6806 | 5 | 5 | 0.07% | 0.07% | 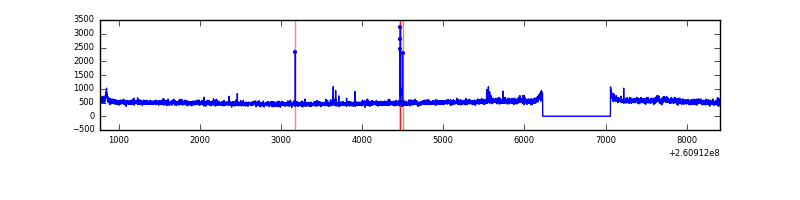 |
| D | 7640 | 6806 | 586 | 586 | 7.67% | 8.61% | 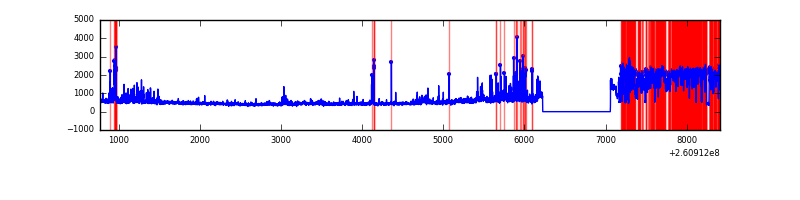 |
Top three noisy pixels from each quadrant. If the there are fewer than three noisy pixels in the level2.evt file, extra rows are filled as -1
| Pixel properties | Quadrant properties | ||||||
|---|---|---|---|---|---|---|---|
| Quadrant | DetID | PixID | Counts | Sigma | Mean | Median | Sigma |
| A | 9 | 143 | 11296 | 61.16 | 832 | 816 | 171.4 |
| A | 1 | 162 | 9553 | 50.99 | 832 | 816 | 171.4 |
| A | 0 | 226 | 7220 | 37.37 | 832 | 816 | 171.4 |
| B | 0 | 219 | 167325 | 1026.95 | 848 | 831 | 162.1 |
| B | 0 | 182 | 45715 | 276.85 | 848 | 831 | 162.1 |
| B | 0 | 214 | 30810 | 184.91 | 848 | 831 | 162.1 |
| C | 3 | 233 | 271698 | 1444.64 | 804 | 807 | 187.5 |
| C | 14 | 234 | 15512 | 78.42 | 804 | 807 | 187.5 |
| C | 14 | 220 | 15224 | 76.88 | 804 | 807 | 187.5 |
| D | 13 | 122 | 1764090 | 9286.48 | 780 | 760 | 189.9 |
| D | 5 | 222 | 341031 | 1792.02 | 780 | 760 | 189.9 |
| D | 1 | 52 | 148395 | 777.51 | 780 | 760 | 189.9 |
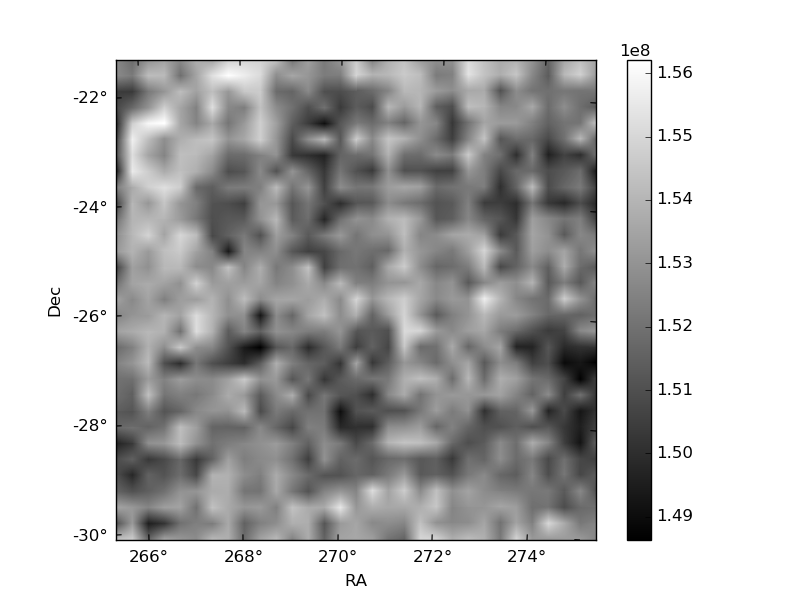
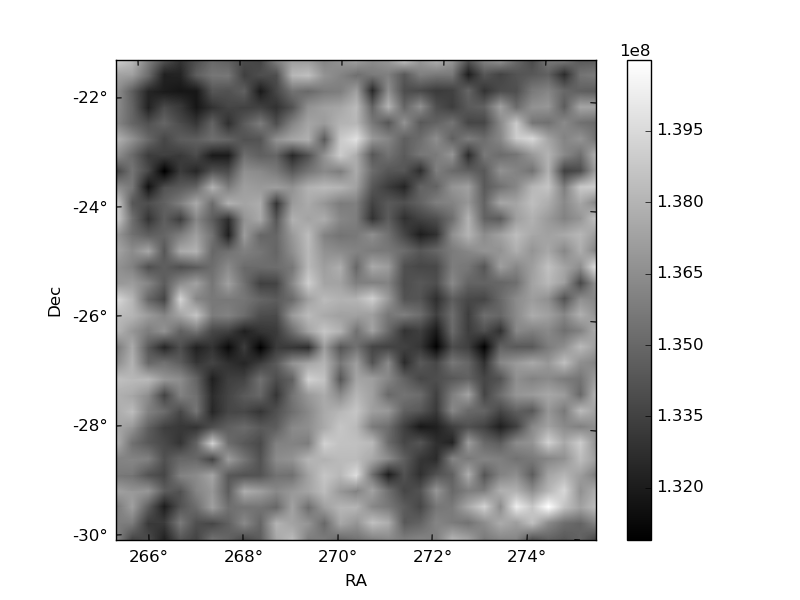
Histogram calculated using DETX and DETY for each event in the final _common_clean file
| Quadrant A | 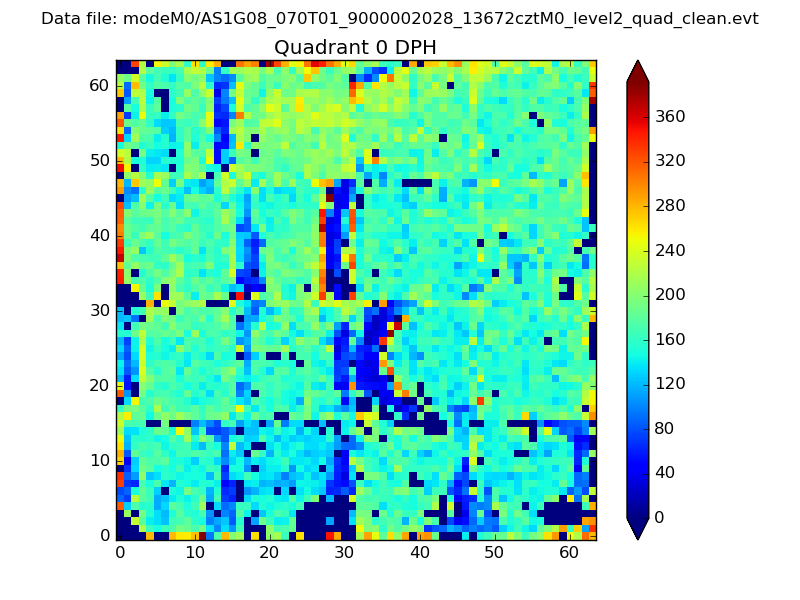 |
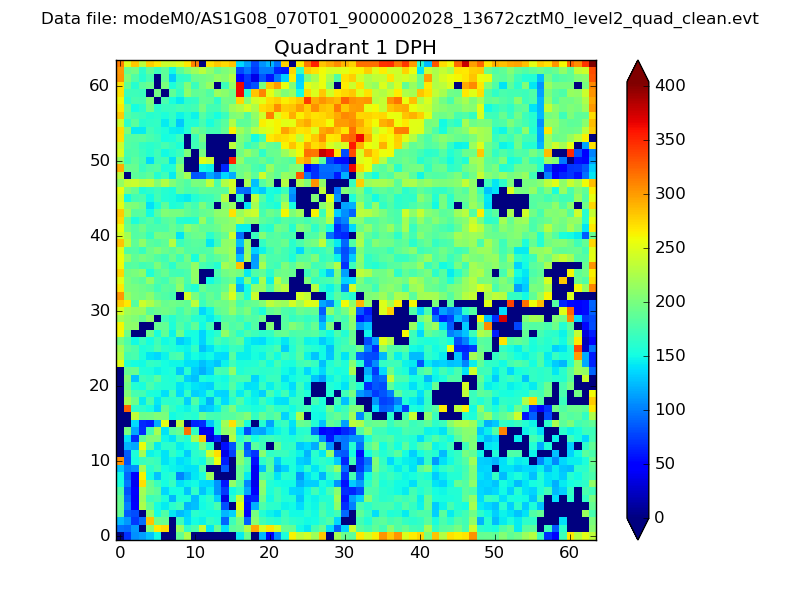 |
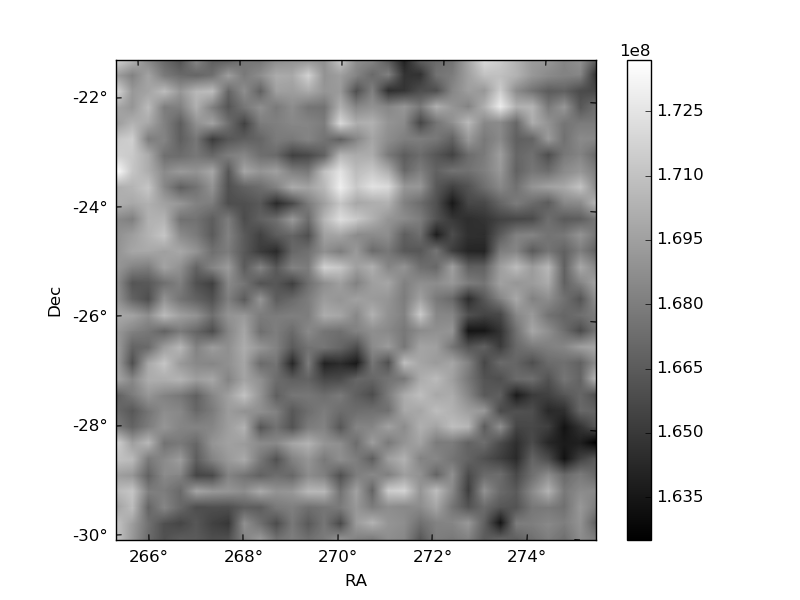
Quadrant B |
|---|---|---|---|
| Quadrant D |  |
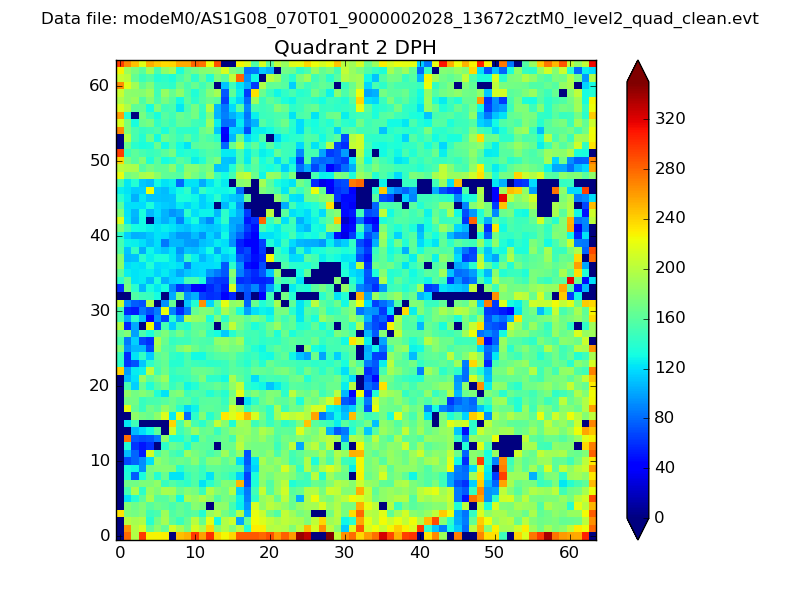 |
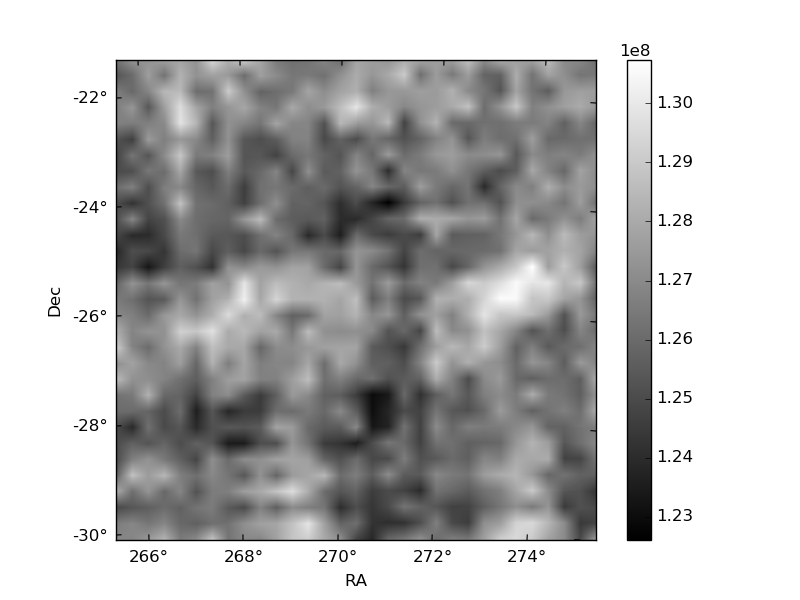
Quadrant C |
| Plot type | Count rate plots | Images |
|---|---|---|
| Comparison with Poisson distribution Blue bars denote a histogram of data divided into 1 sec bins. Red curve is a Poisson curve with rate = median count rate of data. |
 |
 |
| Quadrant-wise count rates Data is divided into 100 sec bins |
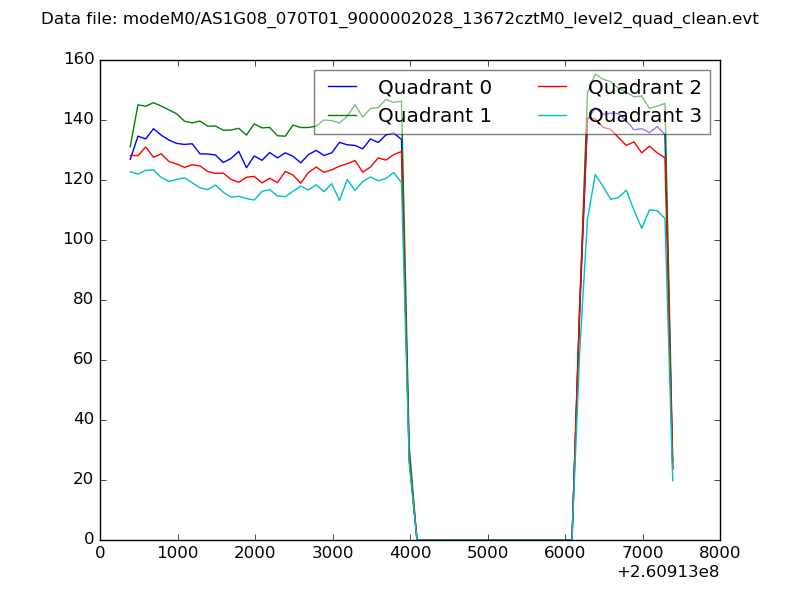 |
|
| Module-wise count rates for Quadrant A Data is divided into 100 sec bins |
 |
 |
| Module-wise count rates for Quadrant B Data is divided into 100 sec bins |
 |
 |
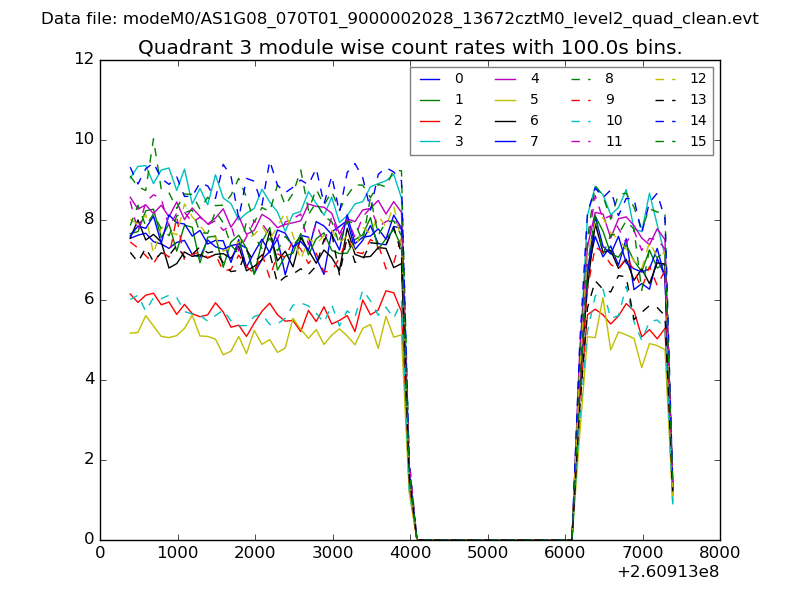
| Module-wise count rates for Quadrant C Data is divided into 100 sec bins |
 |
 |
| Module-wise count rates for Quadrant D Data is divided into 100 sec bins |
 |
 |
| Parameter | Plot |
|---|---|
| CZT HV Monitor |  |
| D_VDD | 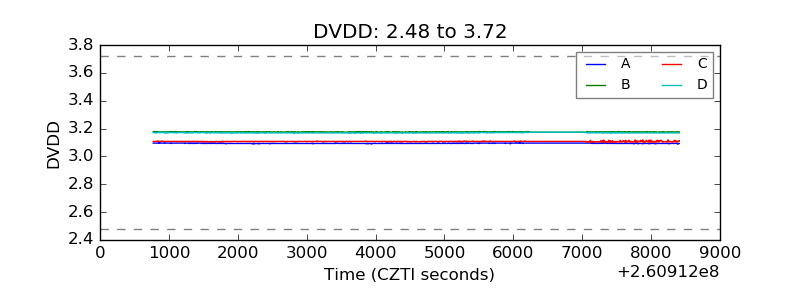 |
| Temperature 1 | 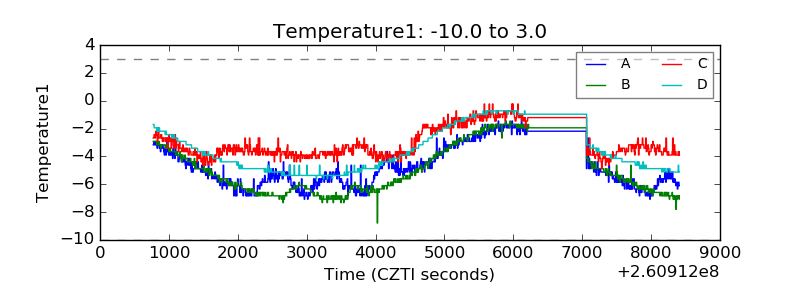 |
| Veto HV Monitor | 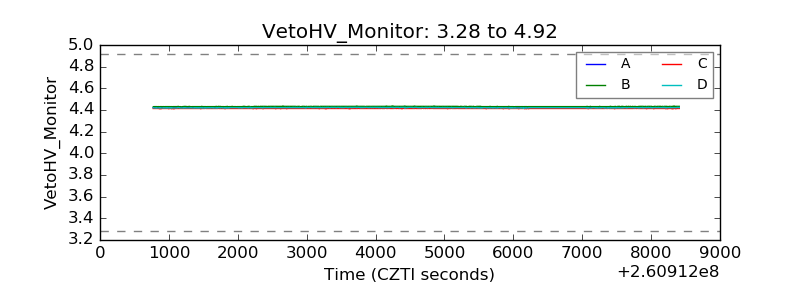 |
| Veto LLD | 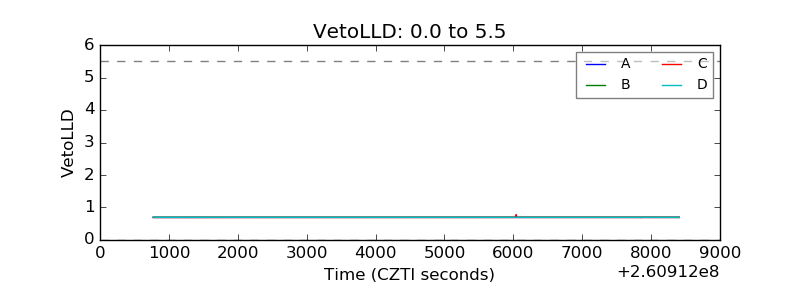 |
| Alpha Counter | 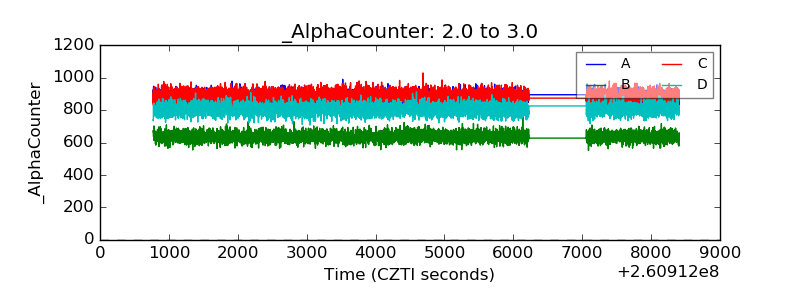 |
| _CPM_Rate | 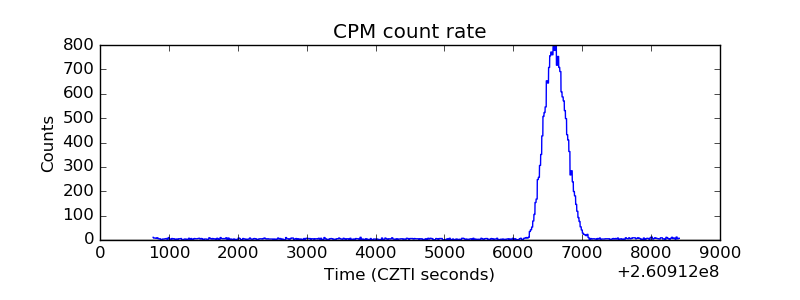 |
| CZT Counter |  |
| +2.5 Volts monitor |  |
| +5 Volts monitor | 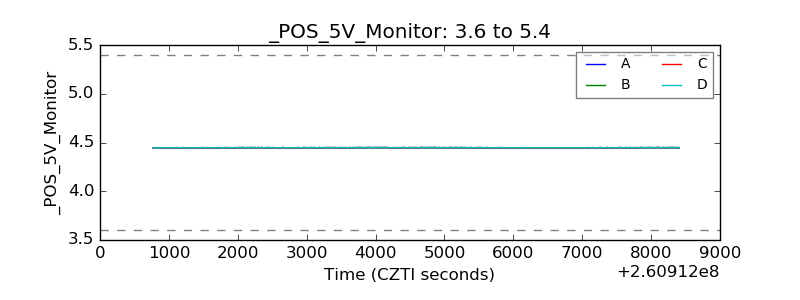 |
| _ROLL_ROT |  |
| _Roll_DEC |  |
| _Roll_RA | 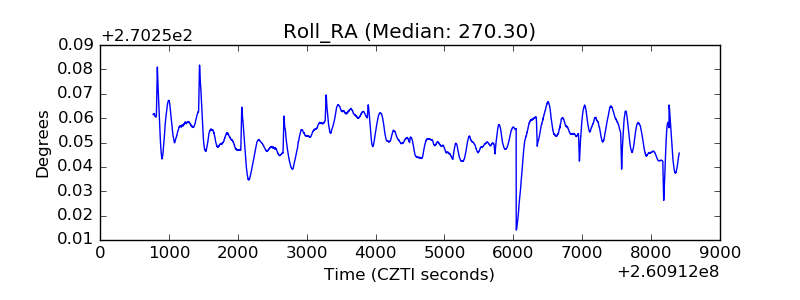 |
| Veto Counter |  |