| Param | Original file | Final file |
|---|---|---|
| Filename | modeM0/AS1G08_070T01_9000002028_13675cztM0_level2.evt | modeM0/AS1G08_070T01_9000002028_13675cztM0_level2_quad_clean.evt |
| Size (bytes) | 473,114,880 | 102,775,680 |
| Size | 451.2 MB | 98.0 MB |
| Events in quadrant A | 3,314,160 | 669,589 |
| Events in quadrant B | 3,501,841 | 724,551 |
| Events in quadrant C | 3,414,615 | 651,188 |
| Events in quadrant D | 3,651,371 | 608,862 |
| Mode SS | |||
|---|---|---|---|
| Quadrant | BADHDUFLAG | Total packets | Discarded packets |
| A | 0 | 134 | 0 |
| B | 0 | 134 | 0 |
| C | 0 | 134 | 0 |
| D | 0 | 134 | 0 |
| Mode M9 | |||
|---|---|---|---|
| Quadrant | BADHDUFLAG | Total packets | Discarded packets |
| A | 0 | 22 | 0 |
| B | 0 | 22 | 0 |
| C | 0 | 22 | 0 |
| D | 0 | 22 | 0 |
| Mode M0 | |||
|---|---|---|---|
| Quadrant | BADHDUFLAG | Total packets | Discarded packets |
| A | 0 | 14014 | 3 |
| B | 0 | 14495 | 2 |
| C | 0 | 14062 | 2 |
| D | 0 | 15167 | 2 |
| Quadrant | Total seconds | Saturated seconds | Saturation percentage |
|---|---|---|---|
| A | 6579 | 71 | 1.079191% |
| B | 6579 | 70 | 1.063991% |
| C | 6579 | 15 | 0.227998% |
| D | 6579 | 43 | 0.653595% |
Noise dominated data is calculated using 1-second bins in cleaned event files. If a bin has >2000 counts, and if more than 50% of those come from <1% of pixels, then it is considered to be noise-dominated and hence unusable.
| Quadrant | # 1 sec bins | Bins with >0 counts | Bins with >2000 counts | High rate bins dominated by noise | Noise dominated (total time) | Noise dominated (detector-on time) | Marked lightcurve |
|---|---|---|---|---|---|---|---|
| A | 8740 | 6582 | 33 | 33 | 0.38% | 0.50% | 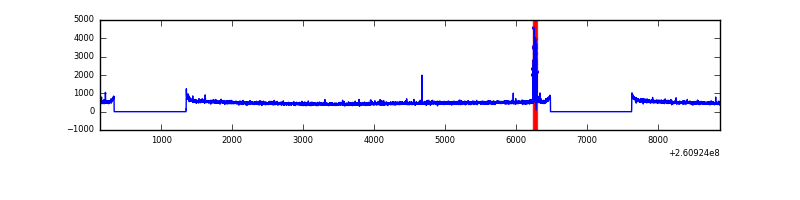 |
| B | 8740 | 6582 | 9 | 9 | 0.10% | 0.14% | 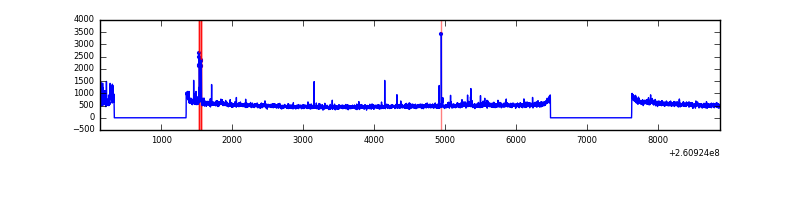 |
| C | 8740 | 6582 | 0 | 0 | 0.00% | 0.00% | 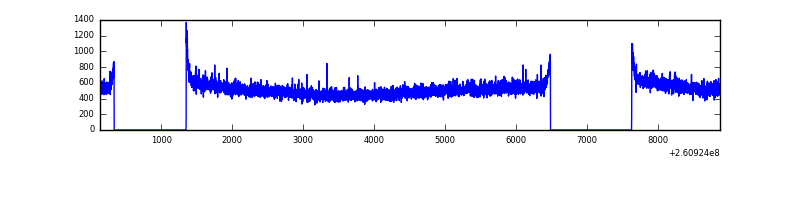 |
| D | 8740 | 6582 | 12 | 12 | 0.14% | 0.18% | 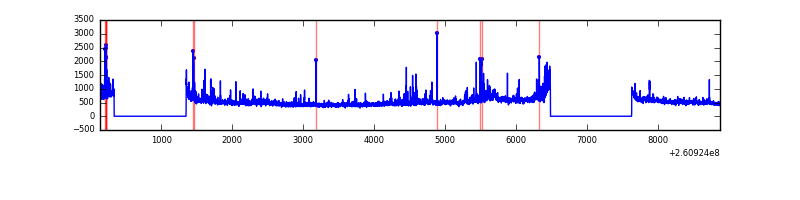 |
Top three noisy pixels from each quadrant. If the there are fewer than three noisy pixels in the level2.evt file, extra rows are filled as -1
| Pixel properties | Quadrant properties | ||||||
|---|---|---|---|---|---|---|---|
| Quadrant | DetID | PixID | Counts | Sigma | Mean | Median | Sigma |
| A | 15 | 69 | 114879 | 676.29 | 829 | 814 | 168.7 |
| A | 9 | 143 | 8377 | 44.84 | 829 | 814 | 168.7 |
| A | 0 | 226 | 7354 | 38.78 | 829 | 814 | 168.7 |
| B | 0 | 219 | 104279 | 640.7 | 852 | 836 | 161.5 |
| B | 0 | 182 | 30359 | 182.86 | 852 | 836 | 161.5 |
| B | 12 | 111 | 17983 | 106.2 | 852 | 836 | 161.5 |
| C | 3 | 233 | 241844 | 1274.13 | 814 | 820 | 189.2 |
| C | 13 | 61 | 5810 | 26.38 | 814 | 820 | 189.2 |
| C | 3 | 202 | 1922 | 5.83 | 814 | 820 | 189.2 |
| D | 8 | 195 | 215634 | 1109.99 | 800 | 778 | 193.6 |
| D | 5 | 222 | 147188 | 756.39 | 800 | 778 | 193.6 |
| D | 1 | 52 | 95310 | 488.37 | 800 | 778 | 193.6 |
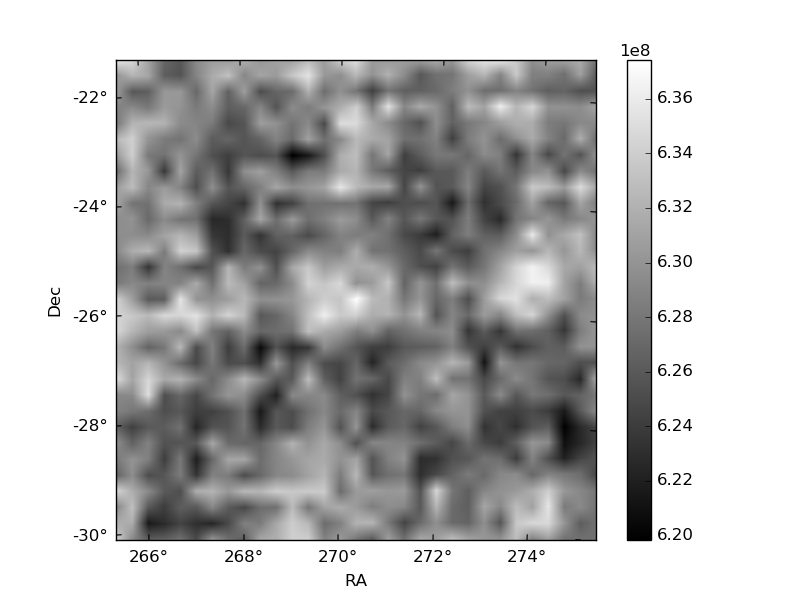
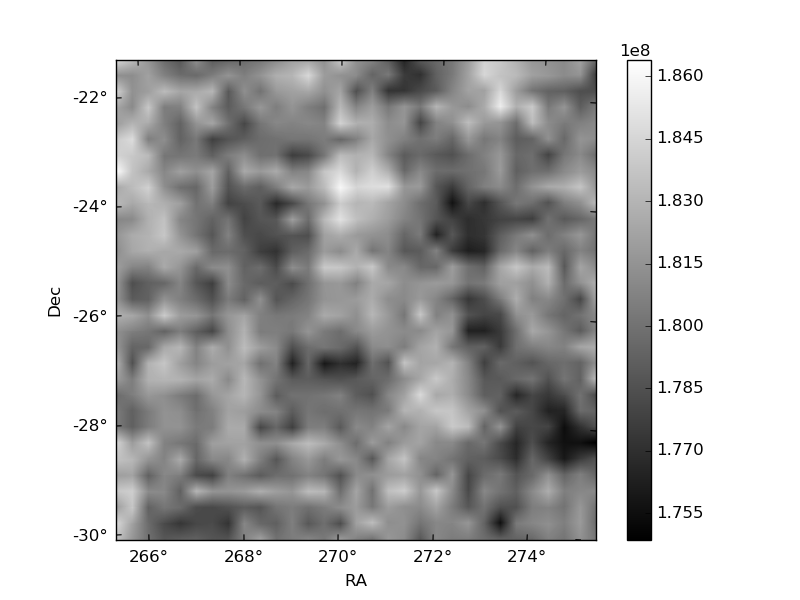
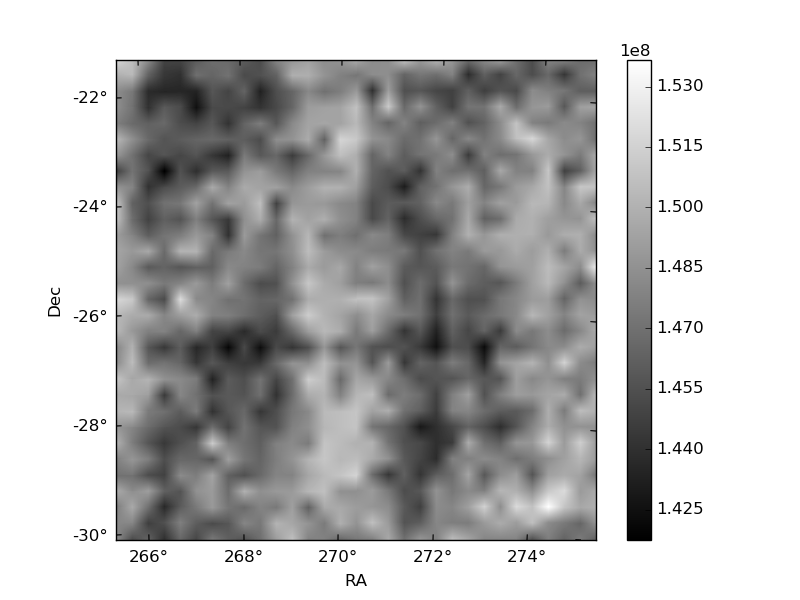
Histogram calculated using DETX and DETY for each event in the final _common_clean file
| Quadrant A | 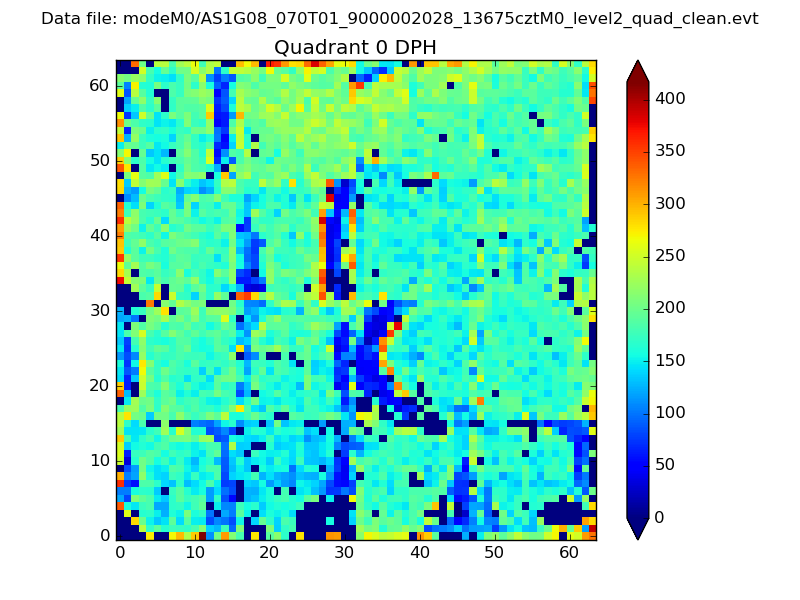 |
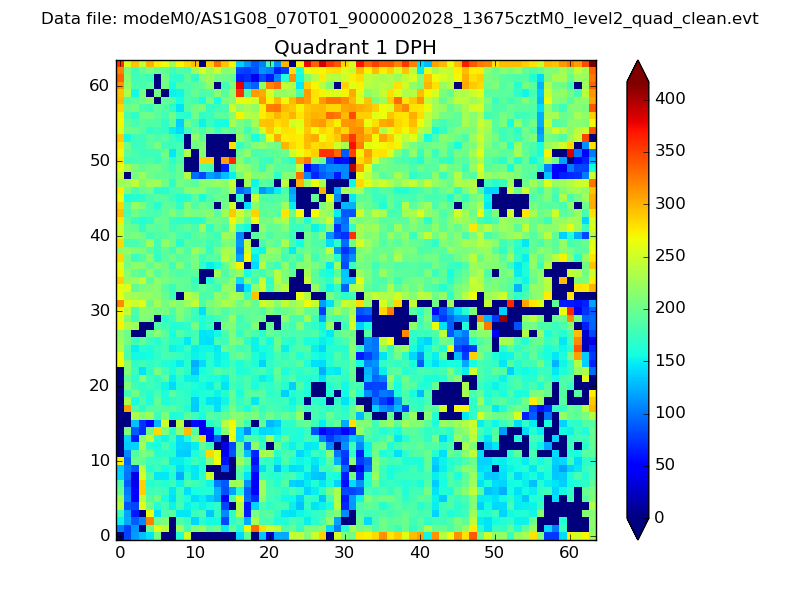 |
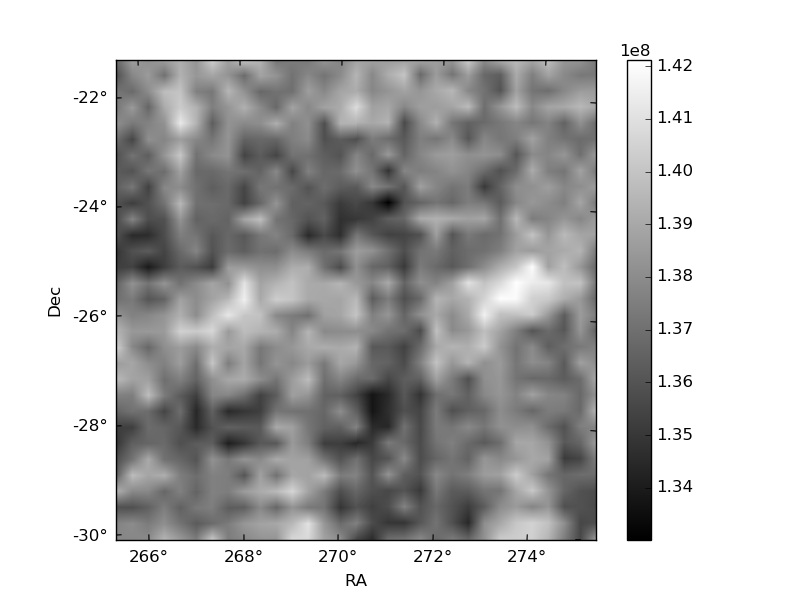
Quadrant B |
|---|---|---|---|
| Quadrant D | 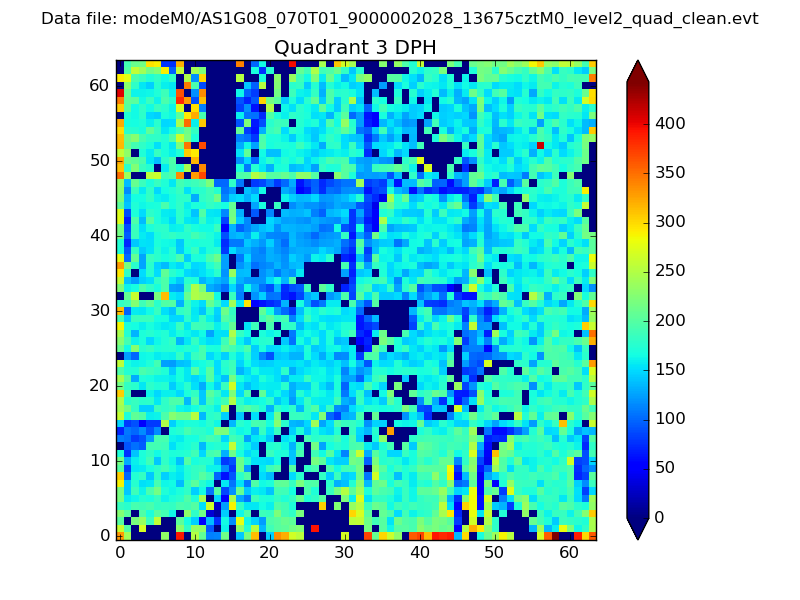 |
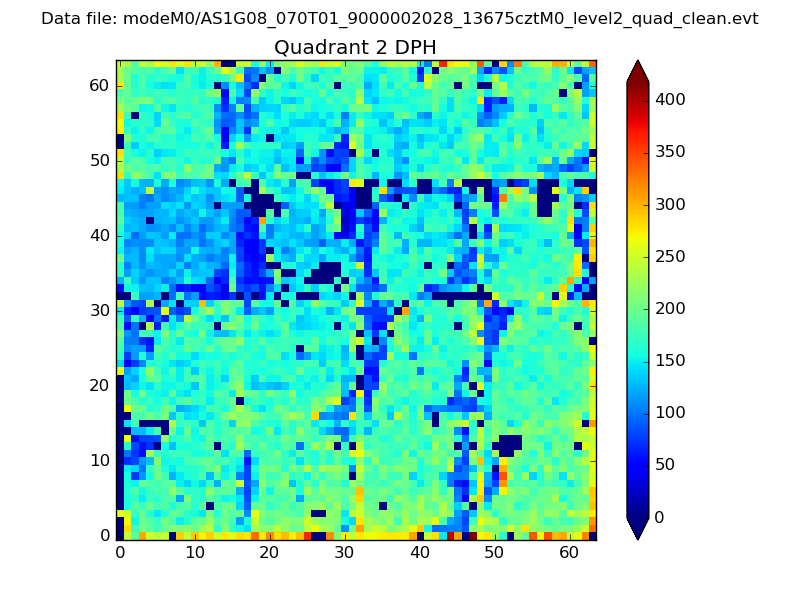 |
Quadrant C |
| Plot type | Count rate plots | Images |
|---|---|---|
| Comparison with Poisson distribution Blue bars denote a histogram of data divided into 1 sec bins. Red curve is a Poisson curve with rate = median count rate of data. |
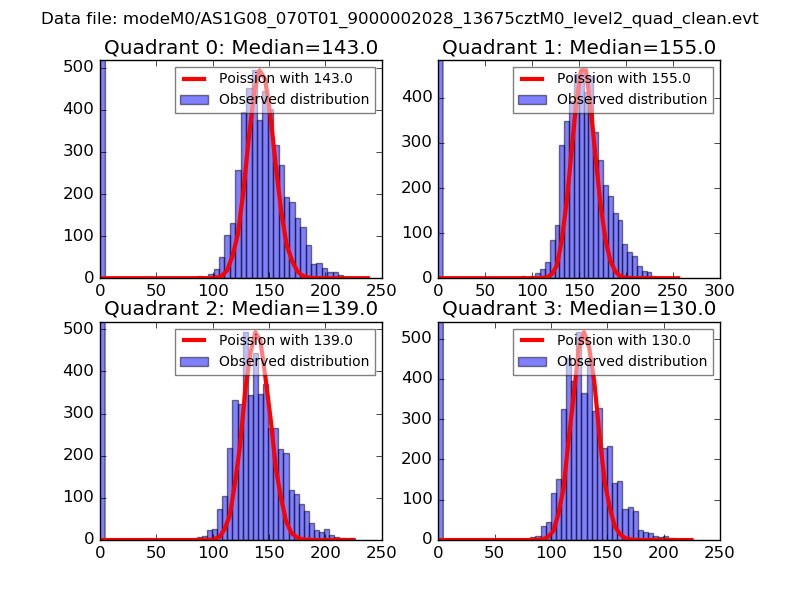 |
 |
| Quadrant-wise count rates Data is divided into 100 sec bins |
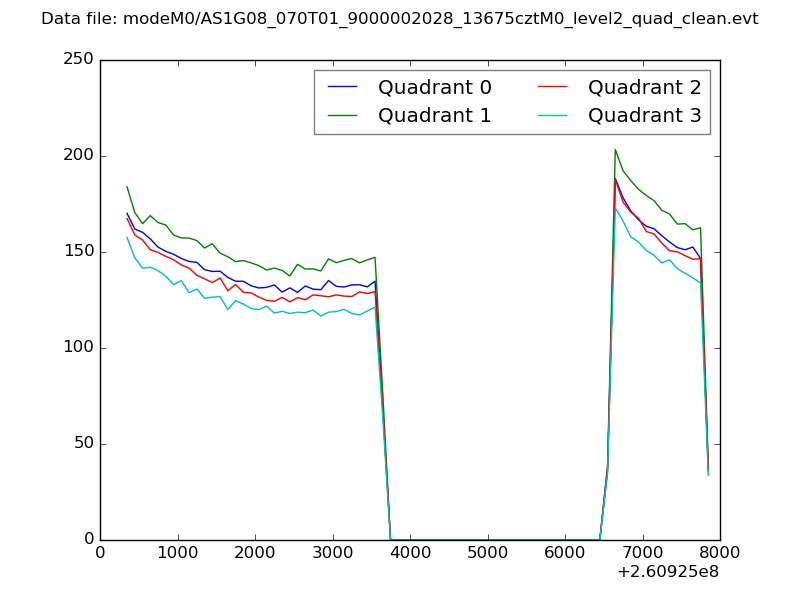 |
|
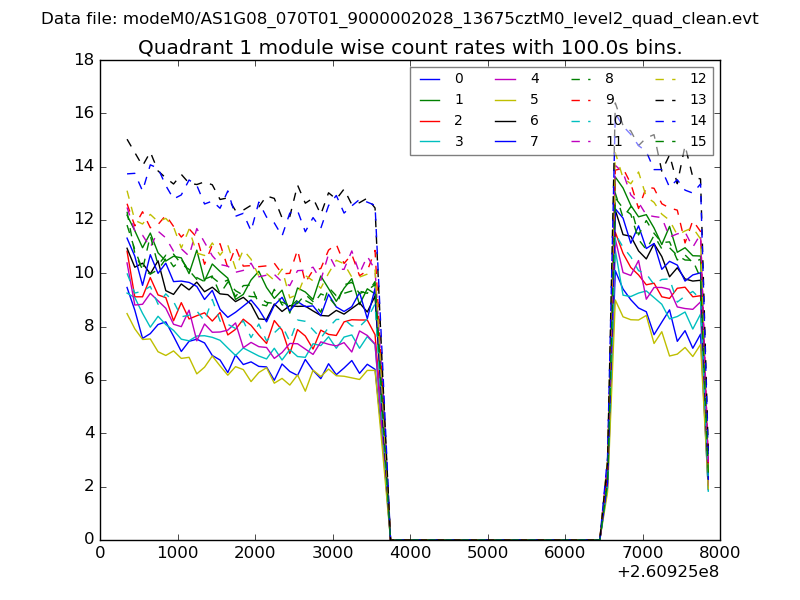
| Module-wise count rates for Quadrant A Data is divided into 100 sec bins |
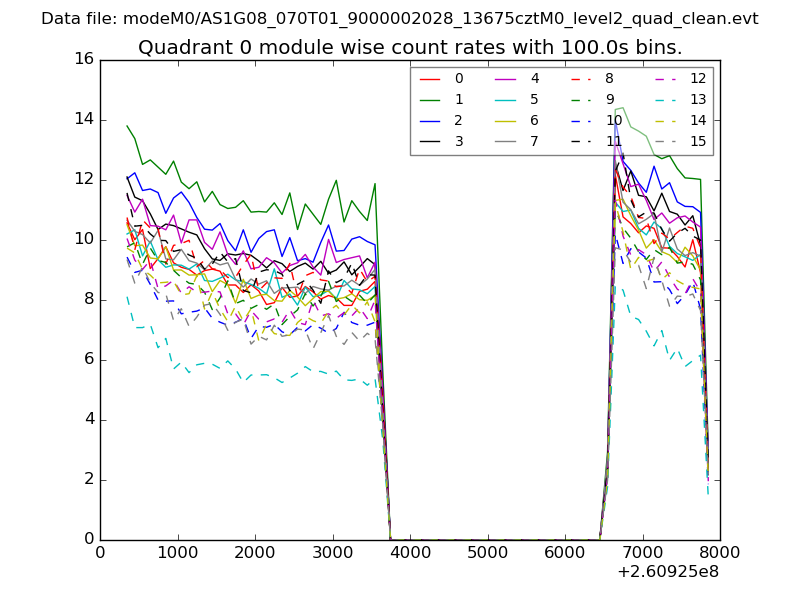 |
 |
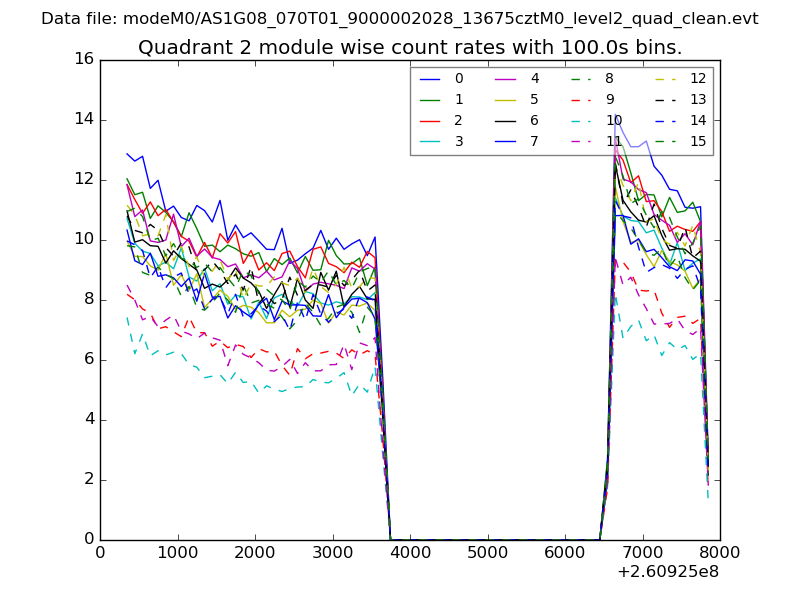
| Module-wise count rates for Quadrant B Data is divided into 100 sec bins |
 |
 |
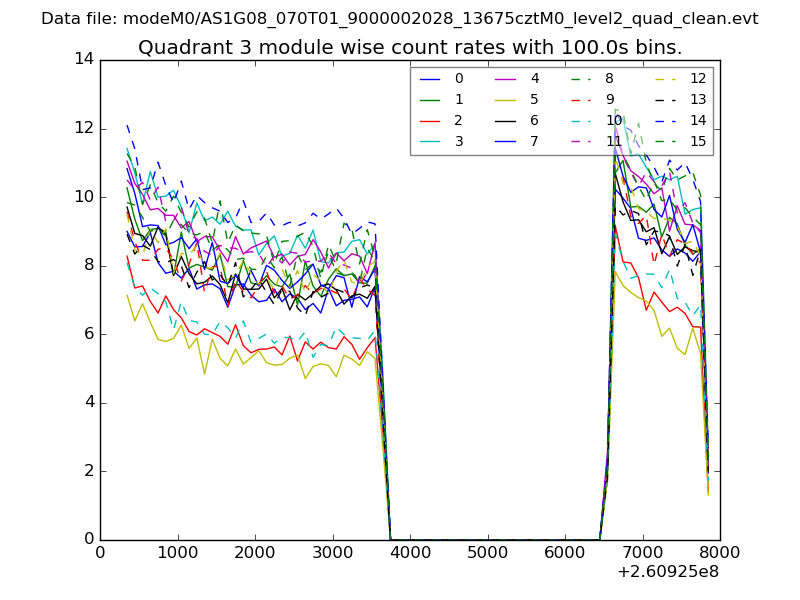
| Module-wise count rates for Quadrant C Data is divided into 100 sec bins |
 |
 |
| Module-wise count rates for Quadrant D Data is divided into 100 sec bins |
 |
 |
| Parameter | Plot |
|---|---|
| CZT HV Monitor | 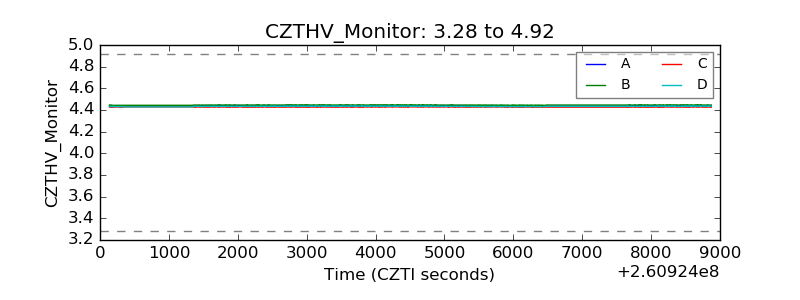 |
| D_VDD | 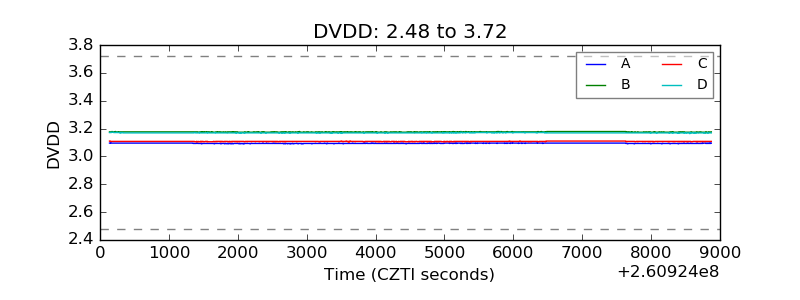 |
| Temperature 1 |  |
| Veto HV Monitor | 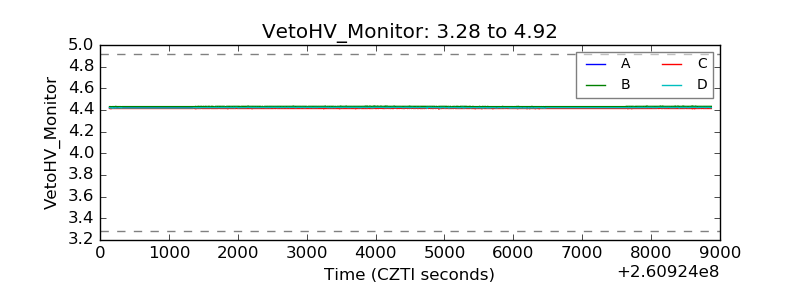 |
| Veto LLD | 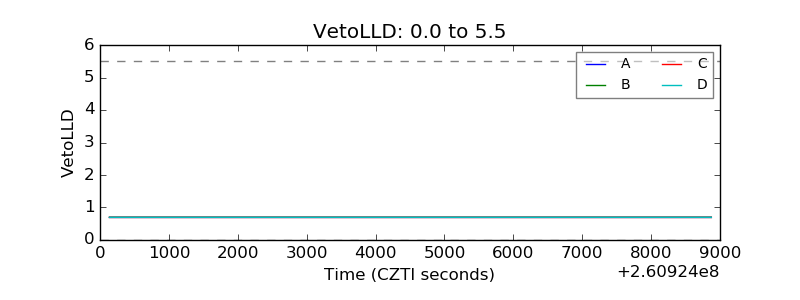 |
| Alpha Counter | 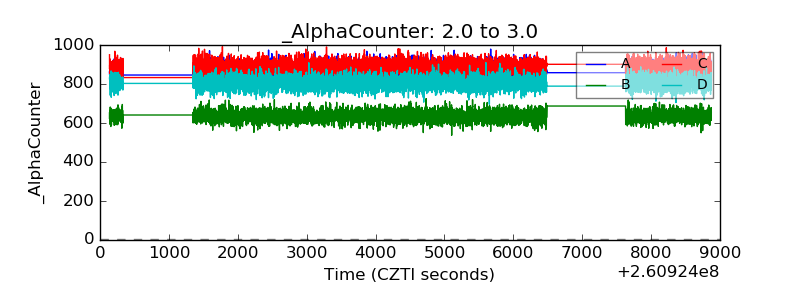 |
| _CPM_Rate | 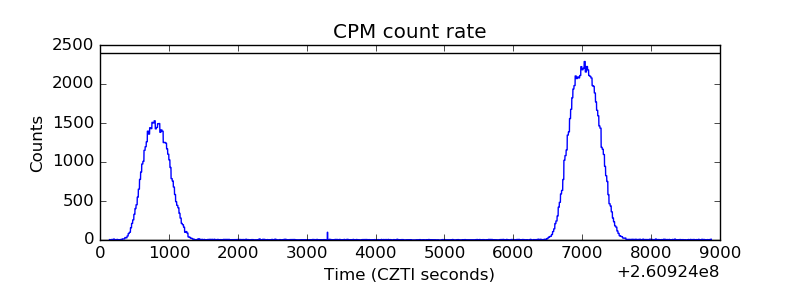 |
| CZT Counter | 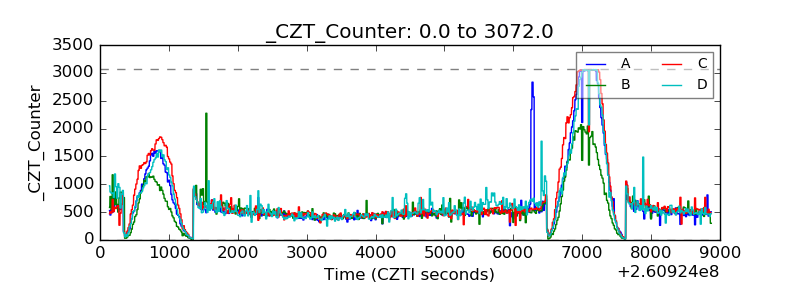 |
| +2.5 Volts monitor |  |
| +5 Volts monitor |  |
| _ROLL_ROT | 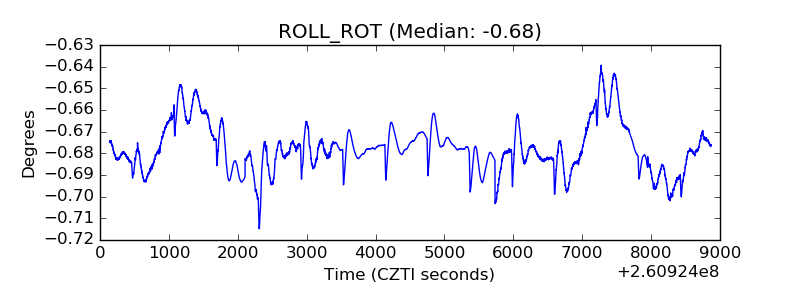 |
| _Roll_DEC | 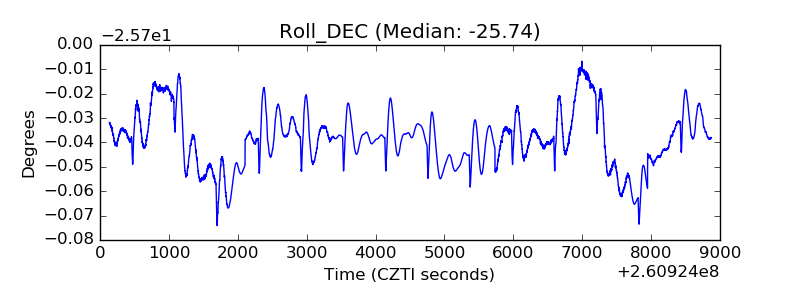 |
| _Roll_RA | 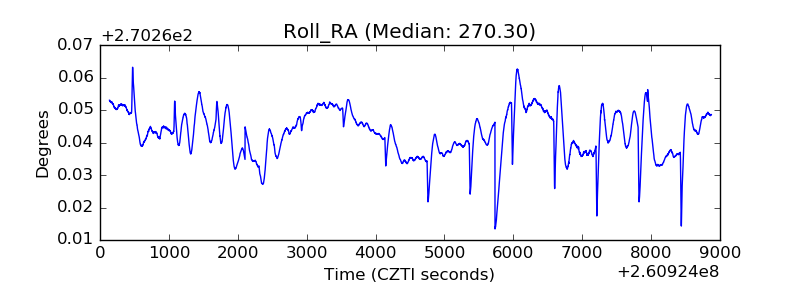 |
| Veto Counter | 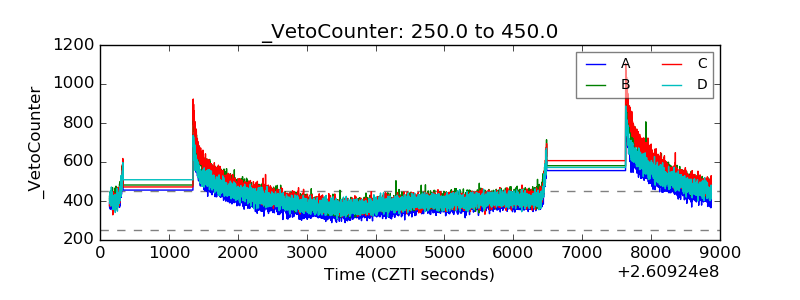 |