| Param | Original file | Final file |
|---|---|---|
| Filename | modeM0/AS1G08_070T01_9000002028_13676cztM0_level2.evt | modeM0/AS1G08_070T01_9000002028_13676cztM0_level2_quad_clean.evt |
| Size (bytes) | 481,158,720 | 107,631,360 |
| Size | 458.9 MB | 102.6 MB |
| Events in quadrant A | 3,322,499 | 706,236 |
| Events in quadrant B | 3,559,228 | 760,366 |
| Events in quadrant C | 3,540,387 | 689,049 |
| Events in quadrant D | 3,701,423 | 643,446 |
| Mode SS | |||
|---|---|---|---|
| Quadrant | BADHDUFLAG | Total packets | Discarded packets |
| A | 0 | 134 | 0 |
| B | 0 | 134 | 0 |
| C | 0 | 134 | 0 |
| D | 0 | 134 | 0 |
| Mode M9 | |||
|---|---|---|---|
| Quadrant | BADHDUFLAG | Total packets | Discarded packets |
| A | 0 | 17 | 0 |
| B | 0 | 17 | 0 |
| C | 0 | 17 | 0 |
| D | 0 | 18 | 0 |
| Mode M0 | |||
|---|---|---|---|
| Quadrant | BADHDUFLAG | Total packets | Discarded packets |
| A | 0 | 13899 | 3 |
| B | 0 | 14582 | 2 |
| C | 0 | 14426 | 2 |
| D | 0 | 15069 | 2 |
| Quadrant | Total seconds | Saturated seconds | Saturation percentage |
|---|---|---|---|
| A | 6607 | 22 | 0.332980% |
| B | 6607 | 43 | 0.650825% |
| C | 6607 | 18 | 0.272438% |
| D | 6607 | 50 | 0.756773% |
Noise dominated data is calculated using 1-second bins in cleaned event files. If a bin has >2000 counts, and if more than 50% of those come from <1% of pixels, then it is considered to be noise-dominated and hence unusable.
| Quadrant | # 1 sec bins | Bins with >0 counts | Bins with >2000 counts | High rate bins dominated by noise | Noise dominated (total time) | Noise dominated (detector-on time) | Marked lightcurve |
|---|---|---|---|---|---|---|---|
| A | 7858 | 6609 | 0 | 0 | 0.00% | 0.00% | 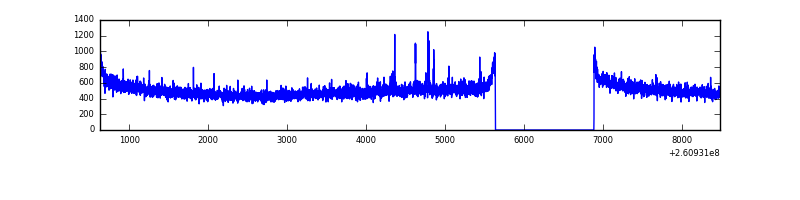 |
| B | 7858 | 6609 | 4 | 4 | 0.05% | 0.06% | 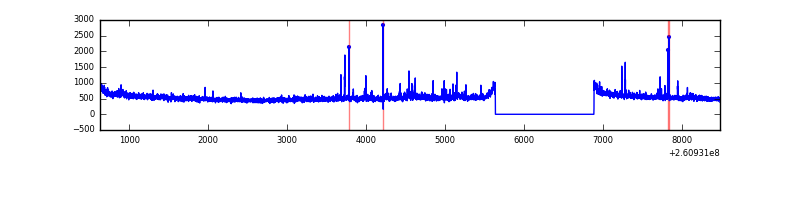 |
| C | 7858 | 6609 | 0 | 0 | 0.00% | 0.00% | 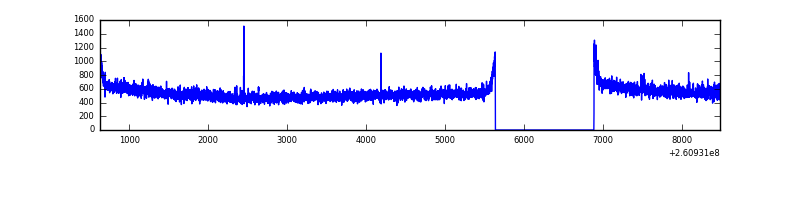 |
| D | 7858 | 6609 | 26 | 26 | 0.33% | 0.39% | 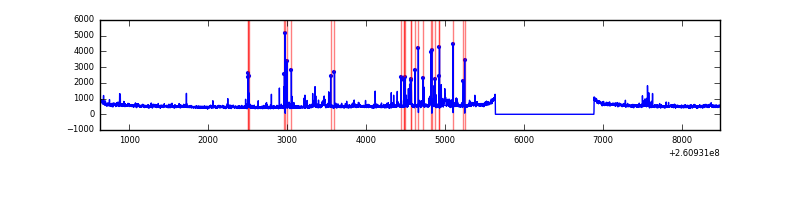 |
Top three noisy pixels from each quadrant. If the there are fewer than three noisy pixels in the level2.evt file, extra rows are filled as -1
| Pixel properties | Quadrant properties | ||||||
|---|---|---|---|---|---|---|---|
| Quadrant | DetID | PixID | Counts | Sigma | Mean | Median | Sigma |
| A | 9 | 143 | 24295 | 136.65 | 857 | 840 | 171.6 |
| A | 0 | 226 | 7566 | 39.18 | 857 | 840 | 171.6 |
| A | 12 | 194 | 6460 | 32.74 | 857 | 840 | 171.6 |
| B | 0 | 219 | 83069 | 508.08 | 874 | 860 | 161.8 |
| B | 4 | 48 | 22318 | 132.62 | 874 | 860 | 161.8 |
| B | 12 | 111 | 17988 | 105.86 | 874 | 860 | 161.8 |
| C | 3 | 233 | 255925 | 1316.84 | 842 | 850 | 193.7 |
| C | 13 | 61 | 5934 | 26.25 | 842 | 850 | 193.7 |
| C | 14 | 234 | 3127 | 11.76 | 842 | 850 | 193.7 |
| D | 8 | 195 | 247944 | 1231.31 | 829 | 807 | 200.7 |
| D | 10 | 157 | 191182 | 948.51 | 829 | 807 | 200.7 |
| D | 13 | 249 | 35805 | 174.37 | 829 | 807 | 200.7 |
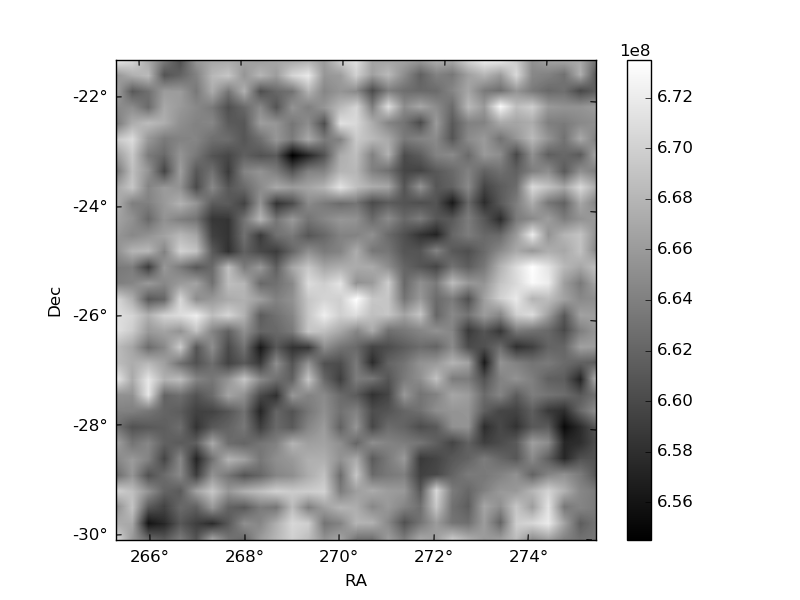
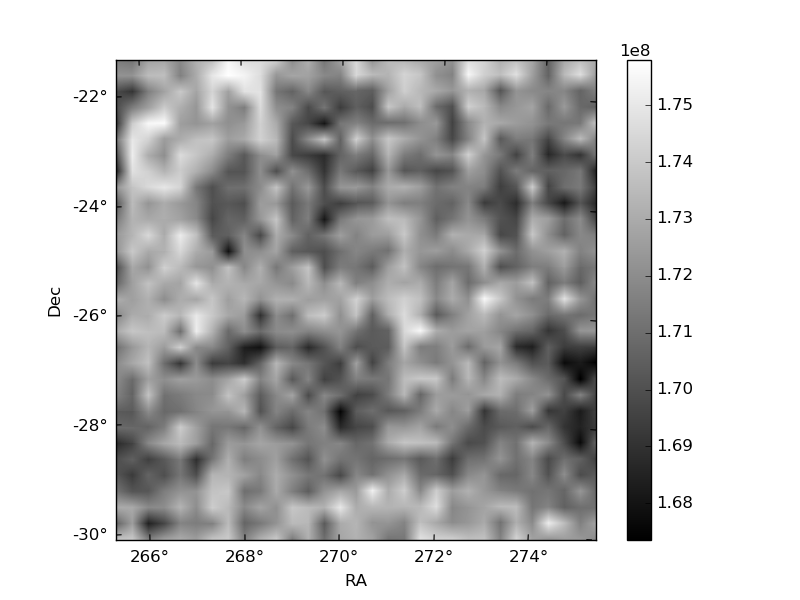
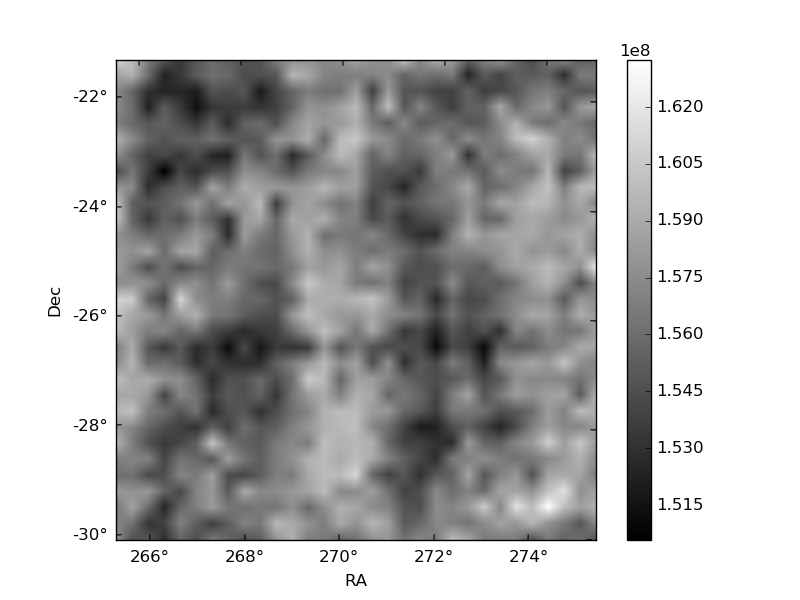
Histogram calculated using DETX and DETY for each event in the final _common_clean file
| Quadrant A | 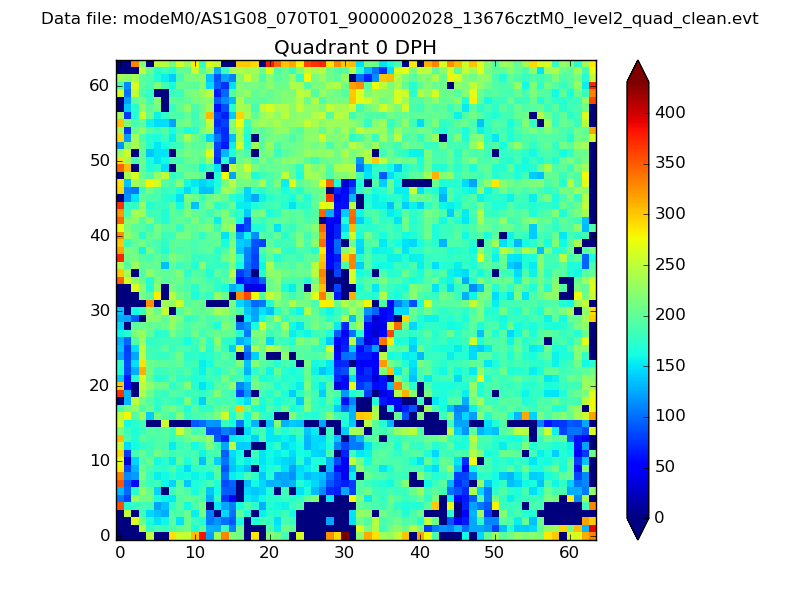 |
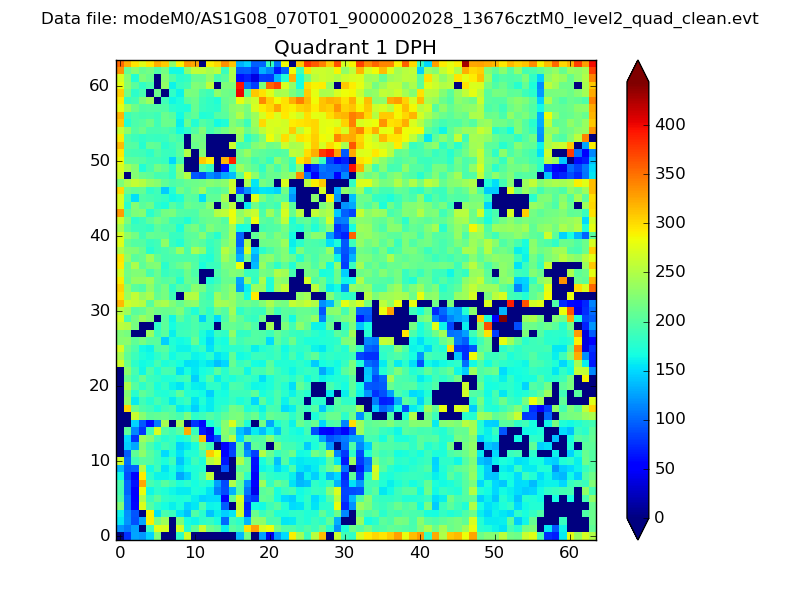 |
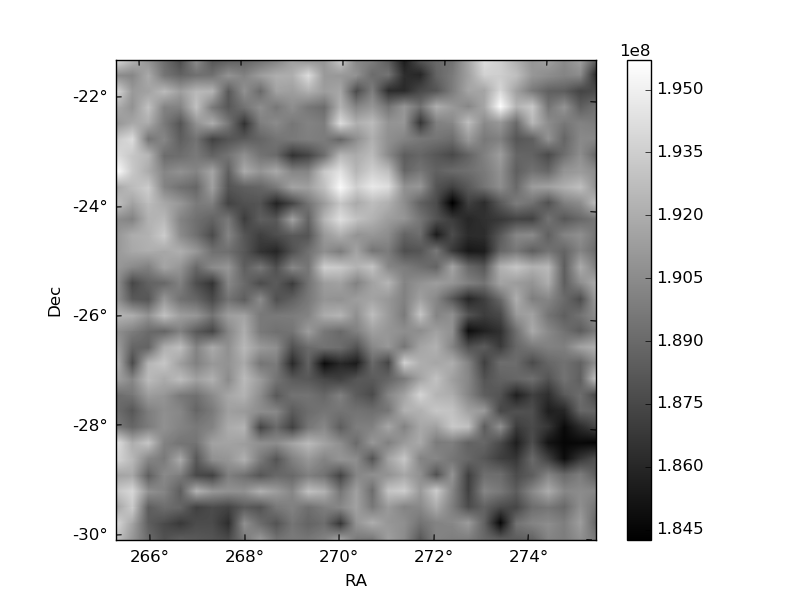
Quadrant B |
|---|---|---|---|
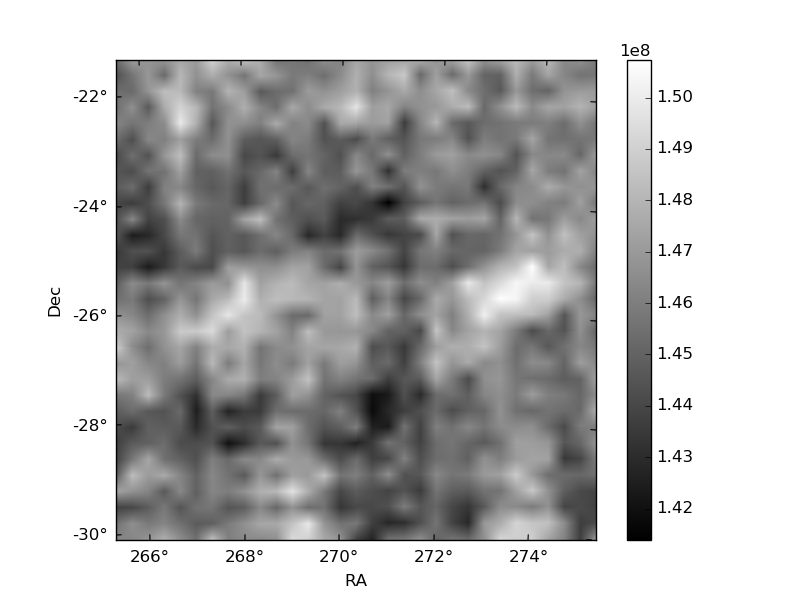
| Quadrant D | 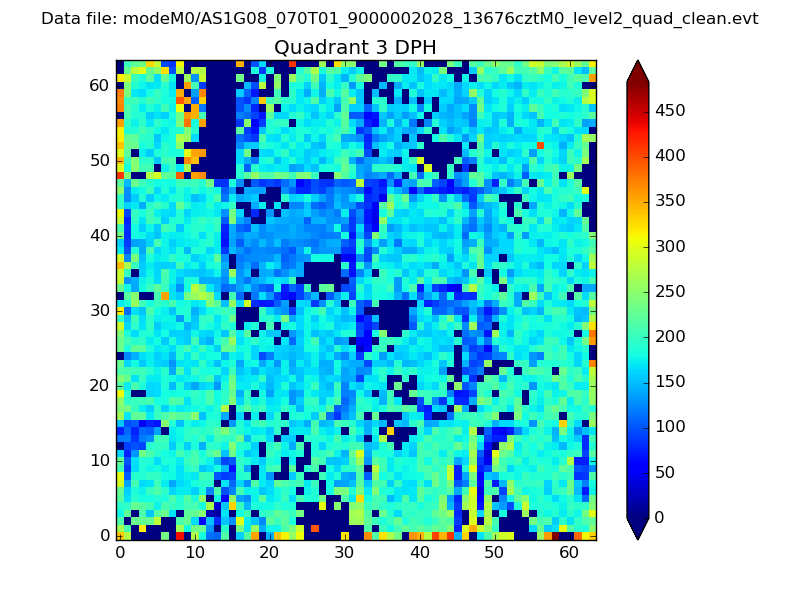 |
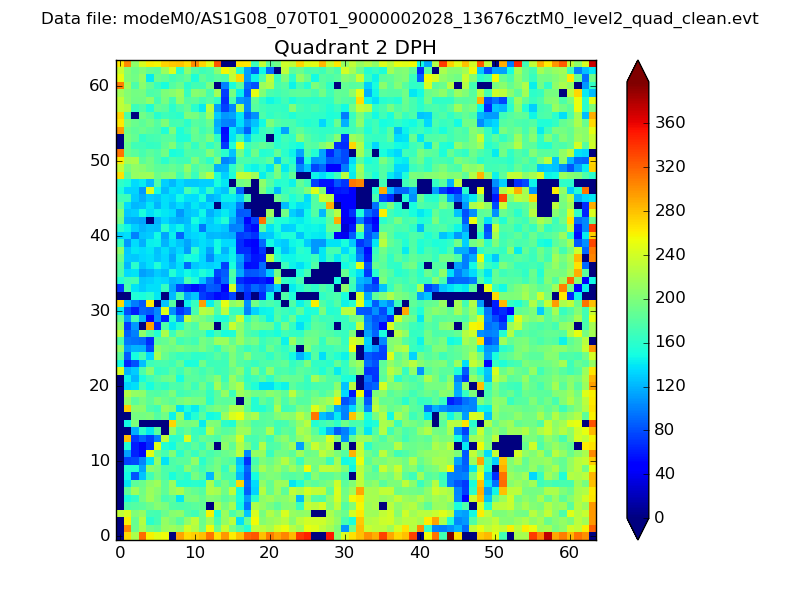 |
Quadrant C |
| Plot type | Count rate plots | Images |
|---|---|---|
| Comparison with Poisson distribution Blue bars denote a histogram of data divided into 1 sec bins. Red curve is a Poisson curve with rate = median count rate of data. |
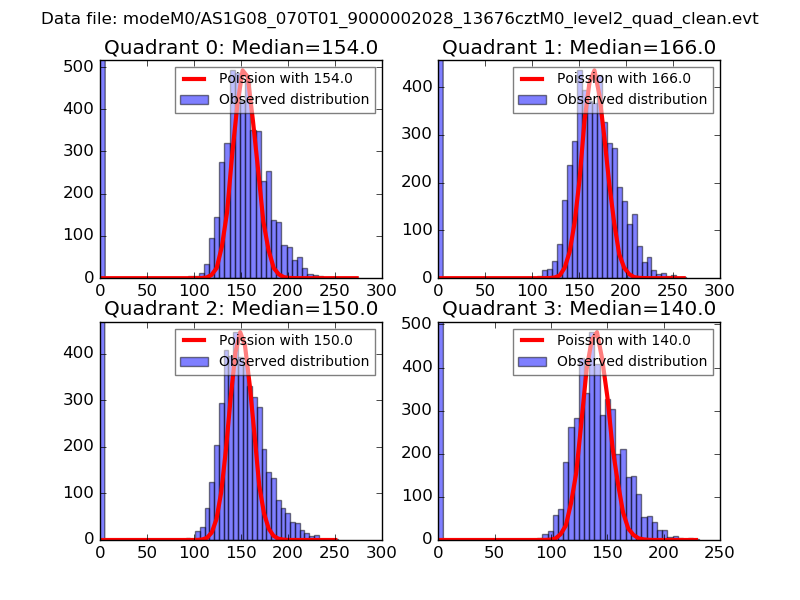 |
 |
| Quadrant-wise count rates Data is divided into 100 sec bins |
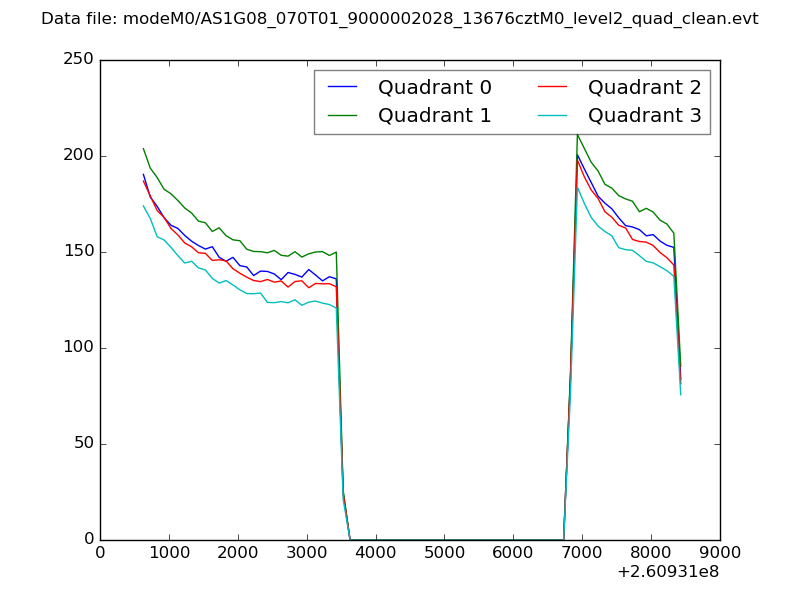 |
|
| Module-wise count rates for Quadrant A Data is divided into 100 sec bins |
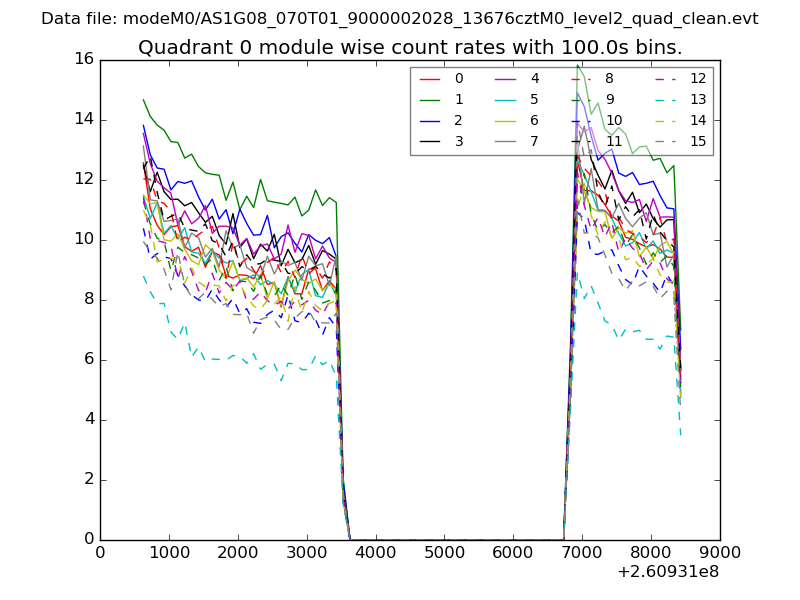 |
 |
| Module-wise count rates for Quadrant B Data is divided into 100 sec bins |
 |
 |
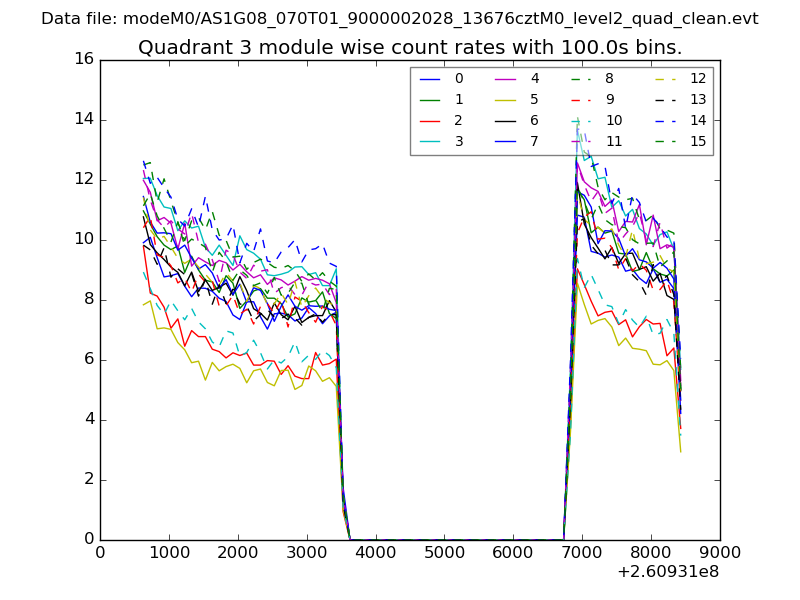
| Module-wise count rates for Quadrant C Data is divided into 100 sec bins |
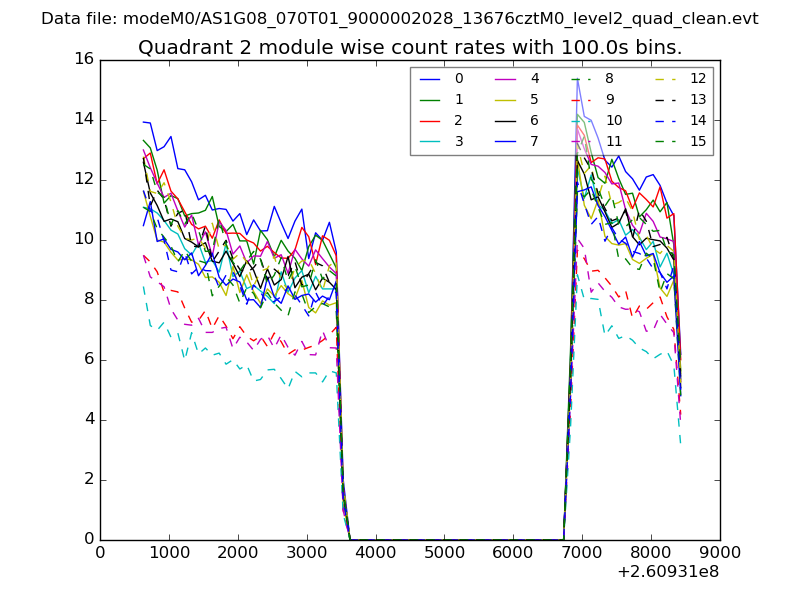 |
 |
| Module-wise count rates for Quadrant D Data is divided into 100 sec bins |
 |
 |
| Parameter | Plot |
|---|---|
| CZT HV Monitor | 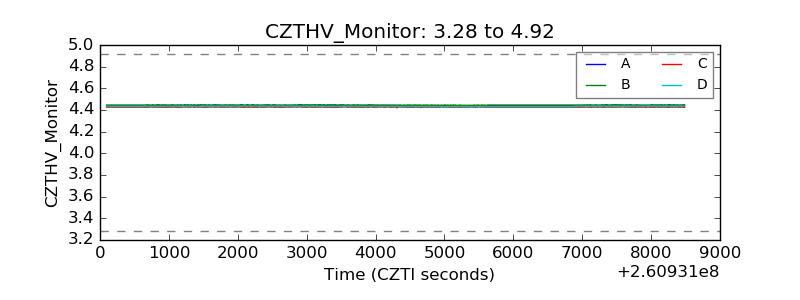 |
| D_VDD | 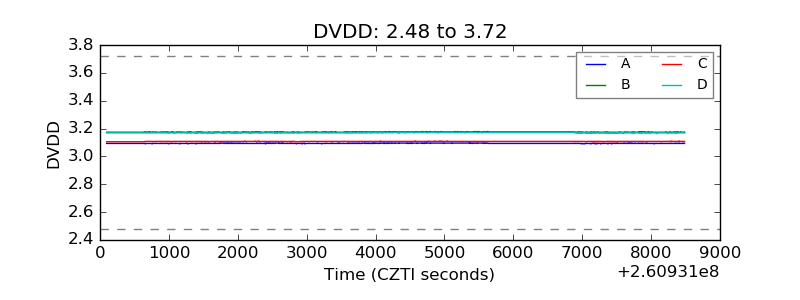 |
| Temperature 1 |  |
| Veto HV Monitor | 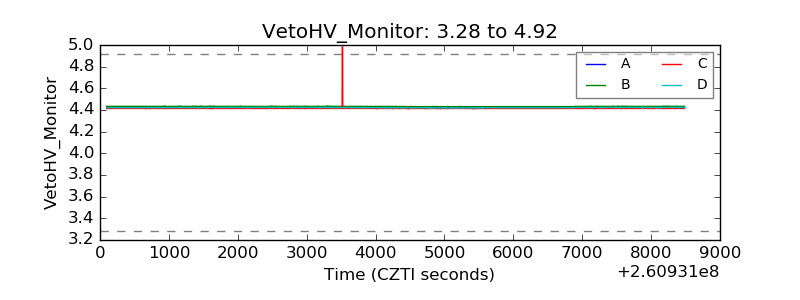 |
| Veto LLD | 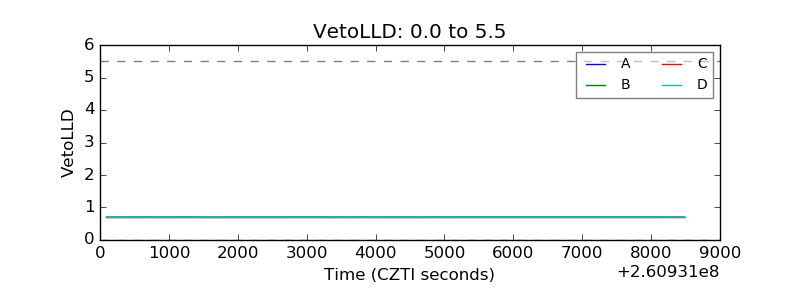 |
| Alpha Counter | 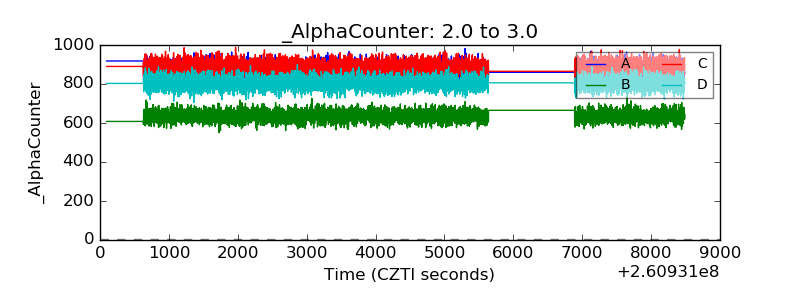 |
| _CPM_Rate | 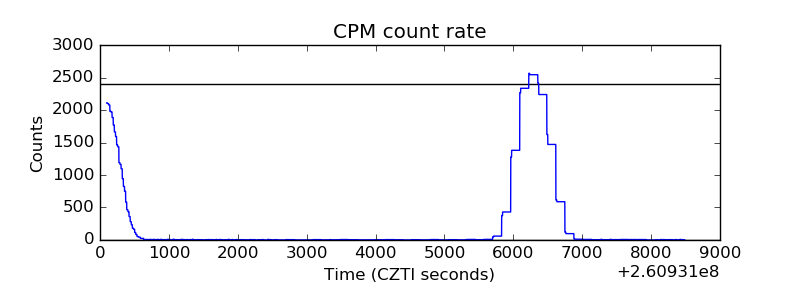 |
| CZT Counter | 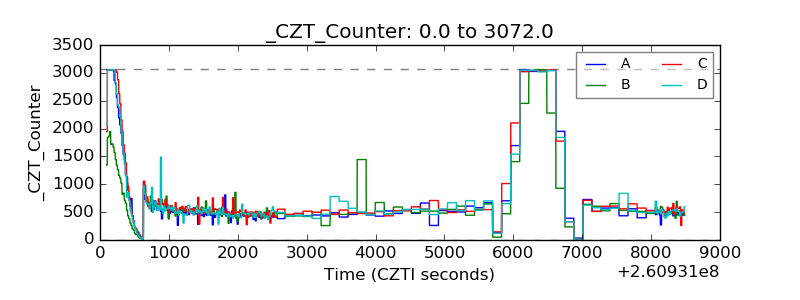 |
| +2.5 Volts monitor | 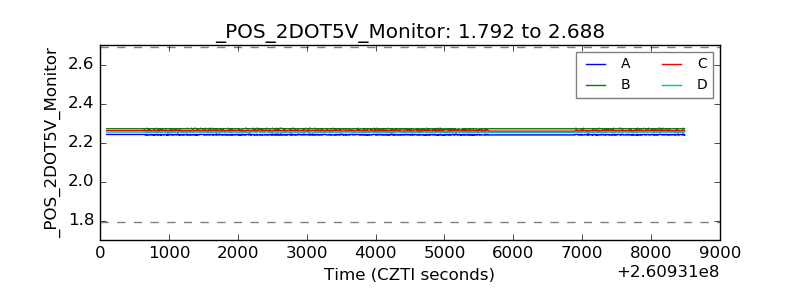 |
| +5 Volts monitor |  |
| _ROLL_ROT | 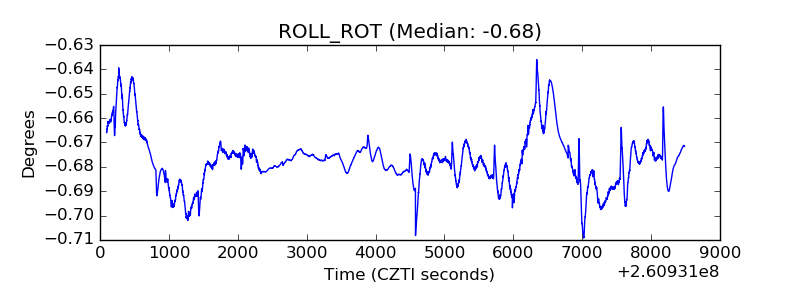 |
| _Roll_DEC | 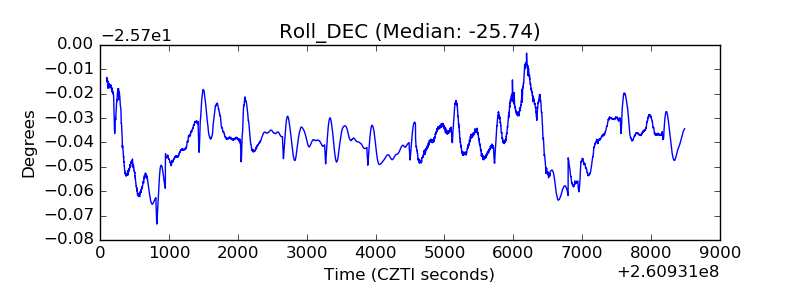 |
| _Roll_RA | 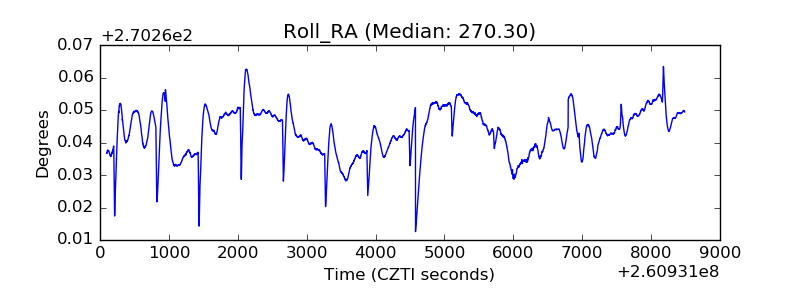 |
| Veto Counter | 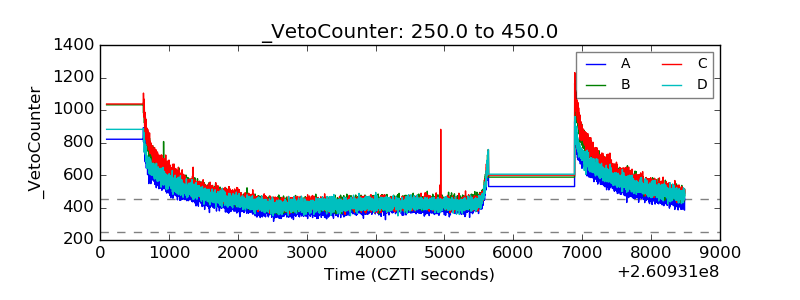 |