| Param | Original file | Final file |
|---|---|---|
| Filename | modeM0/AS1G08_070T01_9000002028_13677cztM0_level2.evt | modeM0/AS1G08_070T01_9000002028_13677cztM0_level2_quad_clean.evt |
| Size (bytes) | 473,483,520 | 98,429,760 |
| Size | 451.5 MB | 93.9 MB |
| Events in quadrant A | 3,168,548 | 647,056 |
| Events in quadrant B | 3,559,394 | 686,860 |
| Events in quadrant C | 3,461,549 | 628,161 |
| Events in quadrant D | 3,730,101 | 586,900 |
| Mode SS | |||
|---|---|---|---|
| Quadrant | BADHDUFLAG | Total packets | Discarded packets |
| A | 0 | 126 | 0 |
| B | 0 | 126 | 0 |
| C | 0 | 126 | 0 |
| D | 0 | 126 | 0 |
| Mode M9 | |||
|---|---|---|---|
| Quadrant | BADHDUFLAG | Total packets | Discarded packets |
| A | 0 | 13 | 0 |
| B | 0 | 13 | 0 |
| C | 0 | 13 | 0 |
| D | 0 | 13 | 0 |
| Mode M0 | |||
|---|---|---|---|
| Quadrant | BADHDUFLAG | Total packets | Discarded packets |
| A | 0 | 12931 | 2 |
| B | 0 | 14149 | 1 |
| C | 0 | 13837 | 1 |
| D | 0 | 14980 | 1 |
| Quadrant | Total seconds | Saturated seconds | Saturation percentage |
|---|---|---|---|
| A | 6188 | 42 | 0.678733% |
| B | 6188 | 86 | 1.389787% |
| C | 6188 | 23 | 0.371687% |
| D | 6188 | 73 | 1.179703% |
Noise dominated data is calculated using 1-second bins in cleaned event files. If a bin has >2000 counts, and if more than 50% of those come from <1% of pixels, then it is considered to be noise-dominated and hence unusable.
| Quadrant | # 1 sec bins | Bins with >0 counts | Bins with >2000 counts | High rate bins dominated by noise | Noise dominated (total time) | Noise dominated (detector-on time) | Marked lightcurve |
|---|---|---|---|---|---|---|---|
| A | 7514 | 6190 | 0 | 0 | 0.00% | 0.00% | 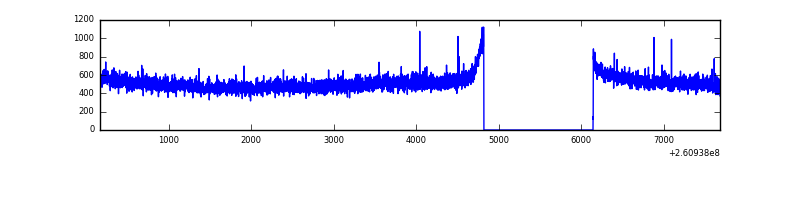 |
| B | 7514 | 6190 | 15 | 15 | 0.20% | 0.24% | 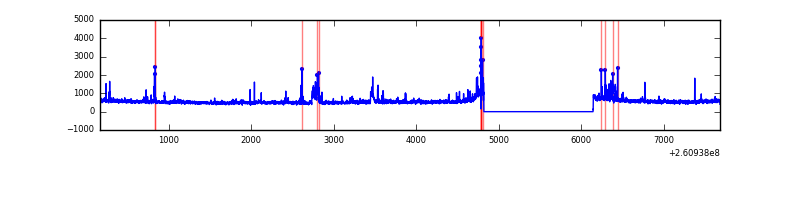 |
| C | 7514 | 6190 | 0 | 0 | 0.00% | 0.00% | 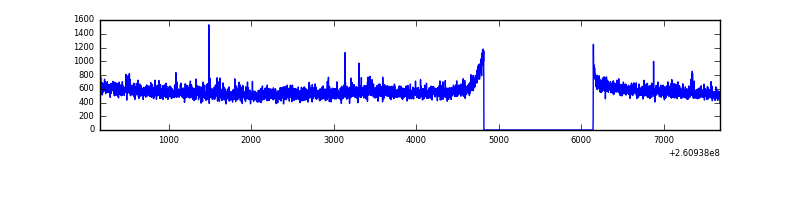 |
| D | 7514 | 6190 | 21 | 21 | 0.28% | 0.34% |  |
Top three noisy pixels from each quadrant. If the there are fewer than three noisy pixels in the level2.evt file, extra rows are filled as -1
| Pixel properties | Quadrant properties | ||||||
|---|---|---|---|---|---|---|---|
| Quadrant | DetID | PixID | Counts | Sigma | Mean | Median | Sigma |
| A | 1 | 162 | 7972 | 43.99 | 820 | 806 | 162.9 |
| A | 0 | 226 | 7245 | 39.53 | 820 | 806 | 162.9 |
| A | 9 | 143 | 6198 | 33.1 | 820 | 806 | 162.9 |
| B | 0 | 219 | 139921 | 896.82 | 826 | 811 | 155.1 |
| B | 3 | 64 | 90120 | 575.76 | 826 | 811 | 155.1 |
| B | 4 | 48 | 43155 | 272.99 | 826 | 811 | 155.1 |
| C | 3 | 233 | 339952 | 1844.83 | 800 | 807 | 183.8 |
| C | 13 | 61 | 5558 | 25.84 | 800 | 807 | 183.8 |
| C | 14 | 234 | 3040 | 12.15 | 800 | 807 | 183.8 |
| D | 8 | 195 | 463222 | 2444.13 | 792 | 774 | 189.2 |
| D | 5 | 222 | 87211 | 456.84 | 792 | 774 | 189.2 |
| D | 10 | 157 | 45309 | 235.38 | 792 | 774 | 189.2 |
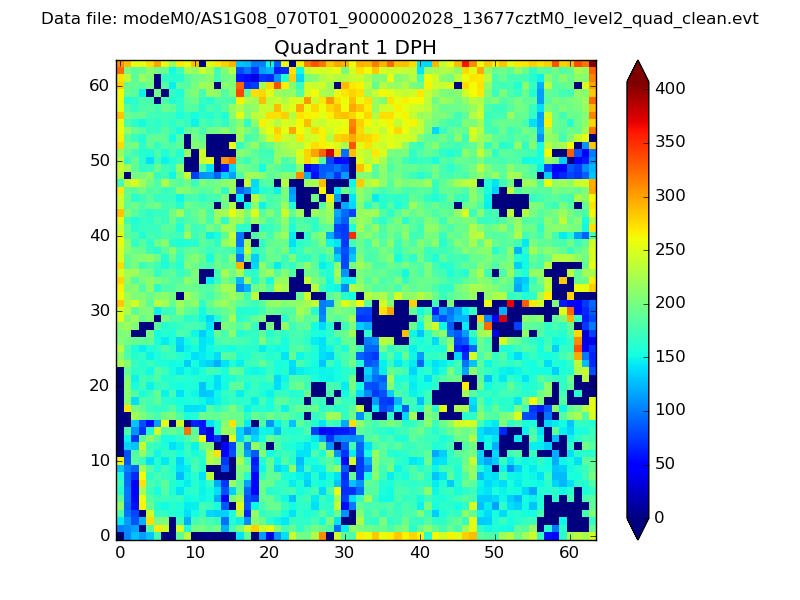
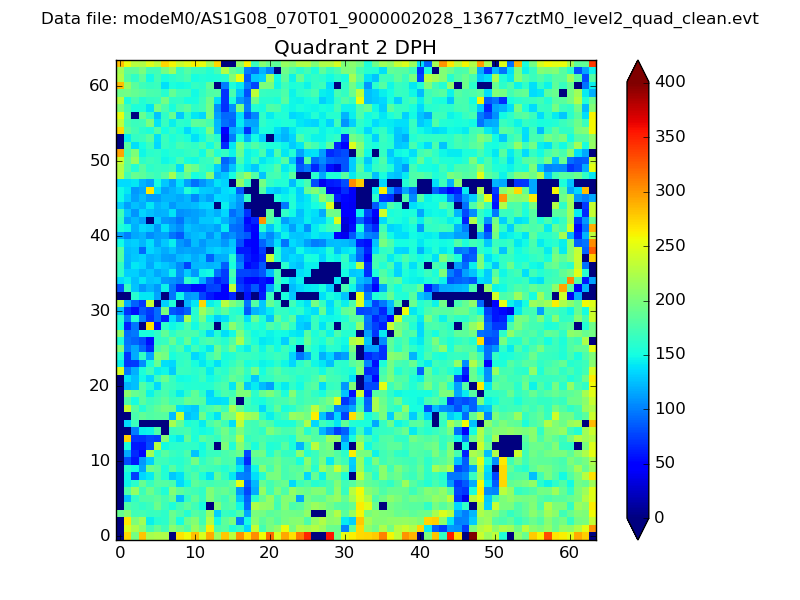
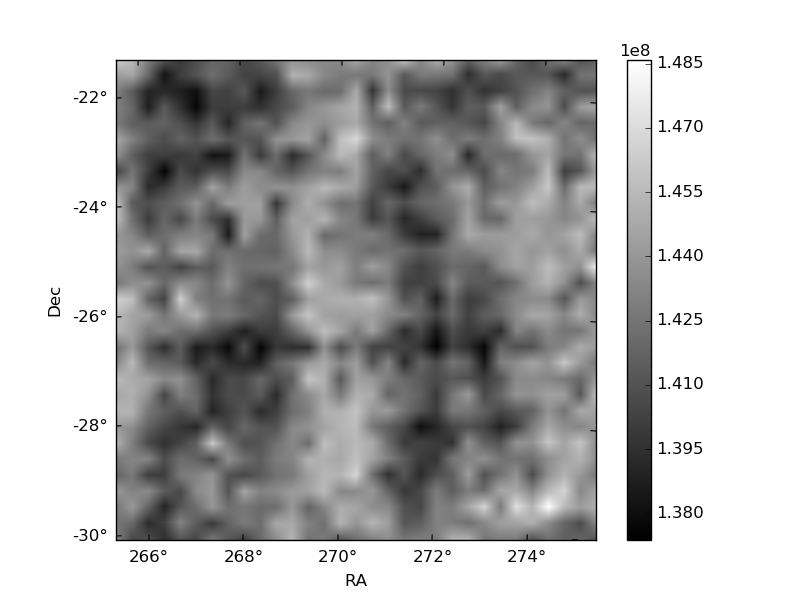
Histogram calculated using DETX and DETY for each event in the final _common_clean file
| Quadrant A | 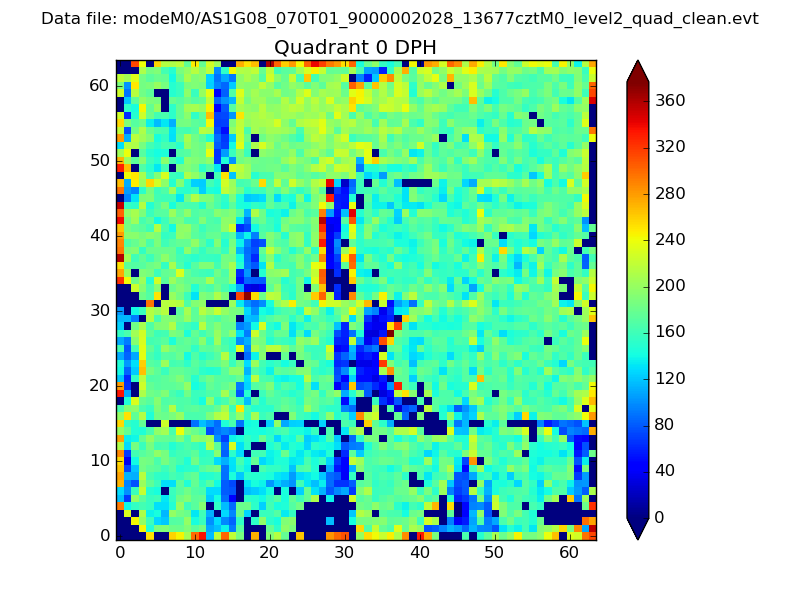 |
 |
Quadrant B |
|---|---|---|---|
| Quadrant D | 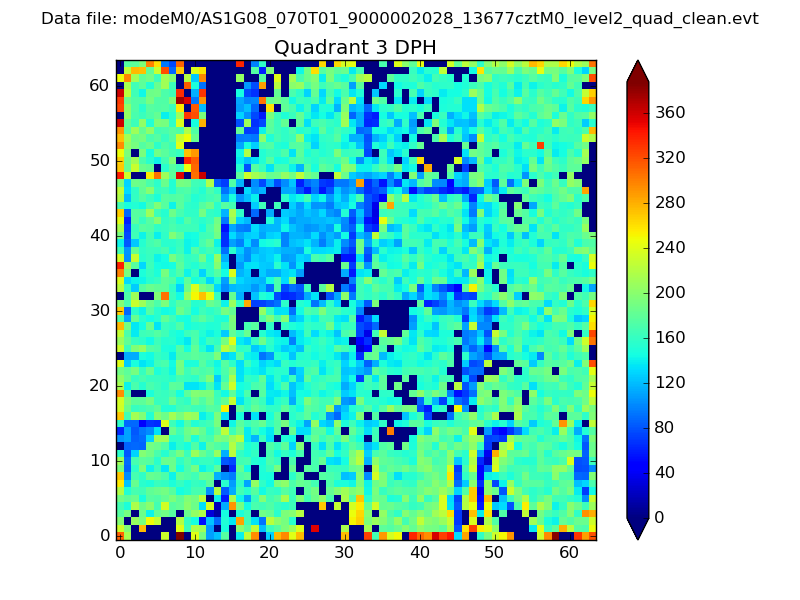 |
 |
Quadrant C |
| Plot type | Count rate plots | Images |
|---|---|---|
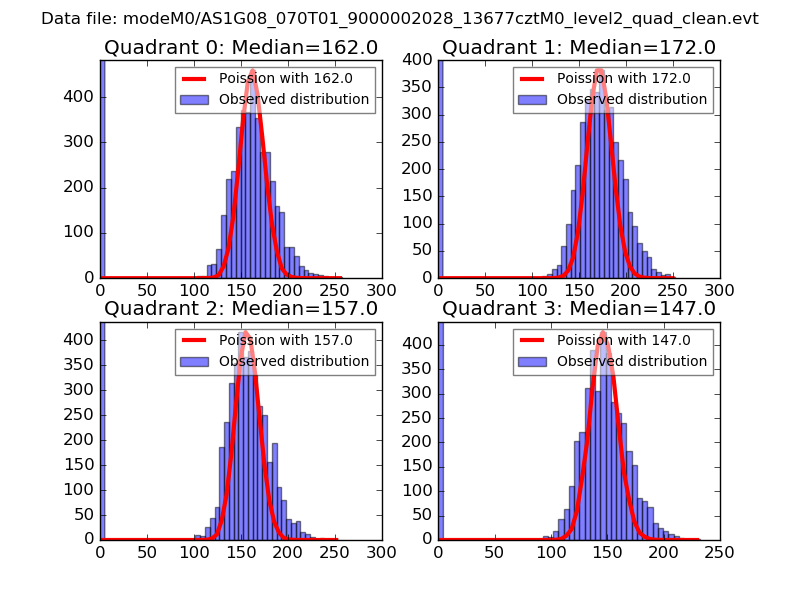
| Comparison with Poisson distribution Blue bars denote a histogram of data divided into 1 sec bins. Red curve is a Poisson curve with rate = median count rate of data. |
 |
 |
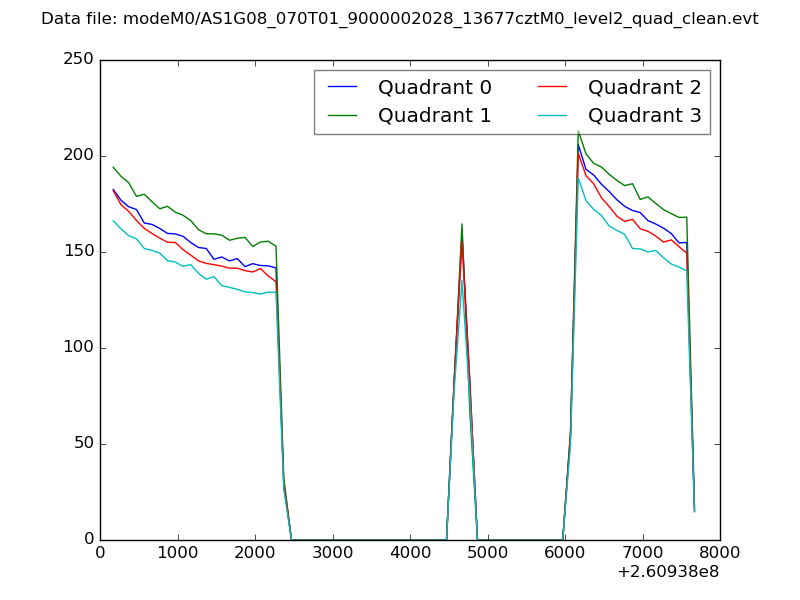
| Quadrant-wise count rates Data is divided into 100 sec bins |
 |
|
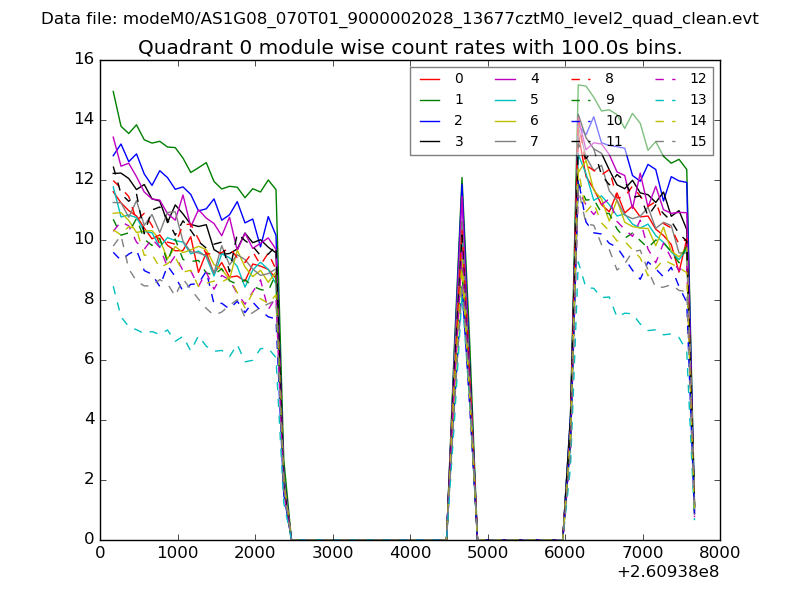
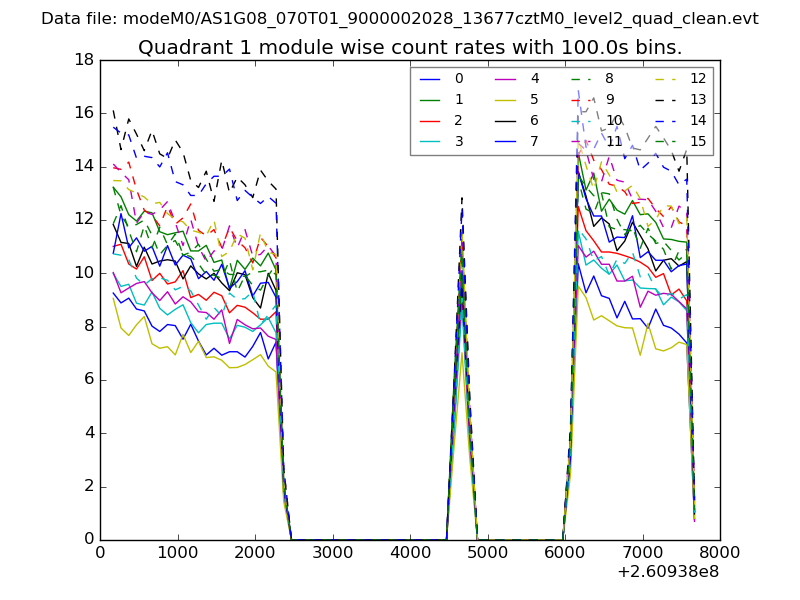
| Module-wise count rates for Quadrant A Data is divided into 100 sec bins |
 |
 |
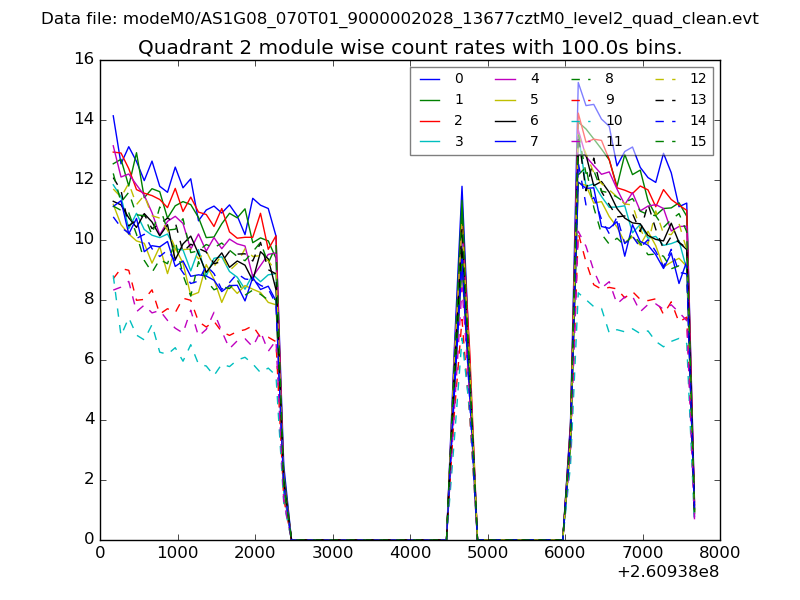
| Module-wise count rates for Quadrant B Data is divided into 100 sec bins |
 |
 |
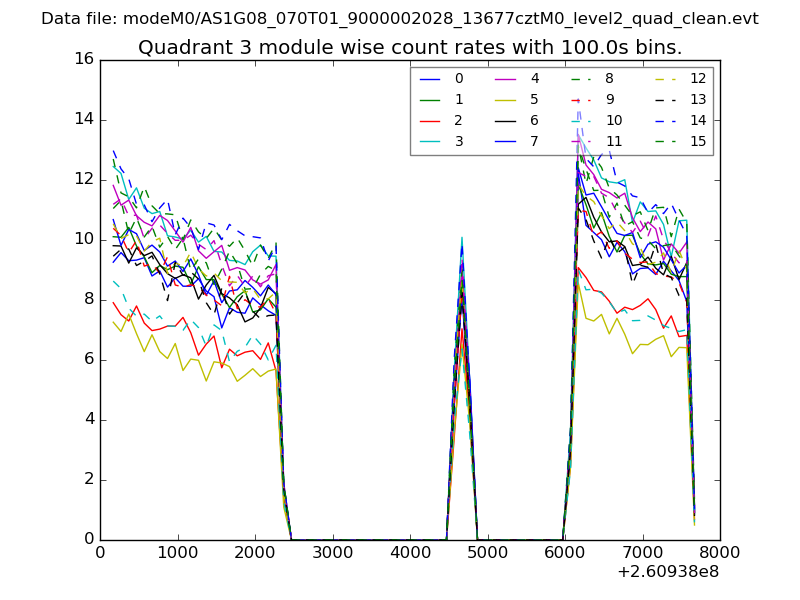
| Module-wise count rates for Quadrant C Data is divided into 100 sec bins |
 |
 |
| Module-wise count rates for Quadrant D Data is divided into 100 sec bins |
 |
 |
| Parameter | Plot |
|---|---|
| CZT HV Monitor | 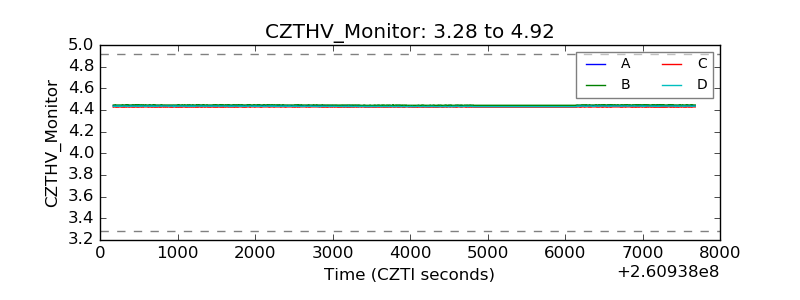 |
| D_VDD | 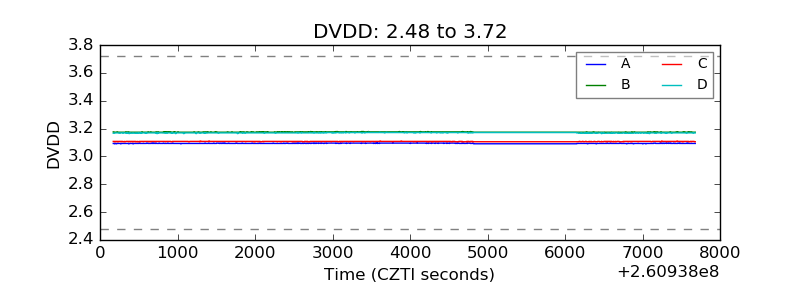 |
| Temperature 1 | 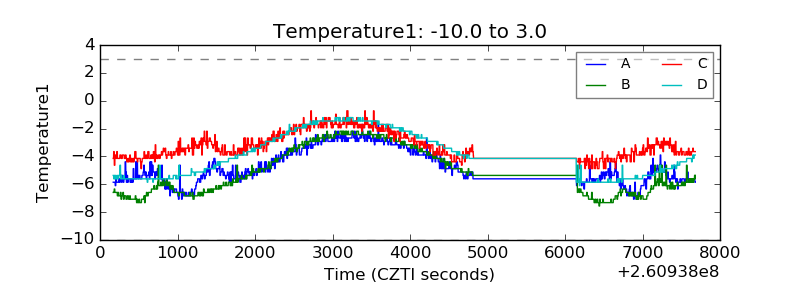 |
| Veto HV Monitor | 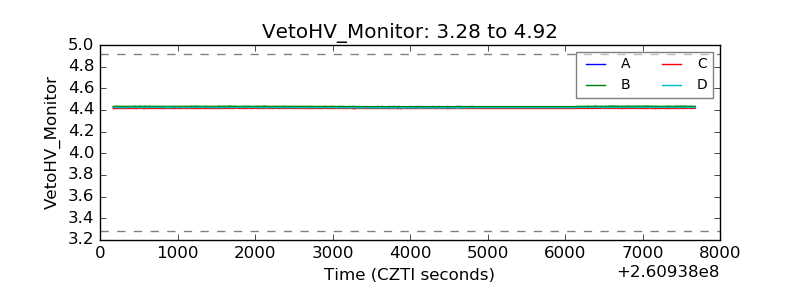 |
| Veto LLD | 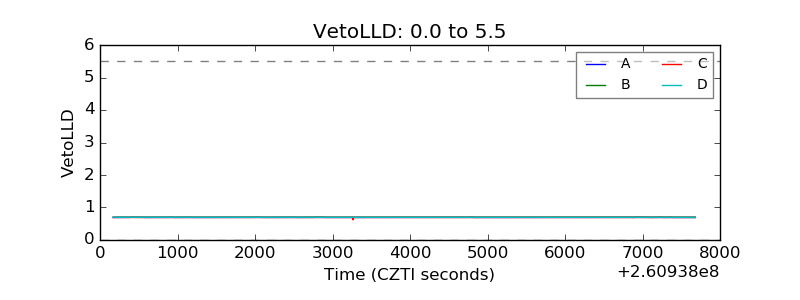 |
| Alpha Counter | 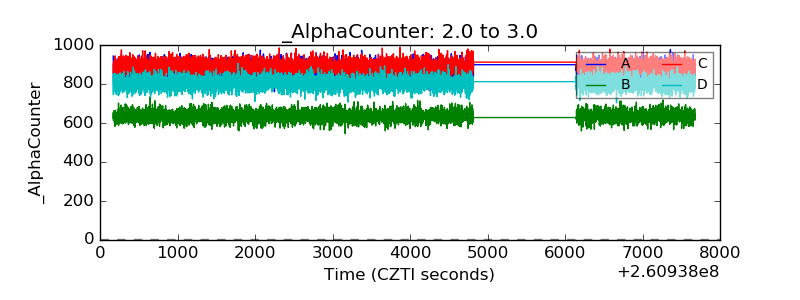 |
| _CPM_Rate | 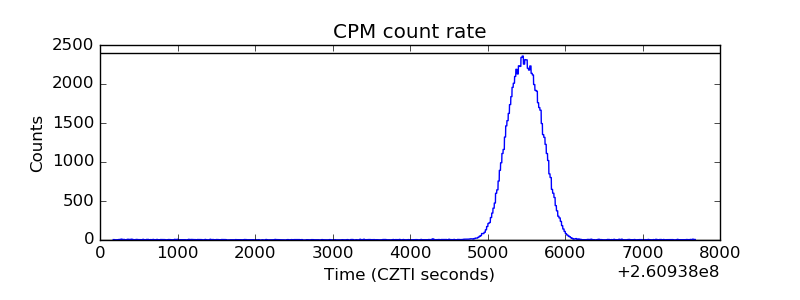 |
| CZT Counter | 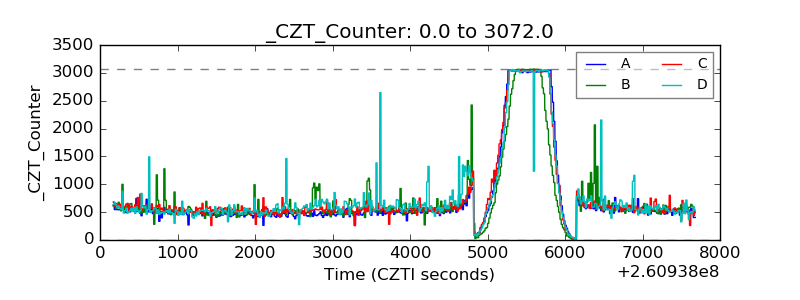 |
| +2.5 Volts monitor |  |
| +5 Volts monitor | 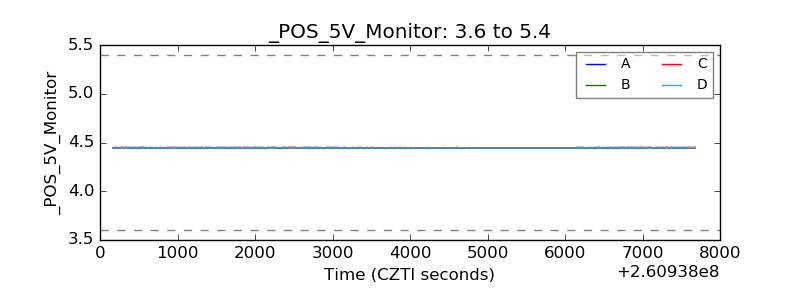 |
| _ROLL_ROT | 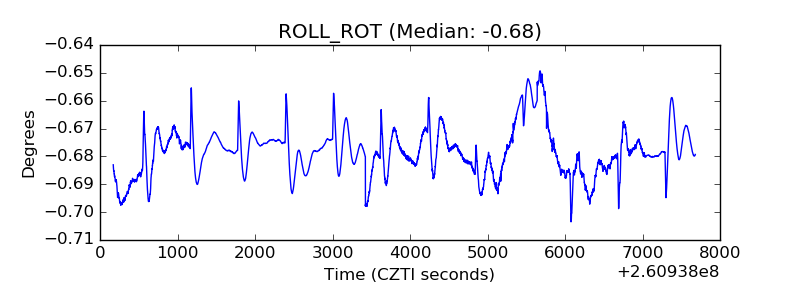 |
| _Roll_DEC | 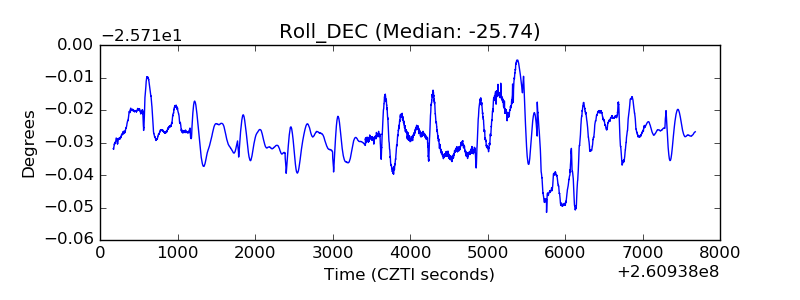 |
| _Roll_RA | 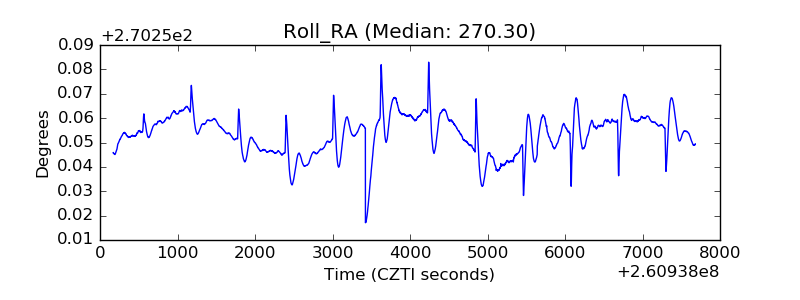 |
| Veto Counter | 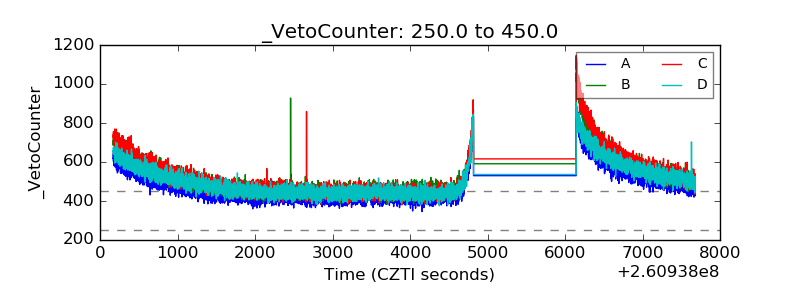 |