| Param | Original file | Final file |
|---|---|---|
| Filename | modeM0/AS1G08_070T01_9000002028_13678cztM0_level2.evt | modeM0/AS1G08_070T01_9000002028_13678cztM0_level2_quad_clean.evt |
| Size (bytes) | 502,623,360 | 104,313,600 |
| Size | 479.3 MB | 99.5 MB |
| Events in quadrant A | 3,344,380 | 690,358 |
| Events in quadrant B | 3,718,608 | 732,912 |
| Events in quadrant C | 3,467,657 | 666,226 |
| Events in quadrant D | 4,260,392 | 626,331 |
| Mode SS | |||
|---|---|---|---|
| Quadrant | BADHDUFLAG | Total packets | Discarded packets |
| A | 0 | 130 | 0 |
| B | 0 | 130 | 0 |
| C | 0 | 130 | 0 |
| D | 0 | 130 | 0 |
| Mode M9 | |||
|---|---|---|---|
| Quadrant | BADHDUFLAG | Total packets | Discarded packets |
| A | 0 | 16 | 0 |
| B | 0 | 16 | 0 |
| C | 0 | 16 | 0 |
| D | 0 | 17 | 0 |
| Mode M0 | |||
|---|---|---|---|
| Quadrant | BADHDUFLAG | Total packets | Discarded packets |
| A | 0 | 13520 | 3 |
| B | 0 | 14767 | 2 |
| C | 0 | 13942 | 2 |
| D | 0 | 16631 | 2 |
| Quadrant | Total seconds | Saturated seconds | Saturation percentage |
|---|---|---|---|
| A | 6353 | 56 | 0.881473% |
| B | 6353 | 108 | 1.699984% |
| C | 6353 | 45 | 0.708327% |
| D | 6353 | 100 | 1.574059% |
Noise dominated data is calculated using 1-second bins in cleaned event files. If a bin has >2000 counts, and if more than 50% of those come from <1% of pixels, then it is considered to be noise-dominated and hence unusable.
| Quadrant | # 1 sec bins | Bins with >0 counts | Bins with >2000 counts | High rate bins dominated by noise | Noise dominated (total time) | Noise dominated (detector-on time) | Marked lightcurve |
|---|---|---|---|---|---|---|---|
| A | 7684 | 6355 | 0 | 0 | 0.00% | 0.00% |  |
| B | 7684 | 6355 | 13 | 13 | 0.17% | 0.20% |  |
| C | 7684 | 6355 | 0 | 0 | 0.00% | 0.00% |  |
| D | 7684 | 6355 | 65 | 65 | 0.85% | 1.02% |  |
Top three noisy pixels from each quadrant. If the there are fewer than three noisy pixels in the level2.evt file, extra rows are filled as -1
| Pixel properties | Quadrant properties | ||||||
|---|---|---|---|---|---|---|---|
| Quadrant | DetID | PixID | Counts | Sigma | Mean | Median | Sigma |
| A | 1 | 162 | 11005 | 59.35 | 865 | 852 | 171.1 |
| A | 0 | 226 | 7652 | 39.75 | 865 | 852 | 171.1 |
| A | 12 | 194 | 6496 | 32.99 | 865 | 852 | 171.1 |
| B | 0 | 219 | 169367 | 1042.06 | 868 | 855 | 161.7 |
| B | 3 | 64 | 74343 | 454.44 | 868 | 855 | 161.7 |
| B | 0 | 214 | 68286 | 416.99 | 868 | 855 | 161.7 |
| C | 3 | 233 | 206538 | 1070.59 | 836 | 844 | 192.1 |
| C | 13 | 61 | 5990 | 26.78 | 836 | 844 | 192.1 |
| C | 14 | 234 | 2290 | 7.53 | 836 | 844 | 192.1 |
| D | 5 | 222 | 582393 | 2917.8 | 833 | 812 | 199.3 |
| D | 8 | 195 | 175741 | 877.62 | 833 | 812 | 199.3 |
| D | 13 | 122 | 114245 | 569.09 | 833 | 812 | 199.3 |
Histogram calculated using DETX and DETY for each event in the final _common_clean file
| Quadrant A |  |
 |
Quadrant B |
|---|---|---|---|
| Quadrant D |  |
 |
Quadrant C |
| Plot type | Count rate plots | Images |
|---|---|---|
| Comparison with Poisson distribution Blue bars denote a histogram of data divided into 1 sec bins. Red curve is a Poisson curve with rate = median count rate of data. |
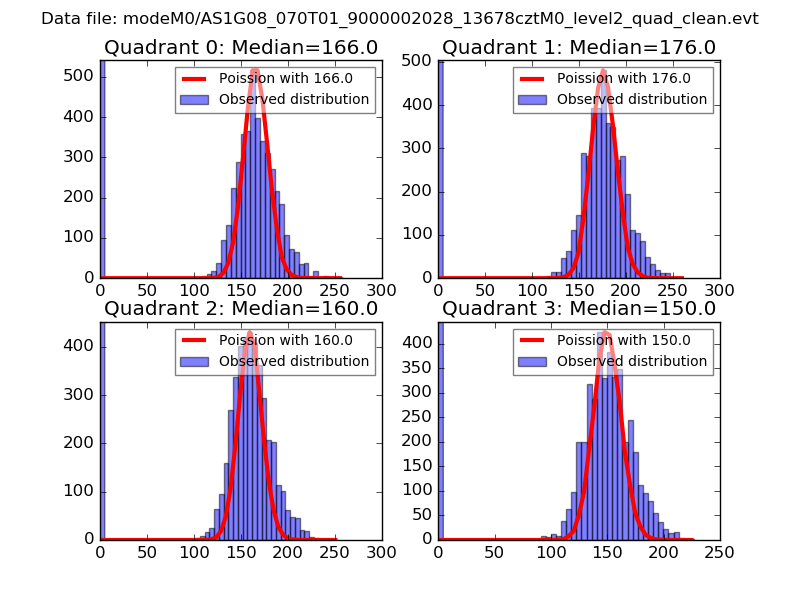 |
 |
| Quadrant-wise count rates Data is divided into 100 sec bins |
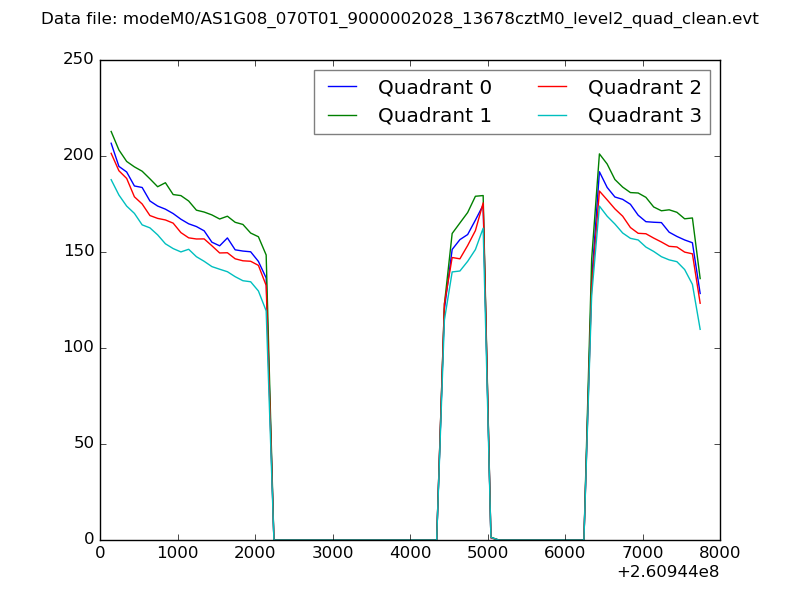 |
|
| Module-wise count rates for Quadrant A Data is divided into 100 sec bins |
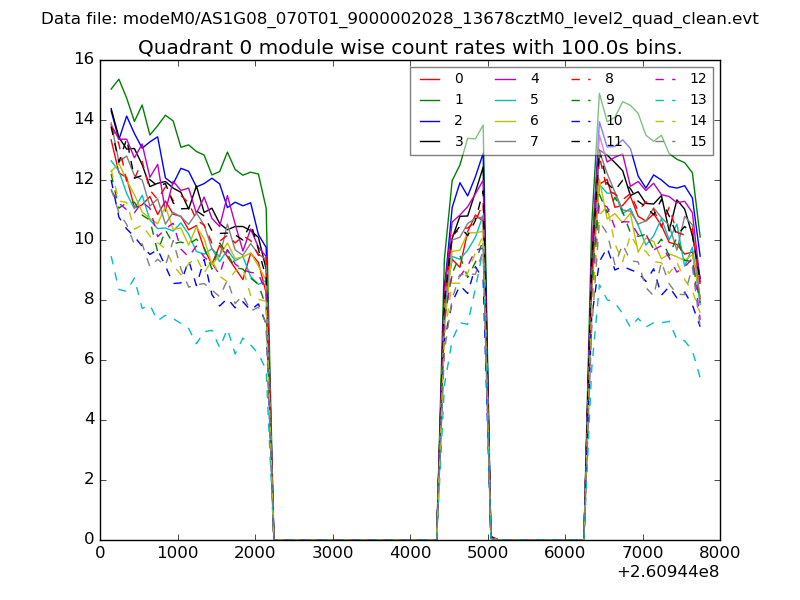 |
 |
| Module-wise count rates for Quadrant B Data is divided into 100 sec bins |
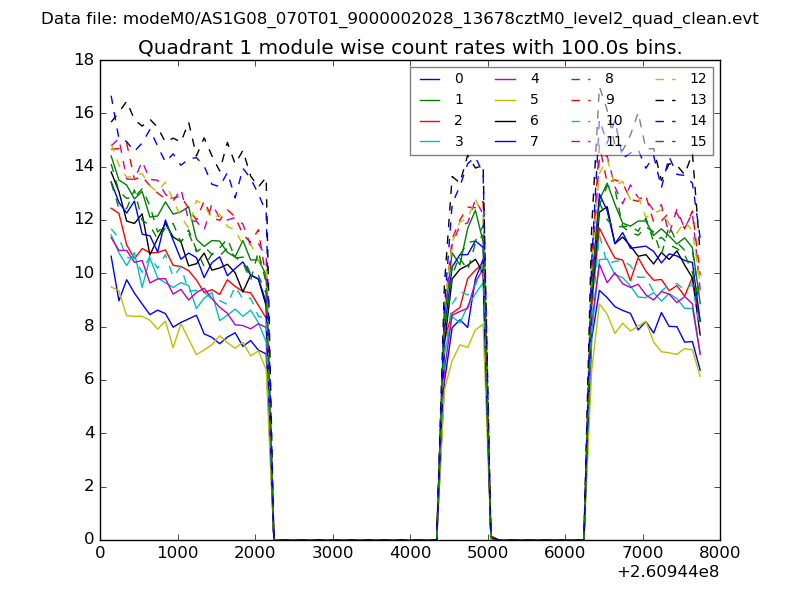 |
 |
| Module-wise count rates for Quadrant C Data is divided into 100 sec bins |
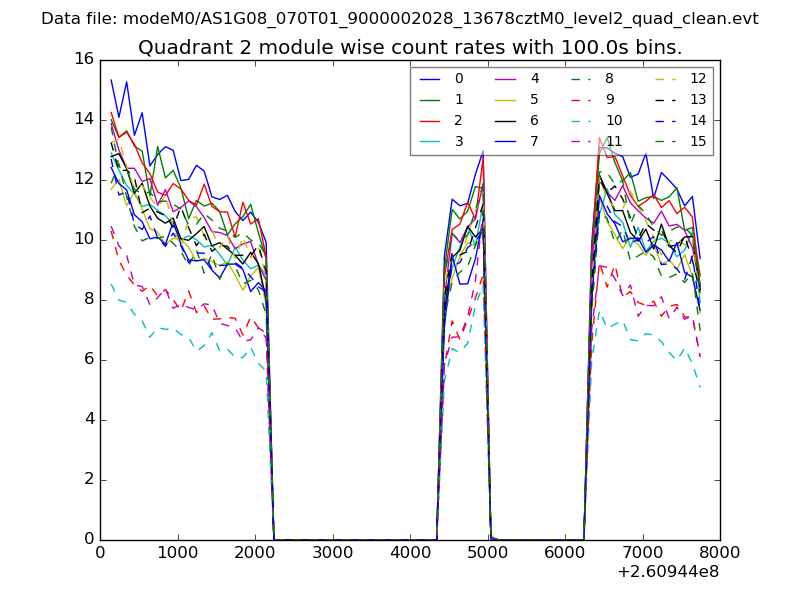 |
 |
| Module-wise count rates for Quadrant D Data is divided into 100 sec bins |
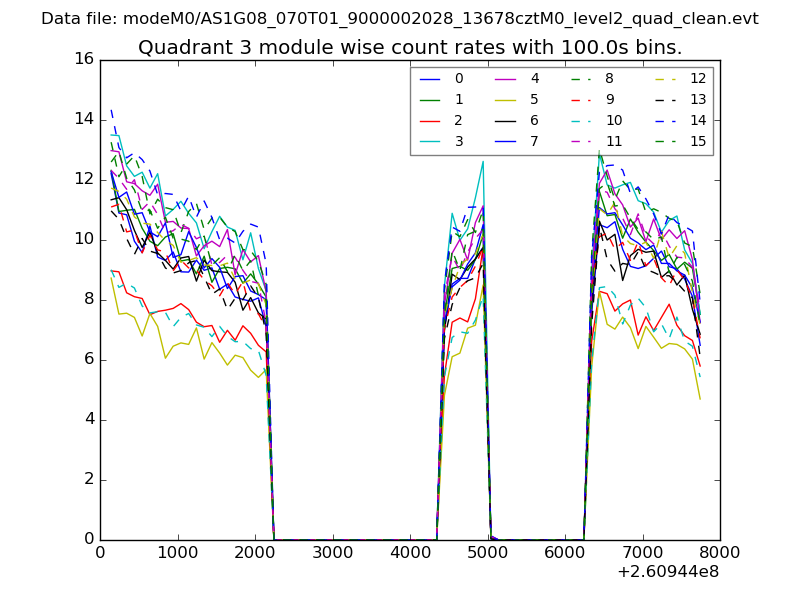 |
 |
| Parameter | Plot |
|---|---|
| CZT HV Monitor | 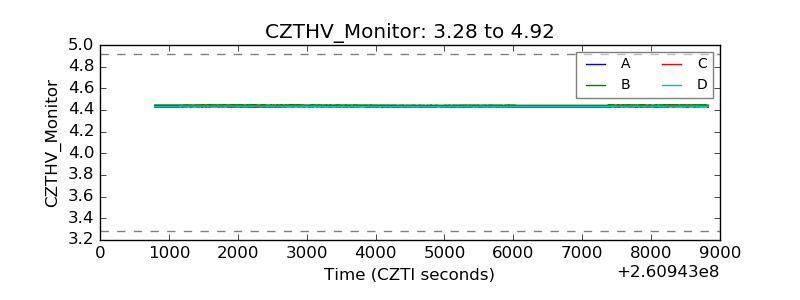 |
| D_VDD |  |
| Temperature 1 |  |
| Veto HV Monitor |  |
| Veto LLD |  |
| Alpha Counter | 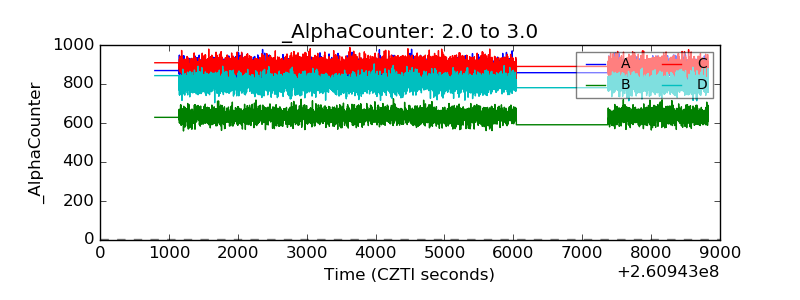 |
| _CPM_Rate | 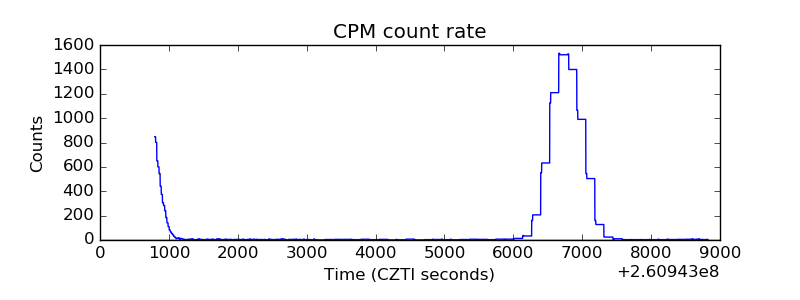 |
| CZT Counter |  |
| +2.5 Volts monitor |  |
| +5 Volts monitor |  |
| _ROLL_ROT | 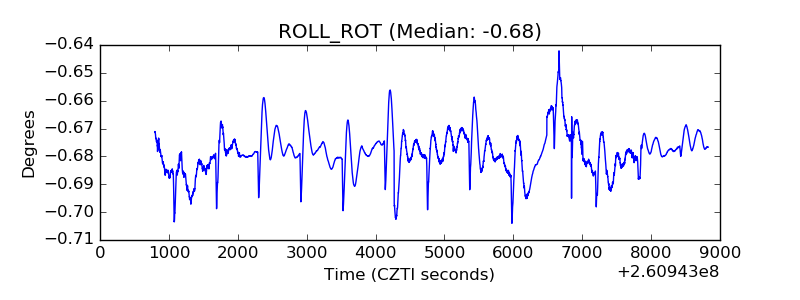 |
| _Roll_DEC |  |
| _Roll_RA |  |
| Veto Counter | 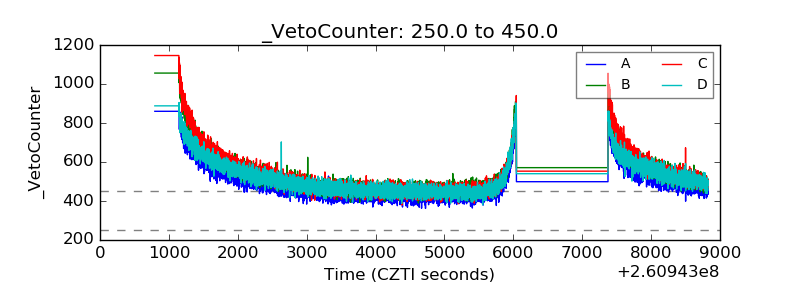 |