| Param | Original file | Final file |
|---|---|---|
| Filename | modeM0/AS1G08_070T01_9000002028_13679cztM0_level2.evt | modeM0/AS1G08_070T01_9000002028_13679cztM0_level2_quad_clean.evt |
| Size (bytes) | 439,355,520 | 86,238,720 |
| Size | 419.0 MB | 82.2 MB |
| Events in quadrant A | 3,005,859 | 561,750 |
| Events in quadrant B | 3,175,941 | 597,919 |
| Events in quadrant C | 3,100,624 | 536,685 |
| Events in quadrant D | 3,628,471 | 508,691 |
| Mode SS | |||
|---|---|---|---|
| Quadrant | BADHDUFLAG | Total packets | Discarded packets |
| A | 0 | 118 | 0 |
| B | 0 | 118 | 0 |
| C | 0 | 118 | 0 |
| D | 0 | 118 | 0 |
| Mode M9 | |||
|---|---|---|---|
| Quadrant | BADHDUFLAG | Total packets | Discarded packets |
| A | 0 | 13 | 0 |
| B | 0 | 13 | 0 |
| C | 0 | 13 | 0 |
| D | 0 | 13 | 0 |
| Mode M0 | |||
|---|---|---|---|
| Quadrant | BADHDUFLAG | Total packets | Discarded packets |
| A | 0 | 12205 | 2 |
| B | 0 | 12747 | 1 |
| C | 0 | 12419 | 1 |
| D | 0 | 14326 | 1 |
| Quadrant | Total seconds | Saturated seconds | Saturation percentage |
|---|---|---|---|
| A | 5818 | 54 | 0.928154% |
| B | 5818 | 75 | 1.289103% |
| C | 5818 | 36 | 0.618769% |
| D | 5818 | 70 | 1.203163% |
Noise dominated data is calculated using 1-second bins in cleaned event files. If a bin has >2000 counts, and if more than 50% of those come from <1% of pixels, then it is considered to be noise-dominated and hence unusable.
| Quadrant | # 1 sec bins | Bins with >0 counts | Bins with >2000 counts | High rate bins dominated by noise | Noise dominated (total time) | Noise dominated (detector-on time) | Marked lightcurve |
|---|---|---|---|---|---|---|---|
| A | 7089 | 5820 | 0 | 0 | 0.00% | 0.00% | 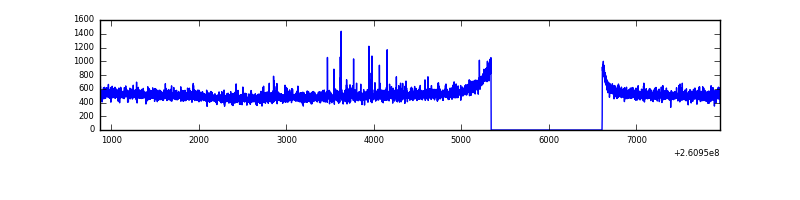 |
| B | 7089 | 5820 | 5 | 5 | 0.07% | 0.09% | 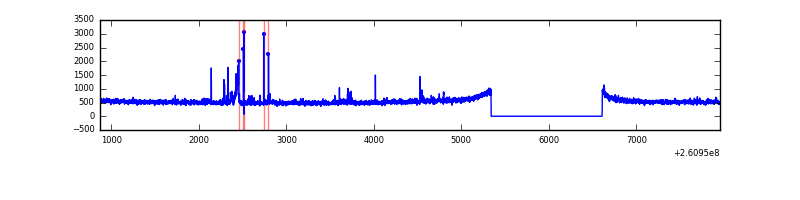 |
| C | 7089 | 5820 | 0 | 0 | 0.00% | 0.00% | 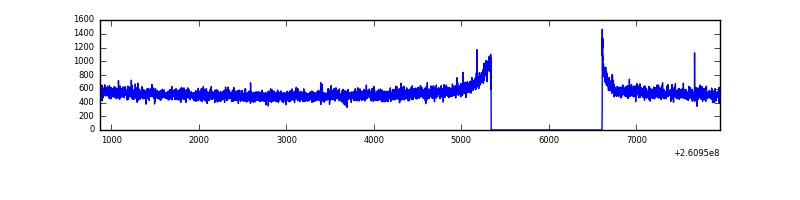 |
| D | 7089 | 5820 | 34 | 34 | 0.48% | 0.58% | 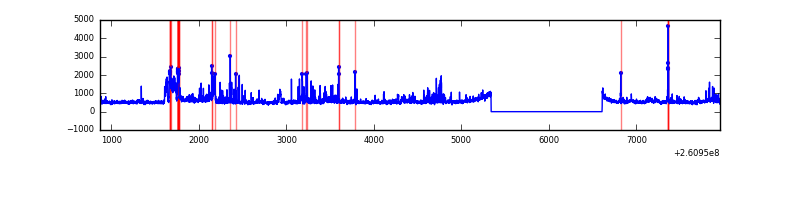 |
Top three noisy pixels from each quadrant. If the there are fewer than three noisy pixels in the level2.evt file, extra rows are filled as -1
| Pixel properties | Quadrant properties | ||||||
|---|---|---|---|---|---|---|---|
| Quadrant | DetID | PixID | Counts | Sigma | Mean | Median | Sigma |
| A | 1 | 162 | 20620 | 126.58 | 772 | 758 | 156.9 |
| A | 0 | 226 | 6949 | 39.46 | 772 | 758 | 156.9 |
| A | 1 | 178 | 6659 | 37.61 | 772 | 758 | 156.9 |
| B | 0 | 219 | 97411 | 663.48 | 773 | 760 | 145.7 |
| B | 3 | 64 | 29408 | 196.66 | 773 | 760 | 145.7 |
| B | 12 | 111 | 15930 | 104.14 | 773 | 760 | 145.7 |
| C | 3 | 233 | 215227 | 1257.56 | 740 | 745 | 170.6 |
| C | 13 | 61 | 5326 | 26.86 | 740 | 745 | 170.6 |
| C | 3 | 202 | 1749 | 5.89 | 740 | 745 | 170.6 |
| D | 13 | 122 | 325788 | 1838.24 | 742 | 724 | 176.8 |
| D | 5 | 222 | 194363 | 1095.03 | 742 | 724 | 176.8 |
| D | 8 | 195 | 130797 | 735.57 | 742 | 724 | 176.8 |
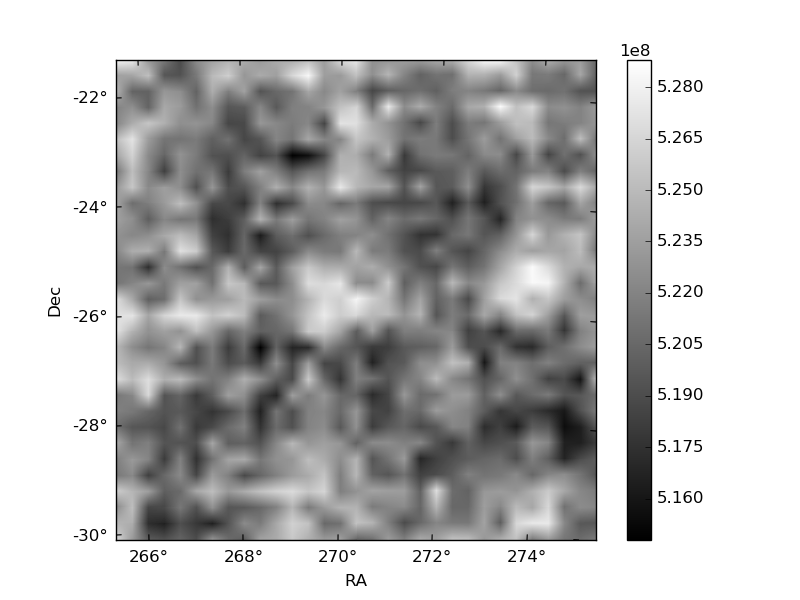
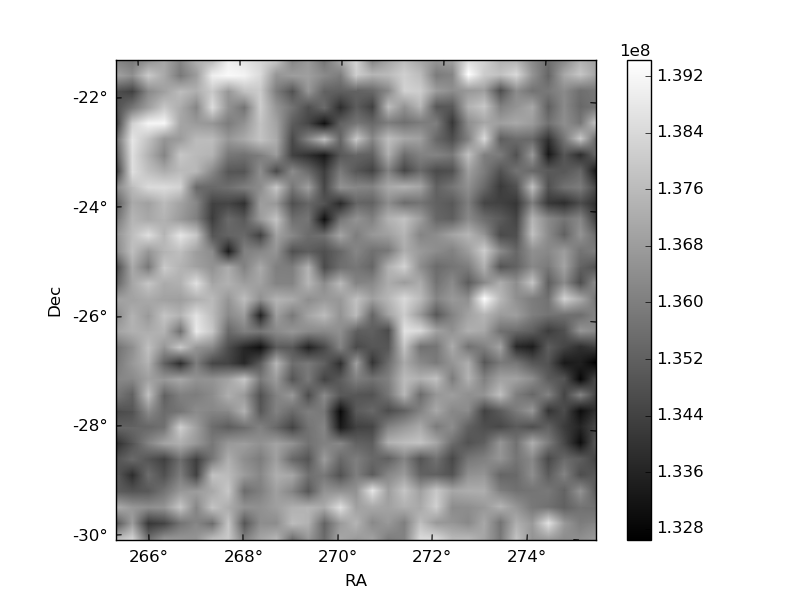
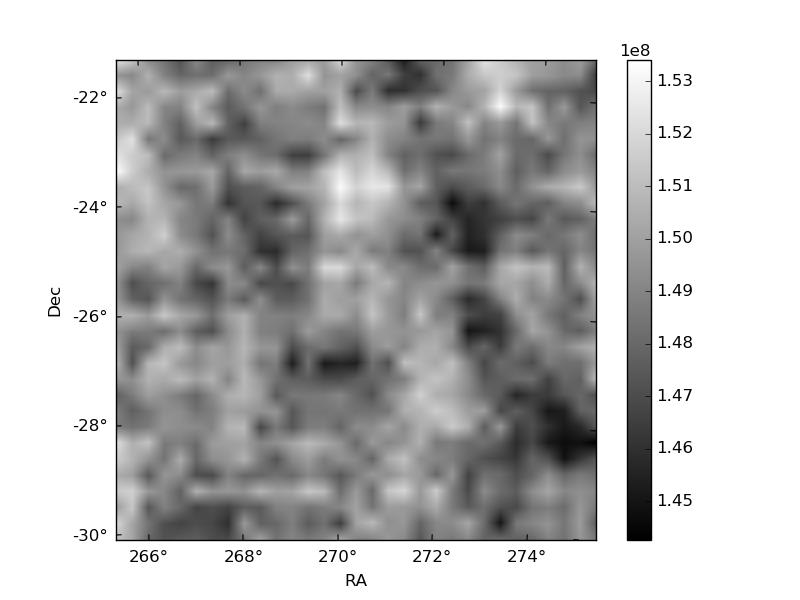
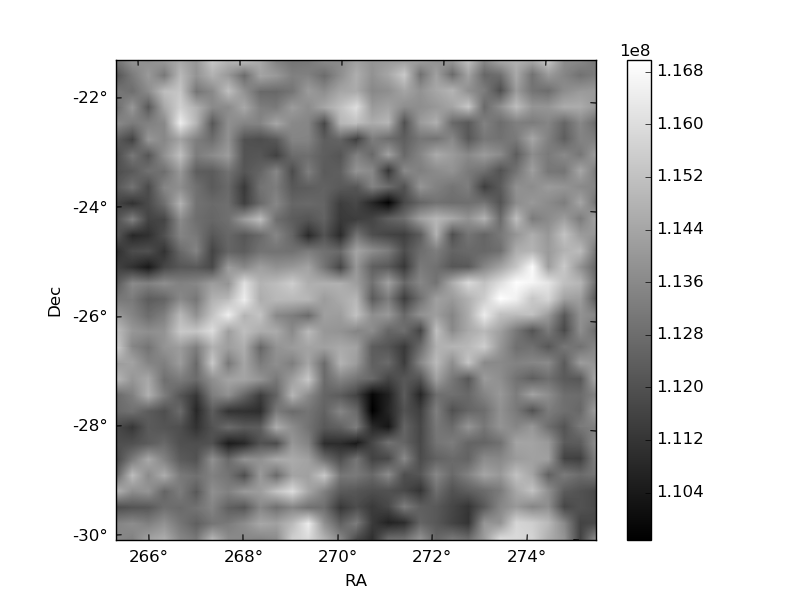
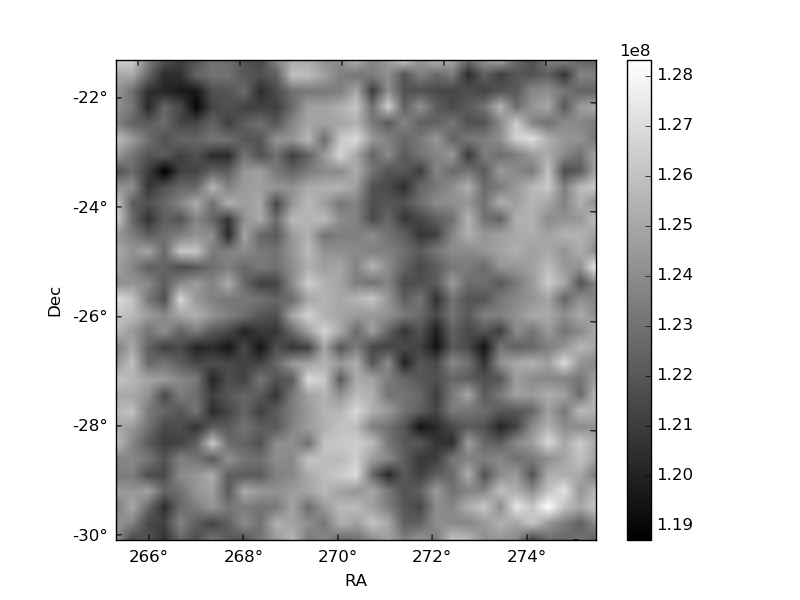
Histogram calculated using DETX and DETY for each event in the final _common_clean file
| Quadrant A | 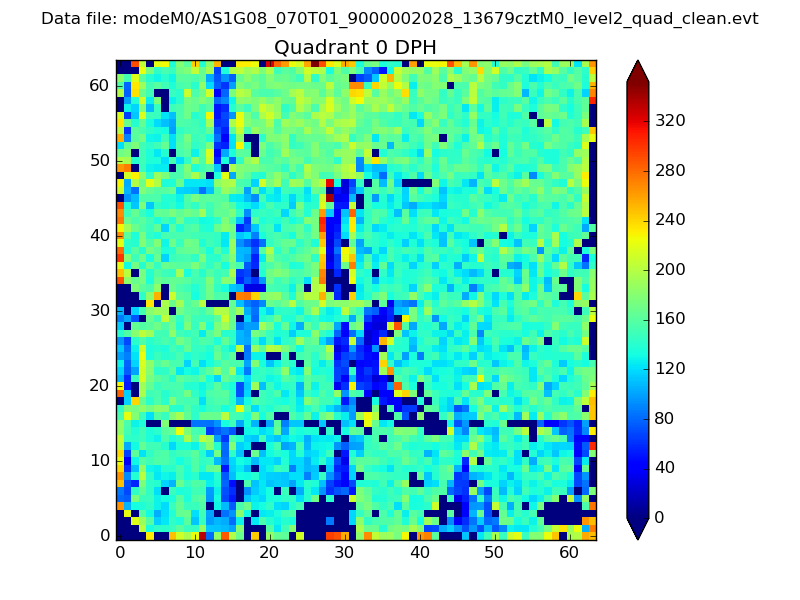 |
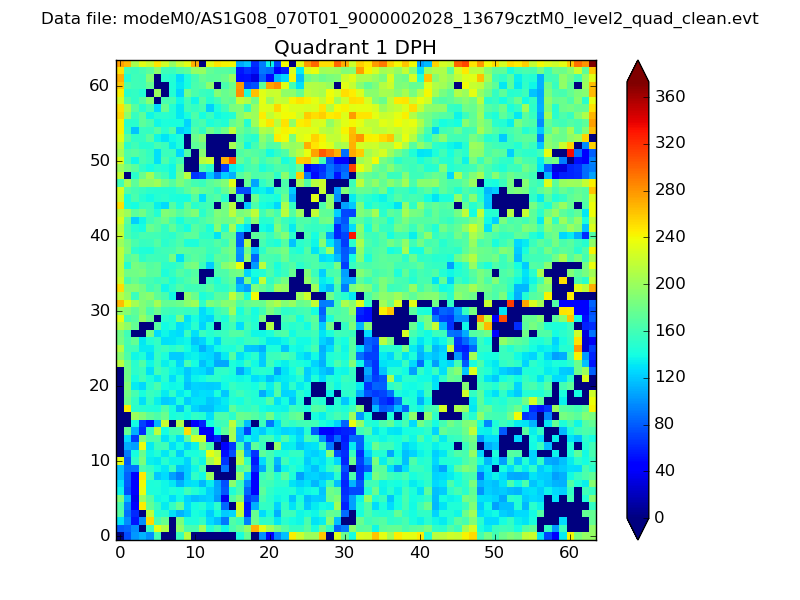 |
Quadrant B |
|---|---|---|---|
| Quadrant D |  |
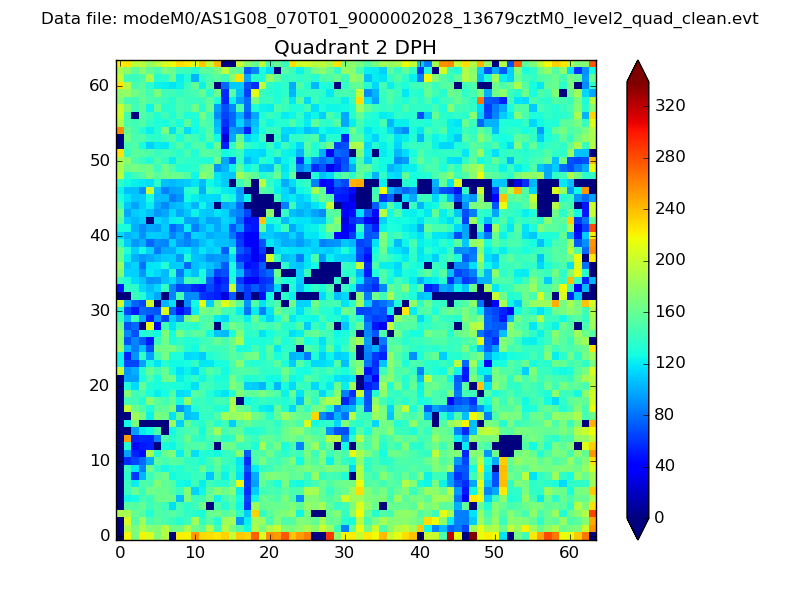 |
Quadrant C |
| Plot type | Count rate plots | Images |
|---|---|---|
| Comparison with Poisson distribution Blue bars denote a histogram of data divided into 1 sec bins. Red curve is a Poisson curve with rate = median count rate of data. |
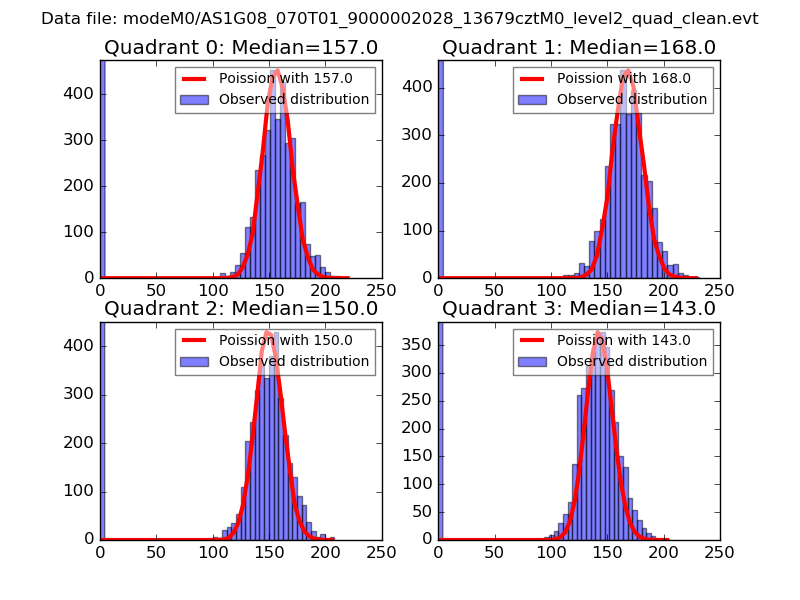 |
 |
| Quadrant-wise count rates Data is divided into 100 sec bins |
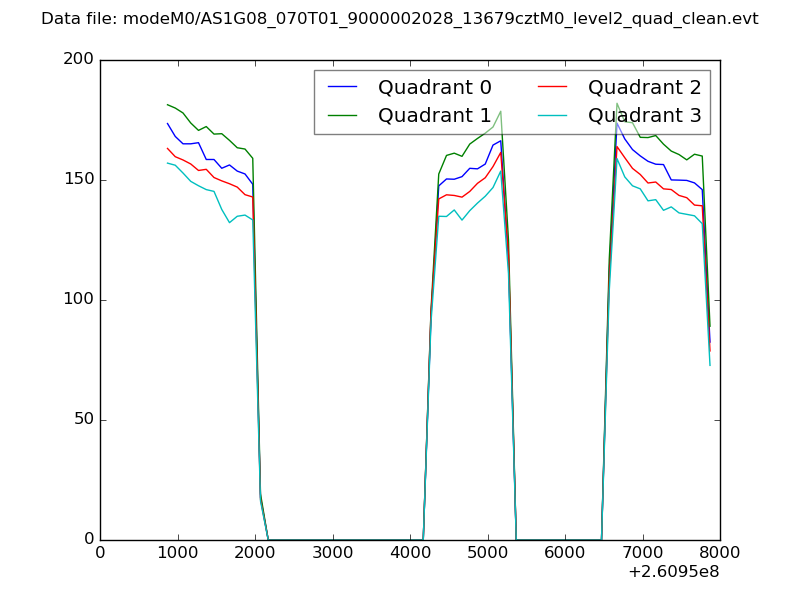 |
|
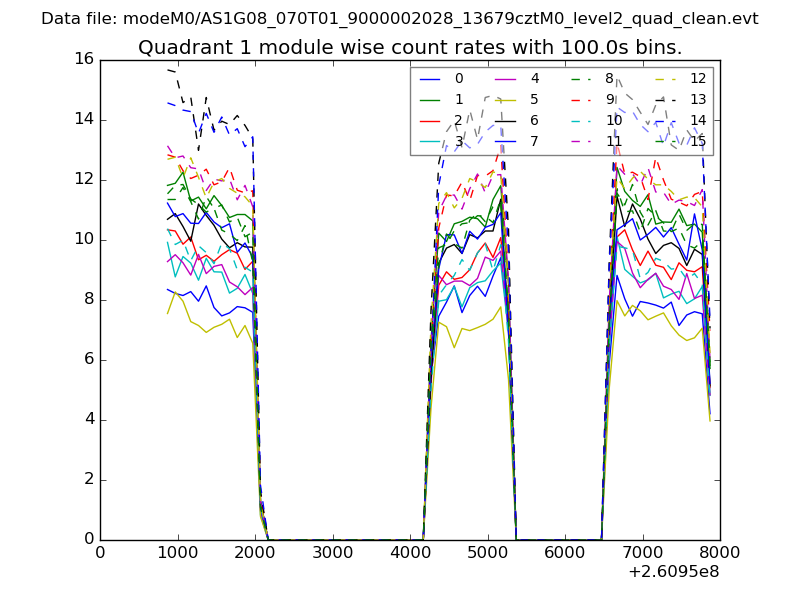
| Module-wise count rates for Quadrant A Data is divided into 100 sec bins |
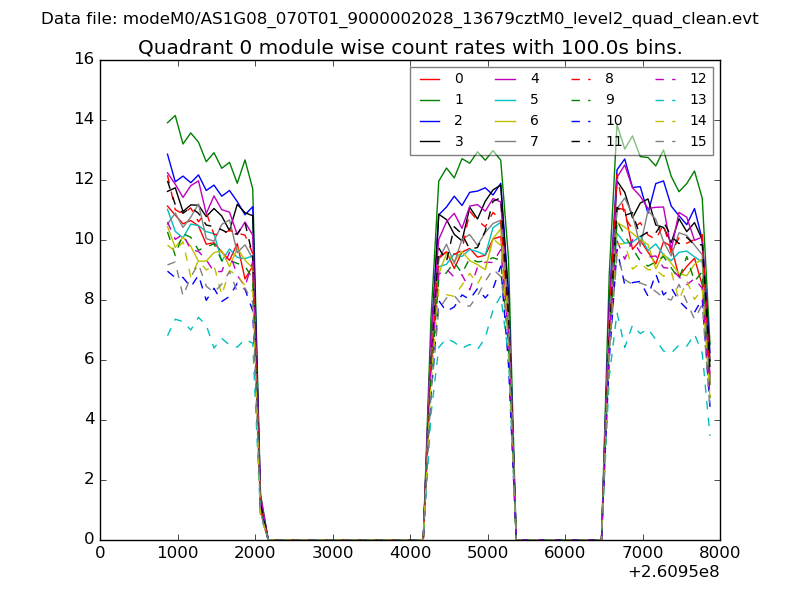 |
 |
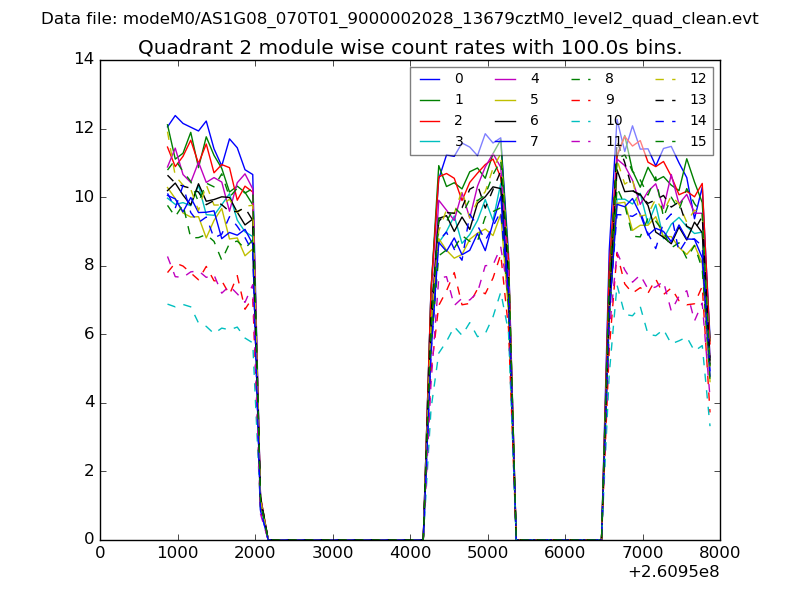
| Module-wise count rates for Quadrant B Data is divided into 100 sec bins |
 |
 |
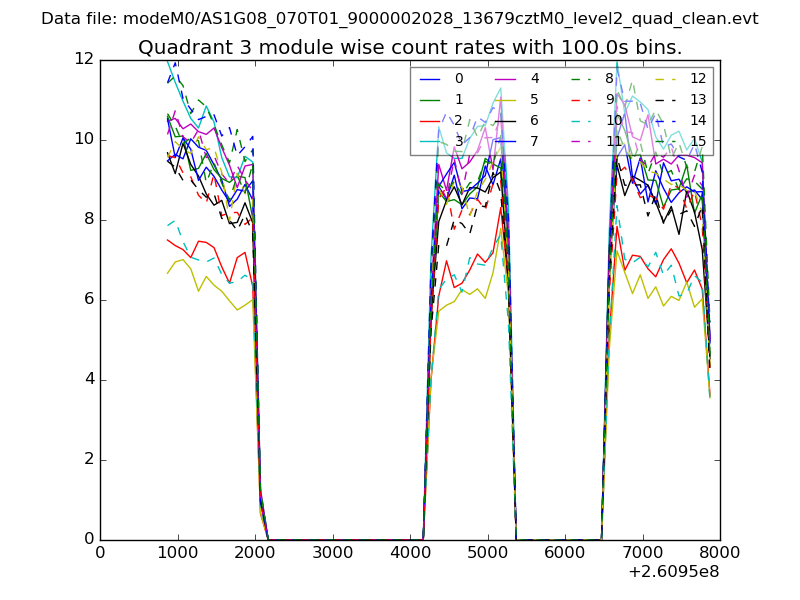
| Module-wise count rates for Quadrant C Data is divided into 100 sec bins |
 |
 |
| Module-wise count rates for Quadrant D Data is divided into 100 sec bins |
 |
 |
| Parameter | Plot |
|---|---|
| CZT HV Monitor | 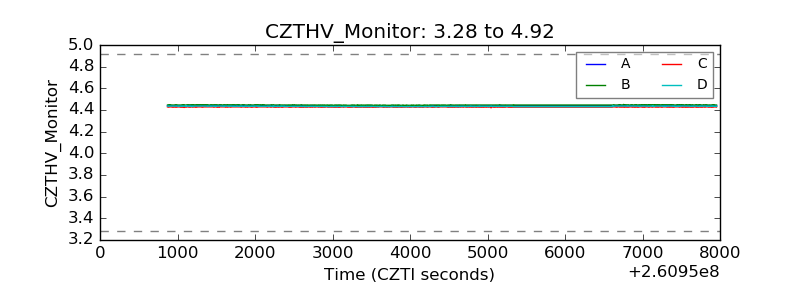 |
| D_VDD | 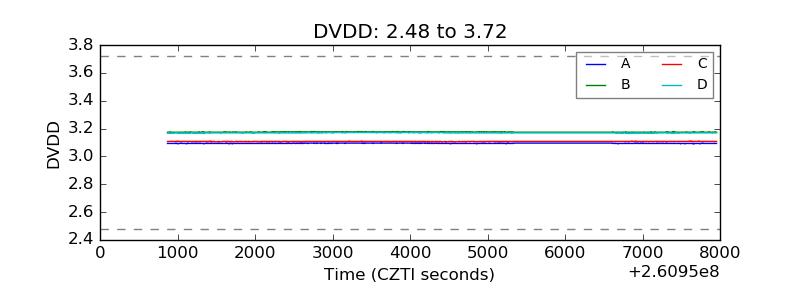 |
| Temperature 1 | 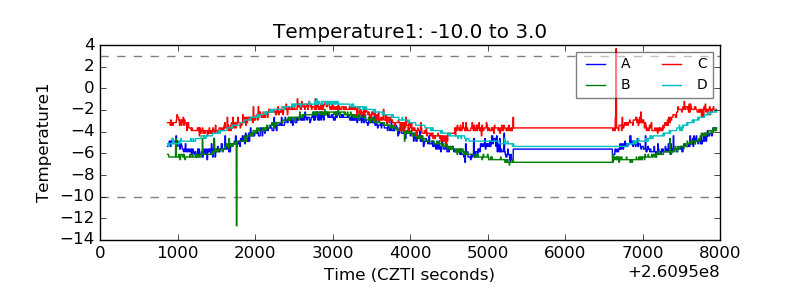 |
| Veto HV Monitor | 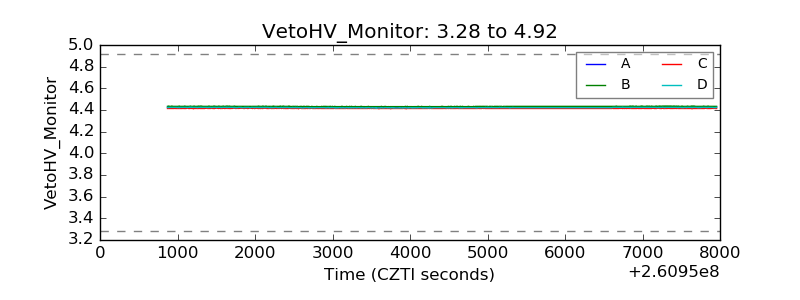 |
| Veto LLD | 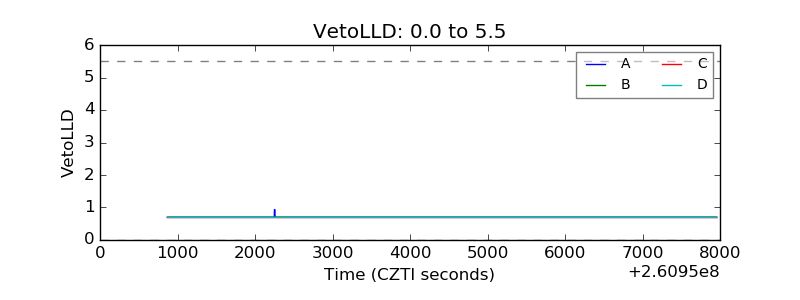 |
| Alpha Counter | 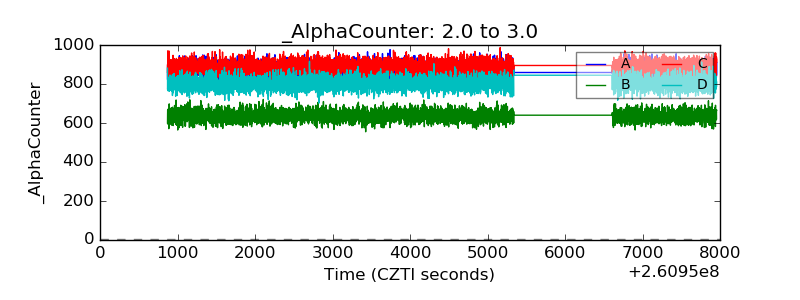 |
| _CPM_Rate | 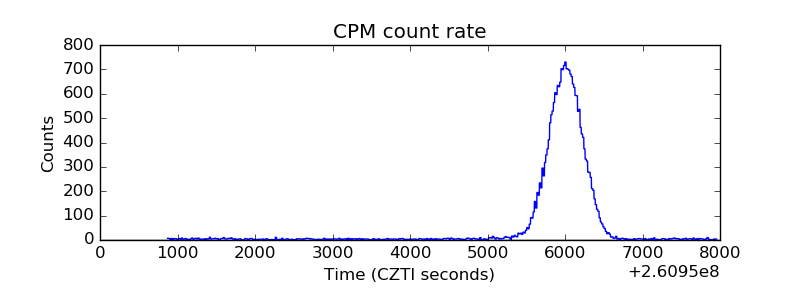 |
| CZT Counter | 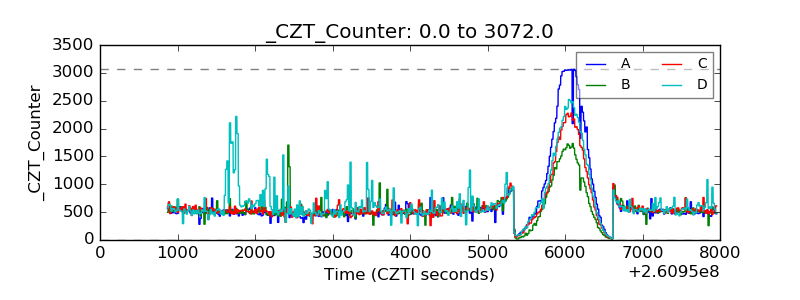 |
| +2.5 Volts monitor |  |
| +5 Volts monitor | 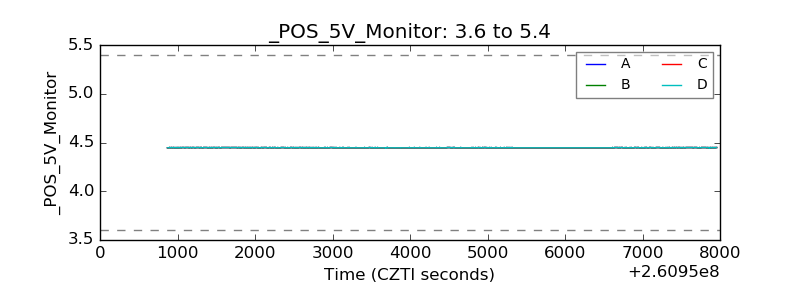 |
| _ROLL_ROT | 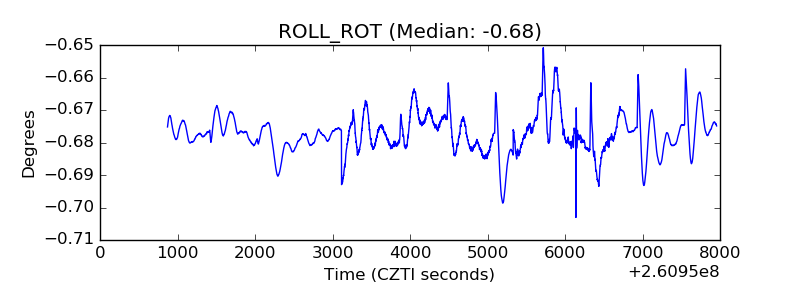 |
| _Roll_DEC | 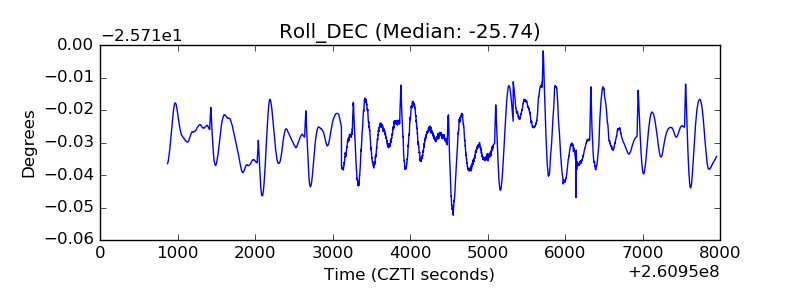 |
| _Roll_RA | 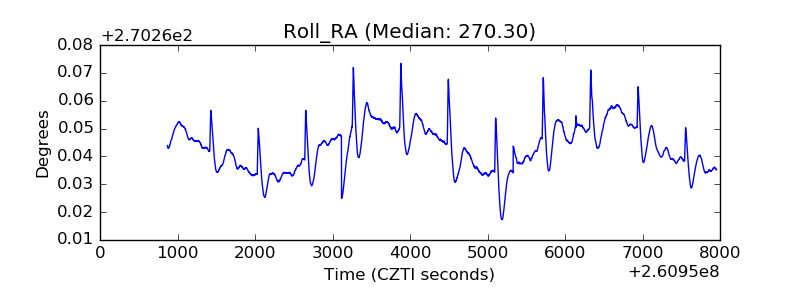 |
| Veto Counter | 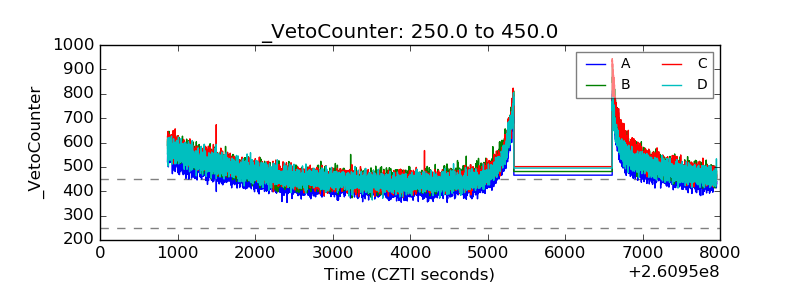 |