| Param | Original file | Final file |
|---|---|---|
| Filename | modeM0/AS1G08_070T01_9000002028_13680cztM0_level2.evt | modeM0/AS1G08_070T01_9000002028_13680cztM0_level2_quad_clean.evt |
| Size (bytes) | 507,294,720 | 87,462,720 |
| Size | 483.8 MB | 83.4 MB |
| Events in quadrant A | 3,179,372 | 562,461 |
| Events in quadrant B | 3,550,580 | 594,260 |
| Events in quadrant C | 3,344,834 | 537,060 |
| Events in quadrant D | 4,855,146 | 508,931 |
| Mode SS | |||
|---|---|---|---|
| Quadrant | BADHDUFLAG | Total packets | Discarded packets |
| A | 0 | 130 | 0 |
| B | 0 | 130 | 0 |
| C | 0 | 130 | 0 |
| D | 0 | 130 | 0 |
| Mode M9 | |||
|---|---|---|---|
| Quadrant | BADHDUFLAG | Total packets | Discarded packets |
| A | 0 | 10 | 0 |
| B | 0 | 10 | 0 |
| C | 0 | 10 | 0 |
| D | 0 | 10 | 0 |
| Mode M0 | |||
|---|---|---|---|
| Quadrant | BADHDUFLAG | Total packets | Discarded packets |
| A | 0 | 13181 | 2 |
| B | 0 | 14278 | 1 |
| C | 0 | 13468 | 1 |
| D | 0 | 18716 | 1 |
| Quadrant | Total seconds | Saturated seconds | Saturation percentage |
|---|---|---|---|
| A | 6391 | 97 | 1.517759% |
| B | 6391 | 153 | 2.393992% |
| C | 6391 | 70 | 1.095290% |
| D | 6391 | 228 | 3.567517% |
Noise dominated data is calculated using 1-second bins in cleaned event files. If a bin has >2000 counts, and if more than 50% of those come from <1% of pixels, then it is considered to be noise-dominated and hence unusable.
| Quadrant | # 1 sec bins | Bins with >0 counts | Bins with >2000 counts | High rate bins dominated by noise | Noise dominated (total time) | Noise dominated (detector-on time) | Marked lightcurve |
|---|---|---|---|---|---|---|---|
| A | 7381 | 6392 | 0 | 0 | 0.00% | 0.00% | 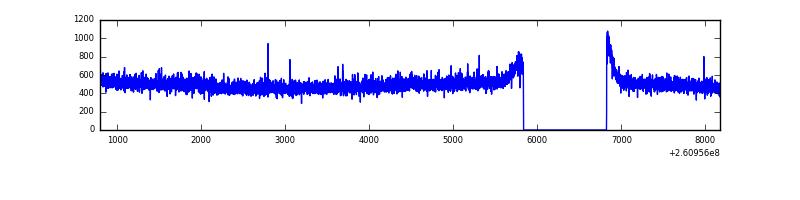 |
| B | 7382 | 6393 | 48 | 48 | 0.65% | 0.75% | 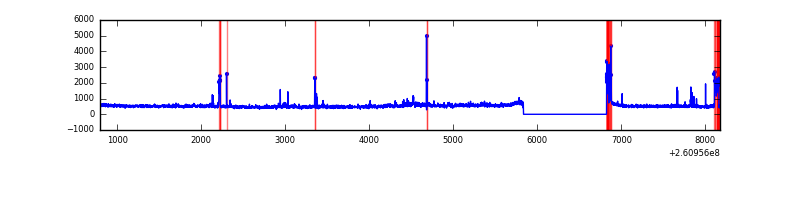 |
| C | 7381 | 6392 | 0 | 0 | 0.00% | 0.00% |  |
| D | 7381 | 6392 | 120 | 120 | 1.63% | 1.88% | 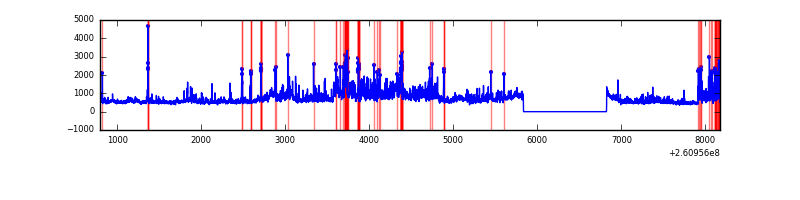 |
Top three noisy pixels from each quadrant. If the there are fewer than three noisy pixels in the level2.evt file, extra rows are filled as -1
| Pixel properties | Quadrant properties | ||||||
|---|---|---|---|---|---|---|---|
| Quadrant | DetID | PixID | Counts | Sigma | Mean | Median | Sigma |
| A | 1 | 162 | 14335 | 81.06 | 821 | 805 | 166.9 |
| A | 0 | 226 | 7303 | 38.93 | 821 | 805 | 166.9 |
| A | 12 | 194 | 6255 | 32.65 | 821 | 805 | 166.9 |
| B | 3 | 64 | 185250 | 1194.99 | 819 | 803 | 154.3 |
| B | 0 | 219 | 135546 | 872.97 | 819 | 803 | 154.3 |
| B | 12 | 111 | 17471 | 107.99 | 819 | 803 | 154.3 |
| C | 3 | 233 | 258415 | 1412.81 | 791 | 798 | 182.3 |
| C | 13 | 61 | 5793 | 27.39 | 791 | 798 | 182.3 |
| C | 14 | 234 | 2809 | 11.03 | 791 | 798 | 182.3 |
| D | 5 | 222 | 887120 | 4282.29 | 779 | 766 | 207.0 |
| D | 13 | 122 | 473011 | 2281.58 | 779 | 766 | 207.0 |
| D | 8 | 195 | 249280 | 1200.66 | 779 | 766 | 207.0 |
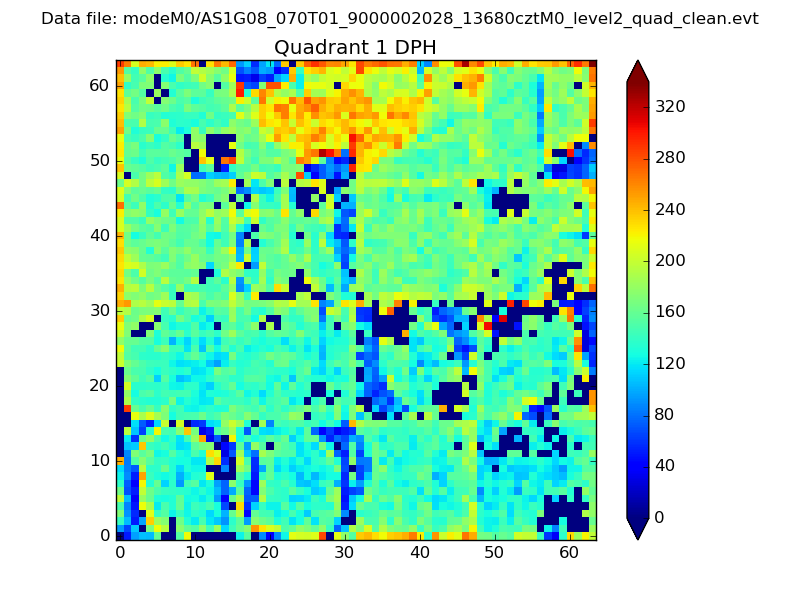
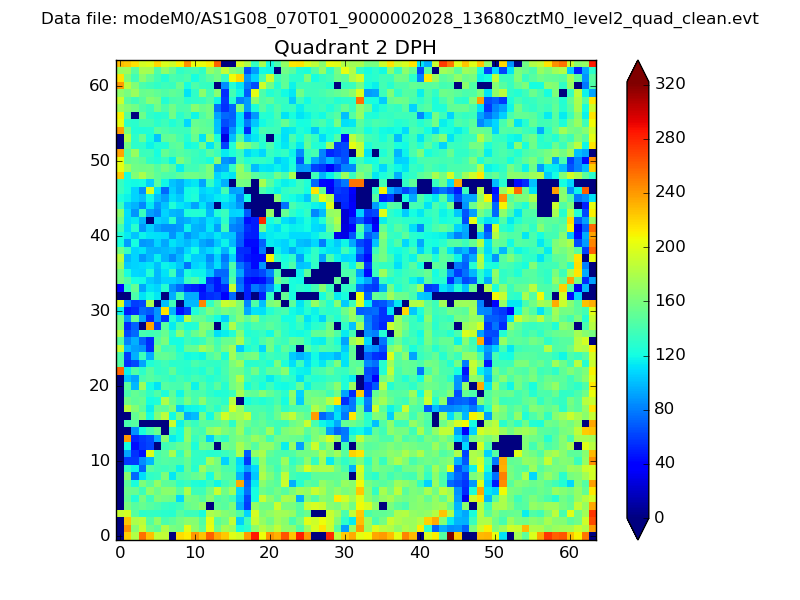
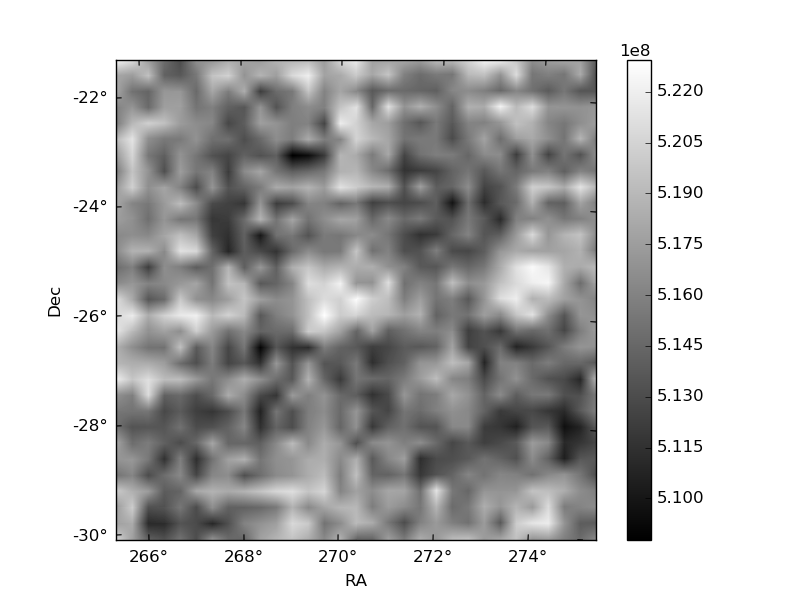
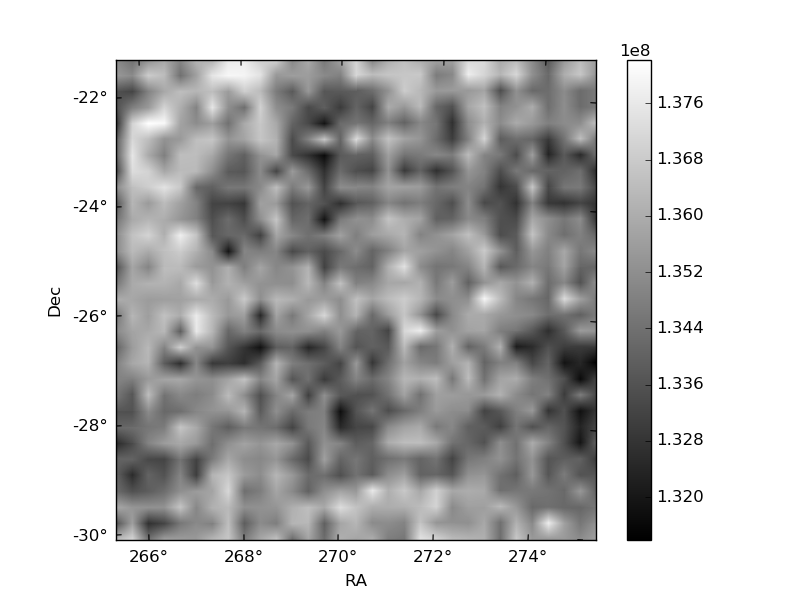
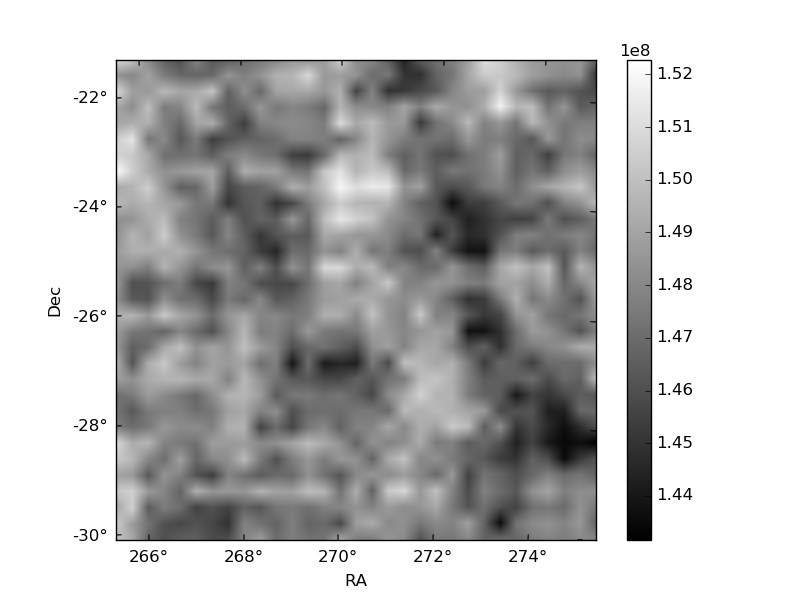
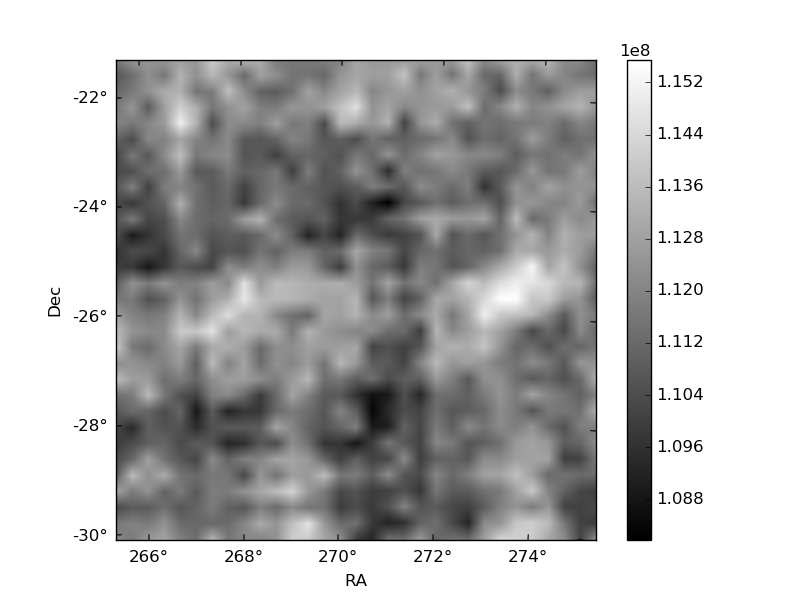
Histogram calculated using DETX and DETY for each event in the final _common_clean file
| Quadrant A | 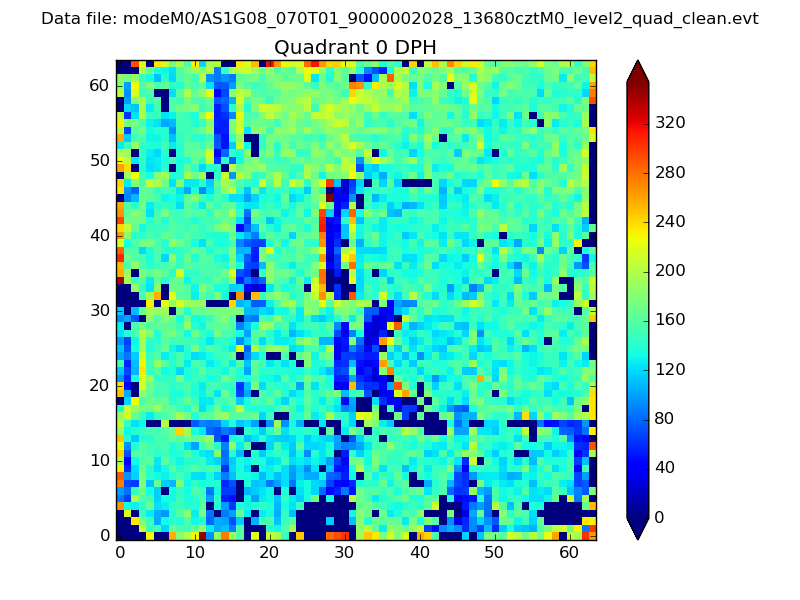 |
 |
Quadrant B |
|---|---|---|---|
| Quadrant D | 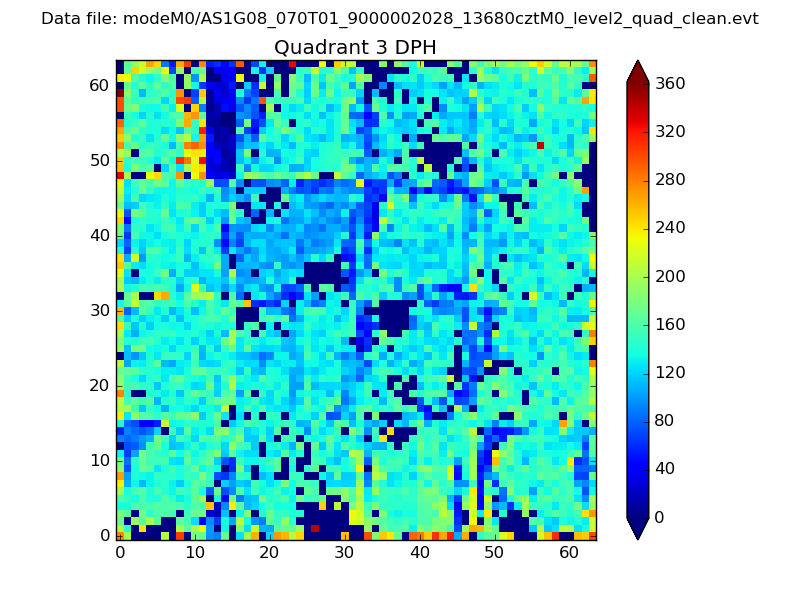 |
 |
Quadrant C |
| Plot type | Count rate plots | Images |
|---|---|---|
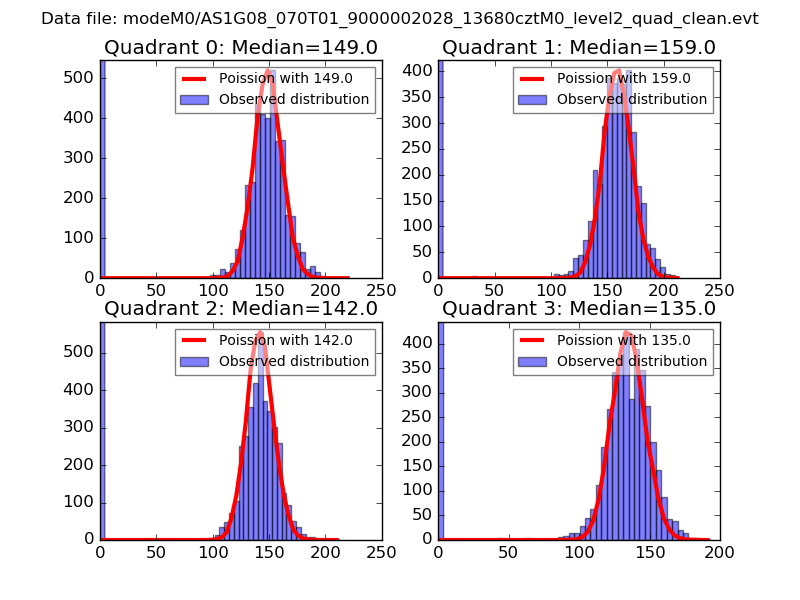
| Comparison with Poisson distribution Blue bars denote a histogram of data divided into 1 sec bins. Red curve is a Poisson curve with rate = median count rate of data. |
 |
 |
| Quadrant-wise count rates Data is divided into 100 sec bins |
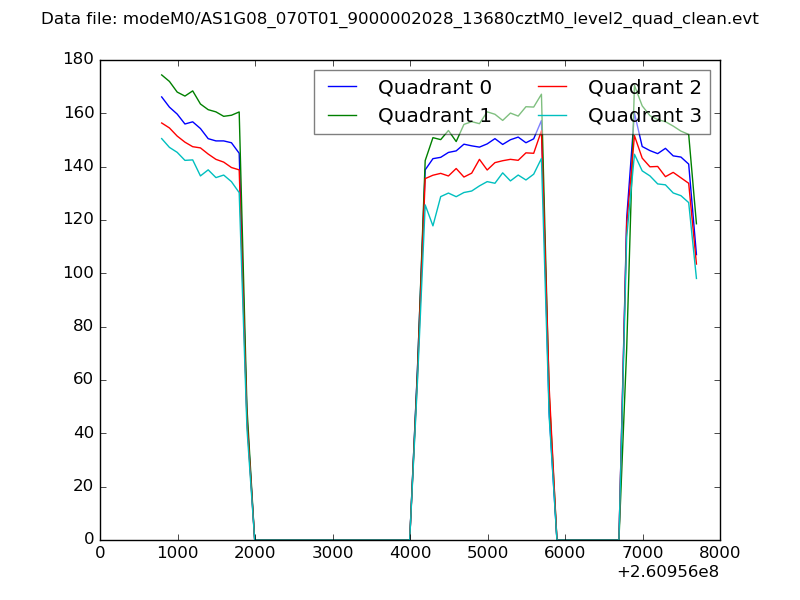 |
|
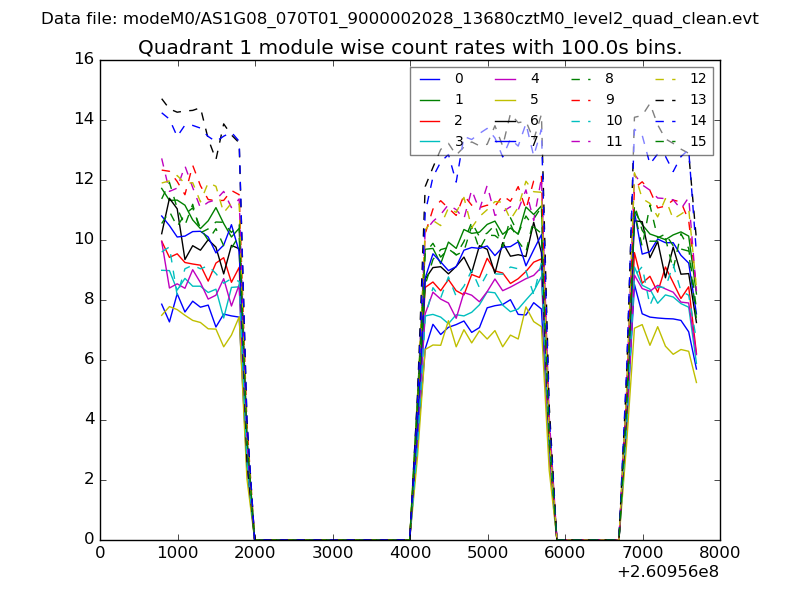
| Module-wise count rates for Quadrant A Data is divided into 100 sec bins |
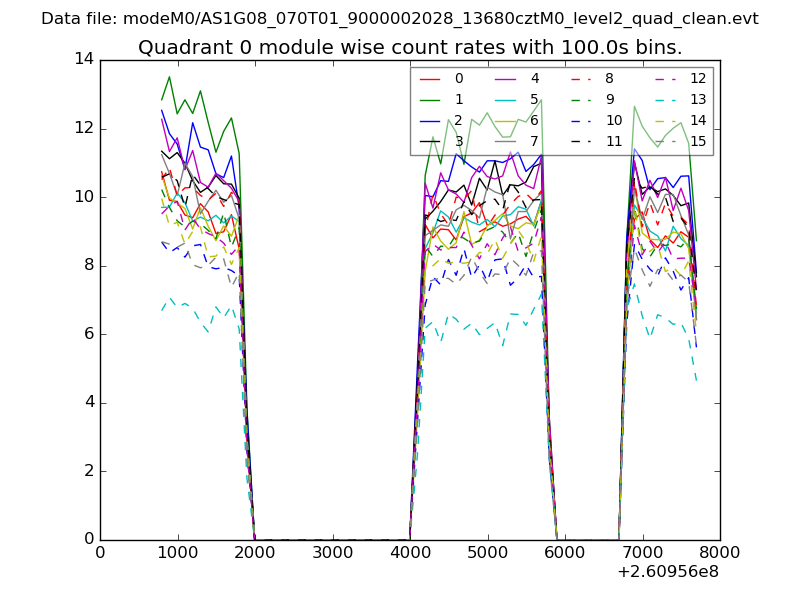 |
 |
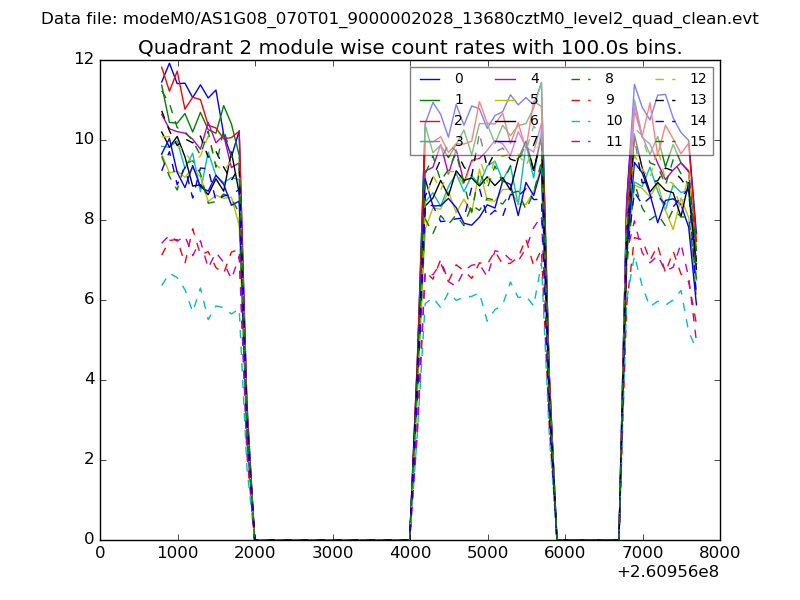
| Module-wise count rates for Quadrant B Data is divided into 100 sec bins |
 |
 |
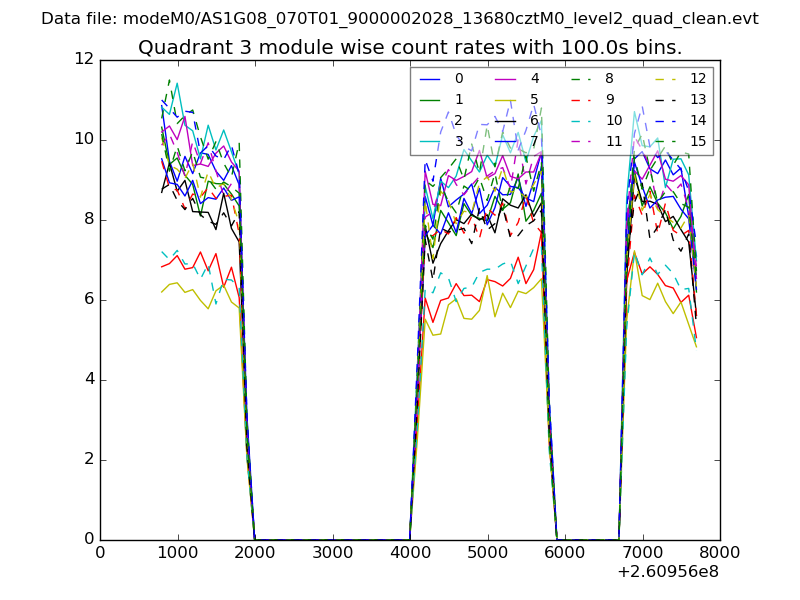
| Module-wise count rates for Quadrant C Data is divided into 100 sec bins |
 |
 |
| Module-wise count rates for Quadrant D Data is divided into 100 sec bins |
 |
 |
| Parameter | Plot |
|---|---|
| CZT HV Monitor | 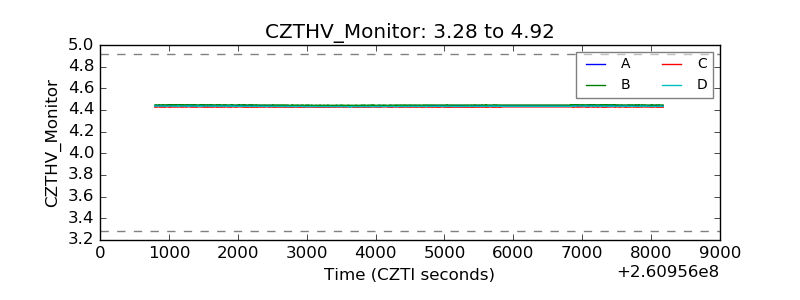 |
| D_VDD | 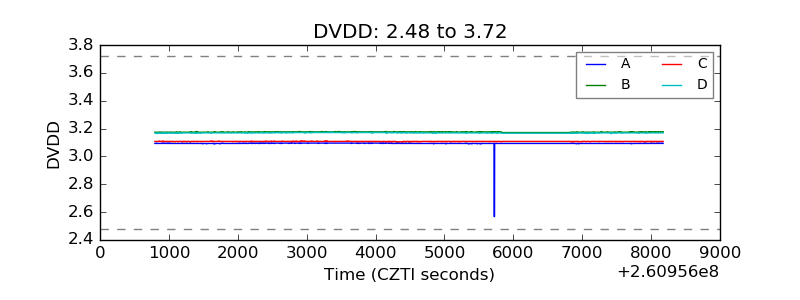 |
| Temperature 1 | 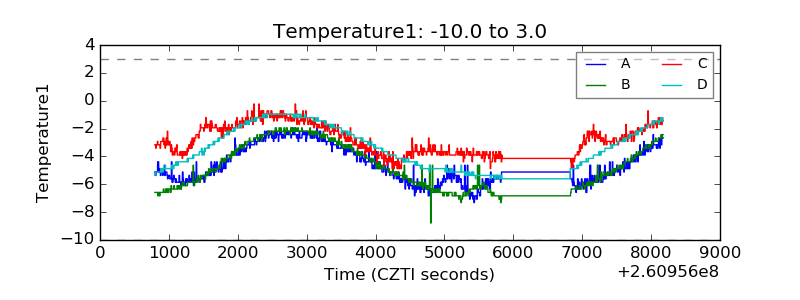 |
| Veto HV Monitor | 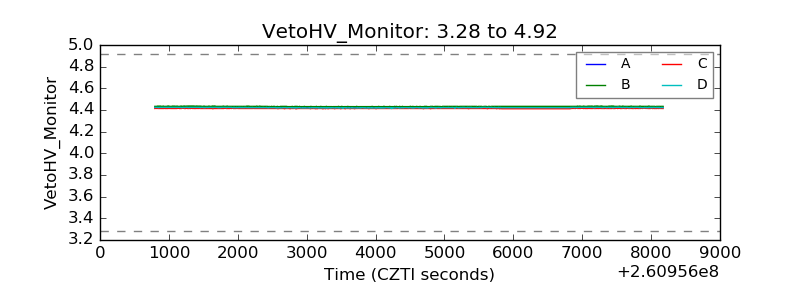 |
| Veto LLD | 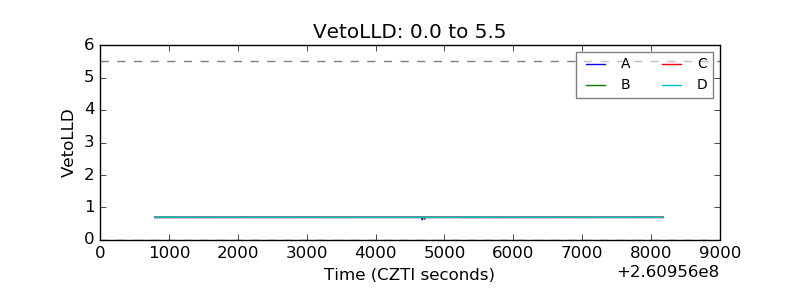 |
| Alpha Counter | 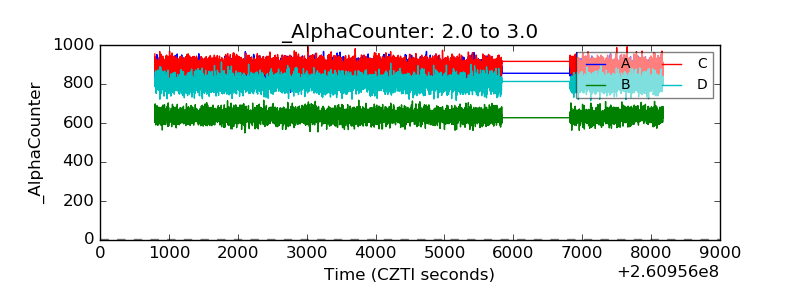 |
| _CPM_Rate | 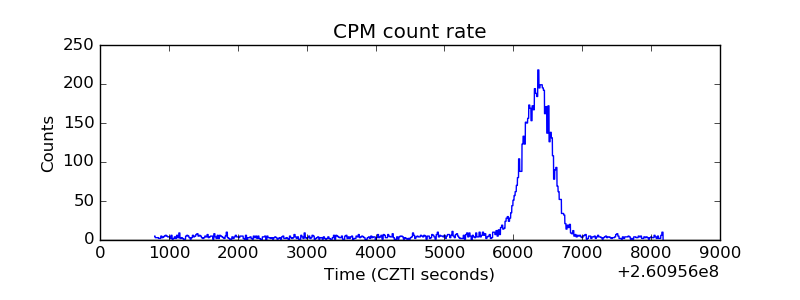 |
| CZT Counter | 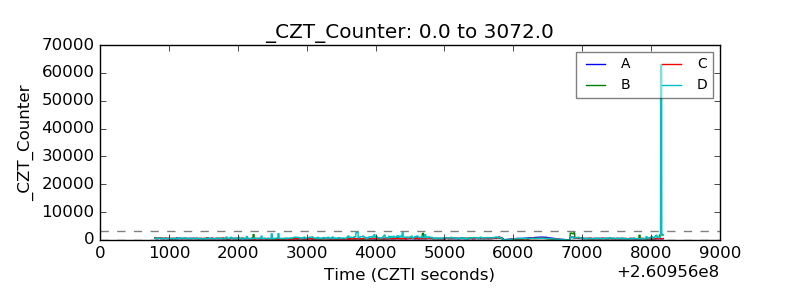 |
| +2.5 Volts monitor |  |
| +5 Volts monitor |  |
| _ROLL_ROT |  |
| _Roll_DEC | 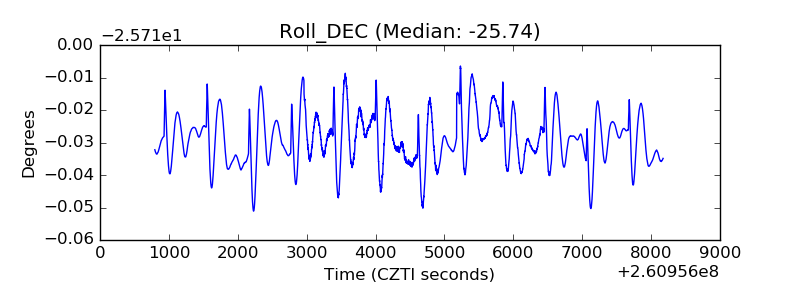 |
| _Roll_RA | 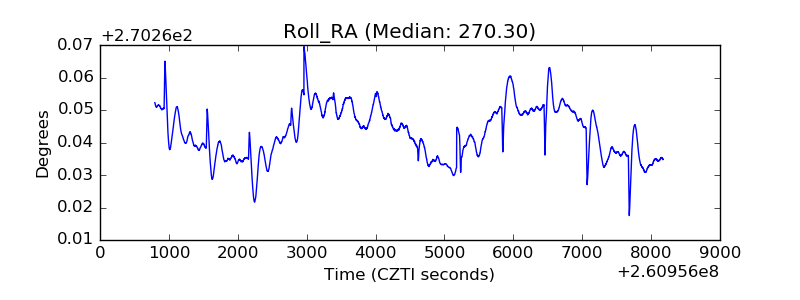 |
| Veto Counter | 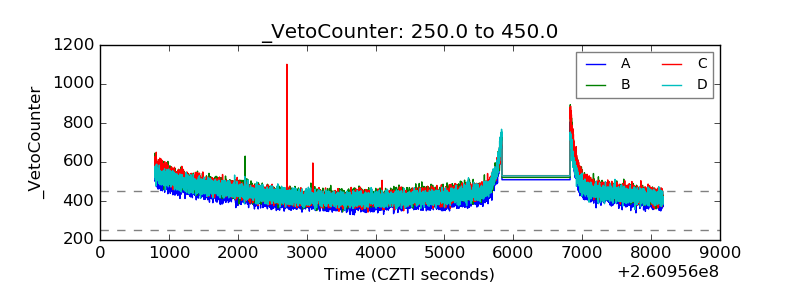 |