| Param | Original file | Final file |
|---|---|---|
| Filename | modeM0/AS1G08_070T01_9000002028_13681cztM0_level2.evt | modeM0/AS1G08_070T01_9000002028_13681cztM0_level2_quad_clean.evt |
| Size (bytes) | 545,313,600 | 89,602,560 |
| Size | 520.1 MB | 85.5 MB |
| Events in quadrant A | 3,538,692 | 563,645 |
| Events in quadrant B | 4,191,574 | 595,258 |
| Events in quadrant C | 3,764,102 | 537,960 |
| Events in quadrant D | 4,529,656 | 512,660 |
| Mode SS | |||
|---|---|---|---|
| Quadrant | BADHDUFLAG | Total packets | Discarded packets |
| A | 0 | 146 | 0 |
| B | 0 | 146 | 0 |
| C | 0 | 146 | 0 |
| D | 0 | 146 | 0 |
| Mode M9 | |||
|---|---|---|---|
| Quadrant | BADHDUFLAG | Total packets | Discarded packets |
| A | 0 | 6 | 0 |
| B | 0 | 6 | 0 |
| C | 0 | 6 | 0 |
| D | 0 | 6 | 0 |
| Mode M0 | |||
|---|---|---|---|
| Quadrant | BADHDUFLAG | Total packets | Discarded packets |
| A | 0 | 14968 | 3 |
| B | 0 | 16725 | 2 |
| C | 0 | 15392 | 2 |
| D | 0 | 18104 | 2 |
| Quadrant | Total seconds | Saturated seconds | Saturation percentage |
|---|---|---|---|
| A | 7238 | 134 | 1.851340% |
| B | 7238 | 260 | 3.592153% |
| C | 7238 | 107 | 1.478309% |
| D | 7238 | 170 | 2.348715% |
Noise dominated data is calculated using 1-second bins in cleaned event files. If a bin has >2000 counts, and if more than 50% of those come from <1% of pixels, then it is considered to be noise-dominated and hence unusable.
| Quadrant | # 1 sec bins | Bins with >0 counts | Bins with >2000 counts | High rate bins dominated by noise | Noise dominated (total time) | Noise dominated (detector-on time) | Marked lightcurve |
|---|---|---|---|---|---|---|---|
| A | 7819 | 7241 | 0 | 0 | 0.00% | 0.00% | 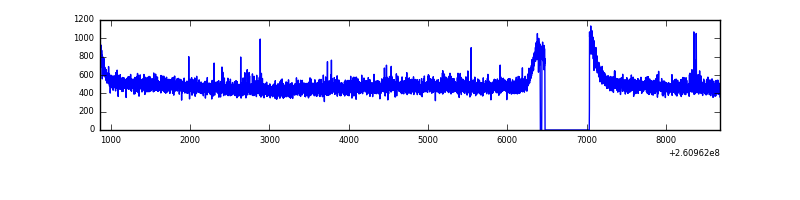 |
| B | 7819 | 7241 | 67 | 67 | 0.86% | 0.93% | 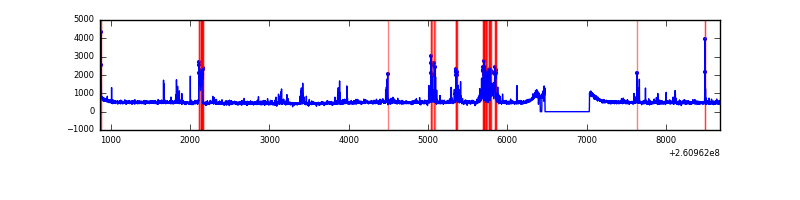 |
| C | 7819 | 7241 | 2 | 2 | 0.03% | 0.03% | 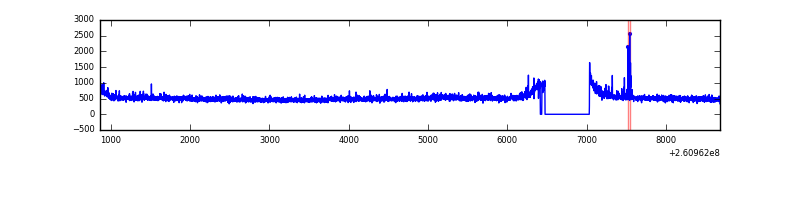 |
| D | 7819 | 7241 | 44 | 44 | 0.56% | 0.61% | 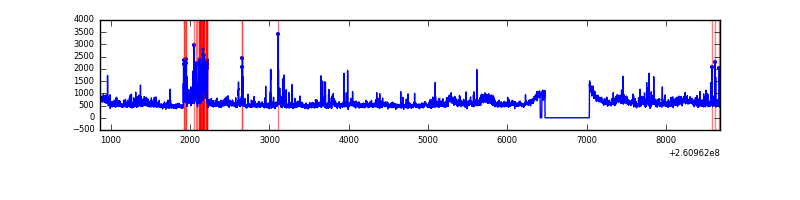 |
Top three noisy pixels from each quadrant. If the there are fewer than three noisy pixels in the level2.evt file, extra rows are filled as -1
| Pixel properties | Quadrant properties | ||||||
|---|---|---|---|---|---|---|---|
| Quadrant | DetID | PixID | Counts | Sigma | Mean | Median | Sigma |
| A | 1 | 162 | 14990 | 76.11 | 912 | 892 | 185.2 |
| A | 15 | 69 | 10229 | 50.41 | 912 | 892 | 185.2 |
| A | 0 | 226 | 7961 | 38.16 | 912 | 892 | 185.2 |
| B | 8 | 250 | 340292 | 1945.23 | 912 | 893 | 174.5 |
| B | 3 | 64 | 124096 | 706.13 | 912 | 893 | 174.5 |
| B | 0 | 219 | 85648 | 485.76 | 912 | 893 | 174.5 |
| C | 3 | 233 | 315529 | 1544.08 | 880 | 884 | 203.8 |
| C | 14 | 234 | 17868 | 83.35 | 880 | 884 | 203.8 |
| C | 13 | 61 | 6407 | 27.1 | 880 | 884 | 203.8 |
| D | 13 | 122 | 552285 | 2374.54 | 869 | 853 | 232.2 |
| D | 1 | 52 | 251049 | 1077.38 | 869 | 853 | 232.2 |
| D | 8 | 195 | 206356 | 884.92 | 869 | 853 | 232.2 |
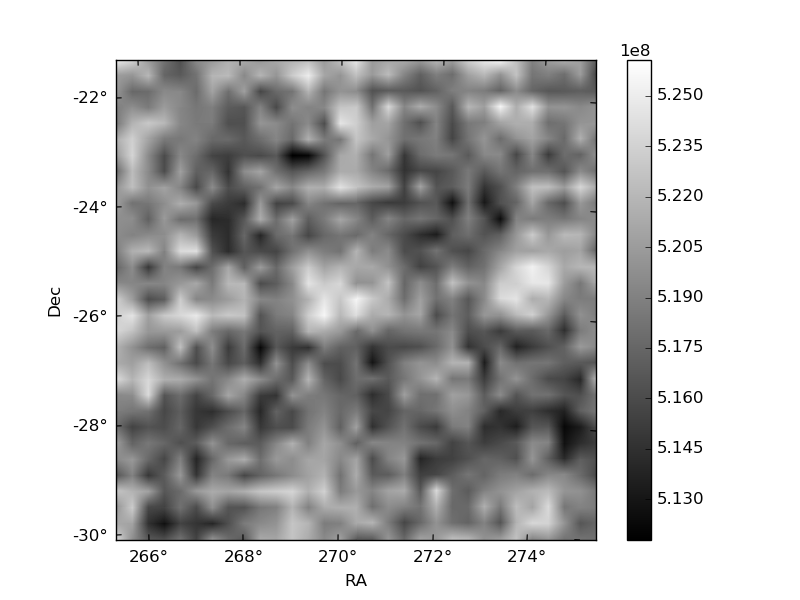
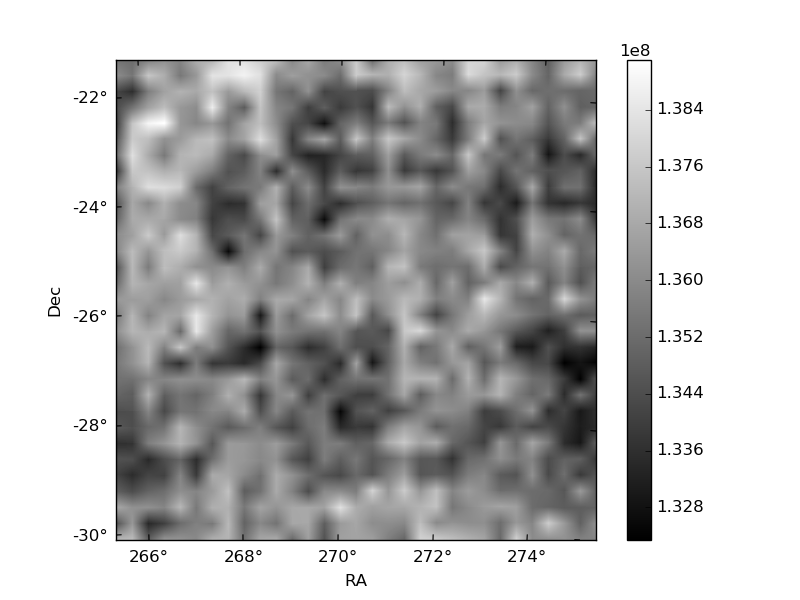
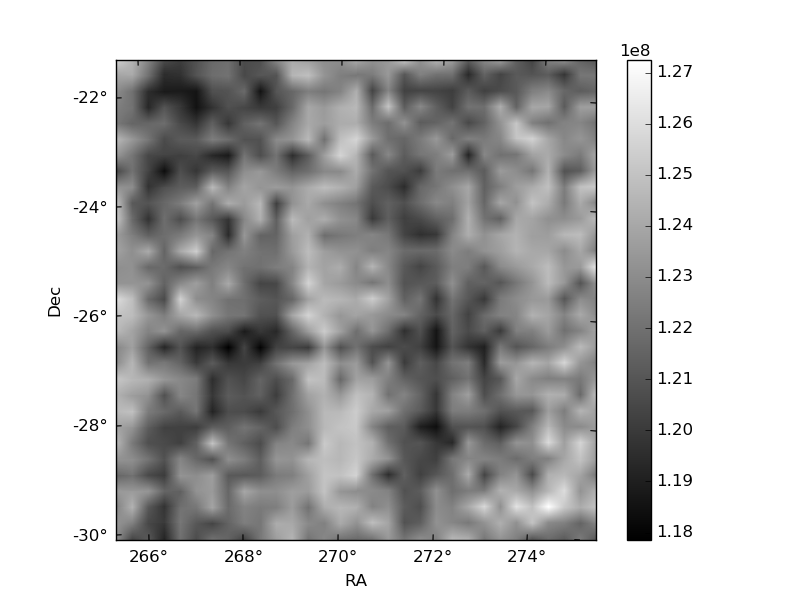
Histogram calculated using DETX and DETY for each event in the final _common_clean file
| Quadrant A | 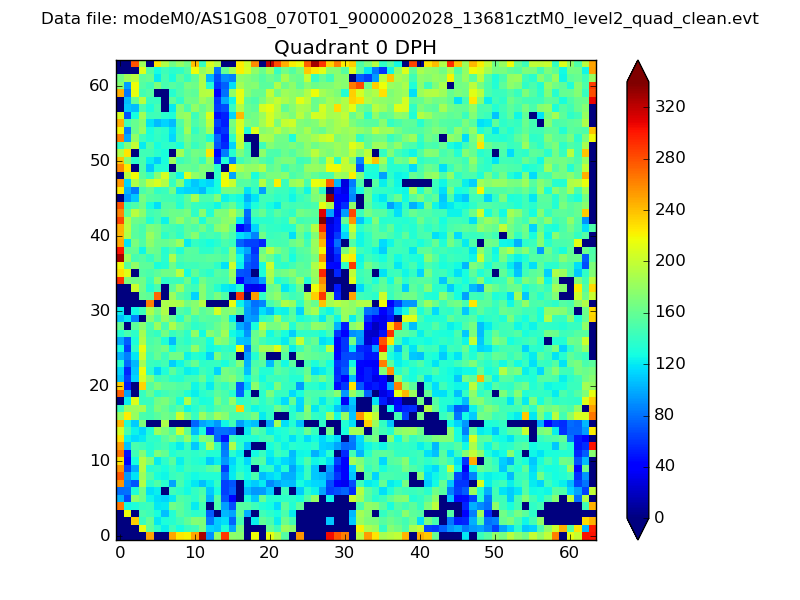 |
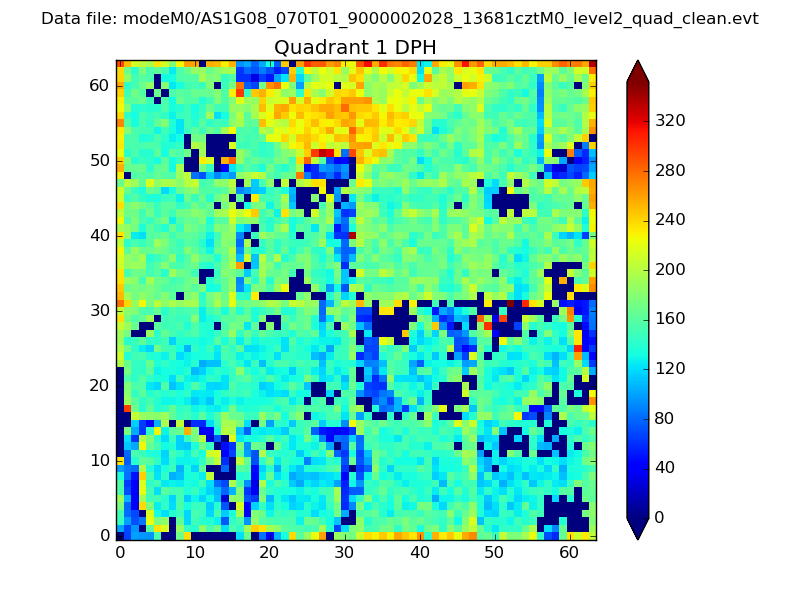 |
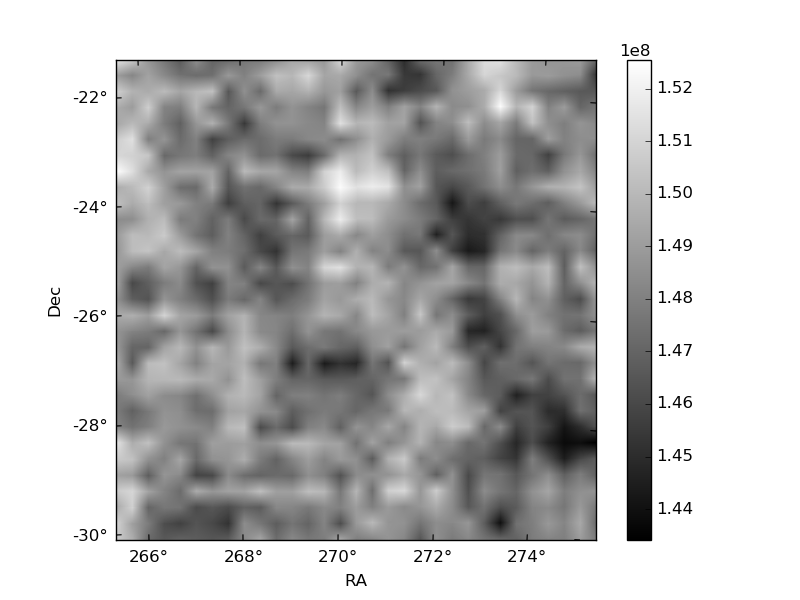
Quadrant B |
|---|---|---|---|
| Quadrant D | 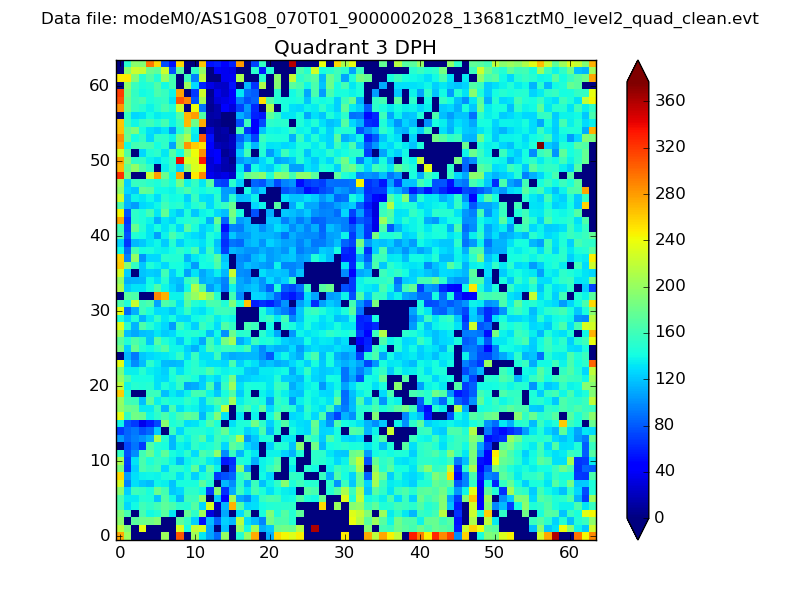 |
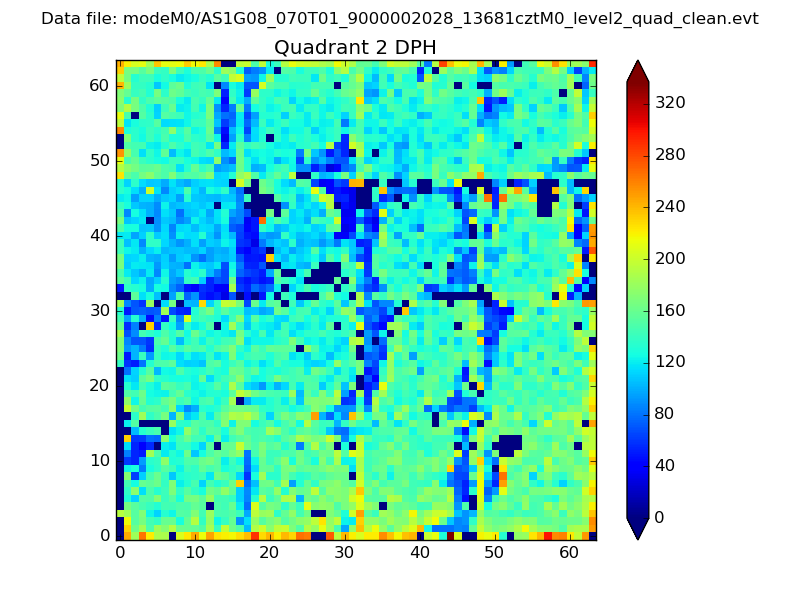 |
Quadrant C |
| Plot type | Count rate plots | Images |
|---|---|---|
| Comparison with Poisson distribution Blue bars denote a histogram of data divided into 1 sec bins. Red curve is a Poisson curve with rate = median count rate of data. |
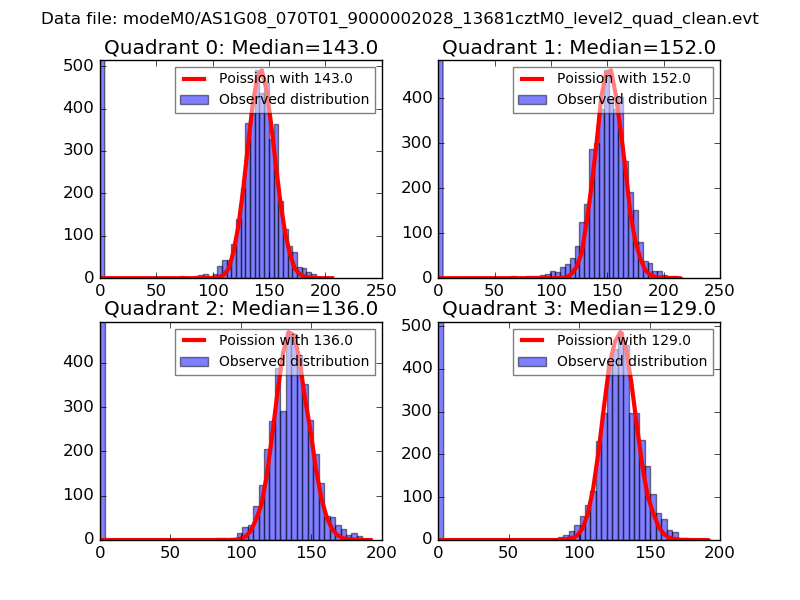 |
 |
| Quadrant-wise count rates Data is divided into 100 sec bins |
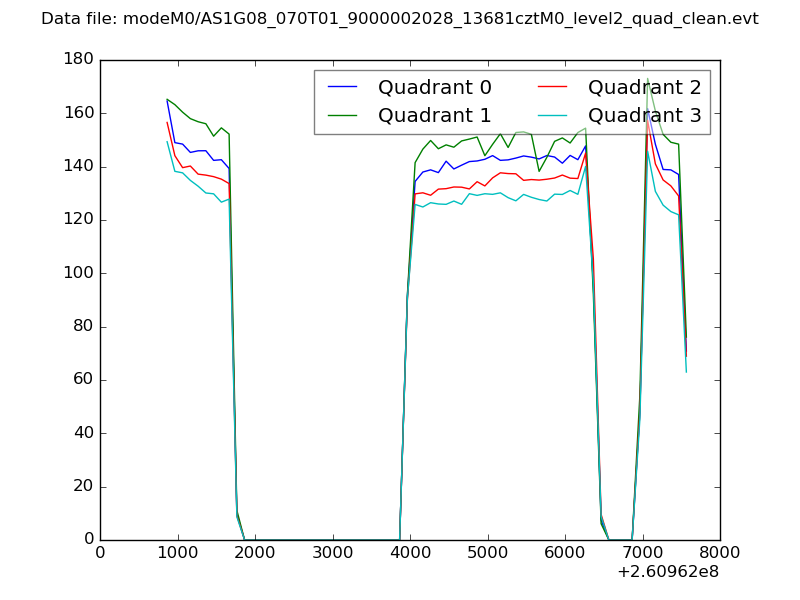 |
|
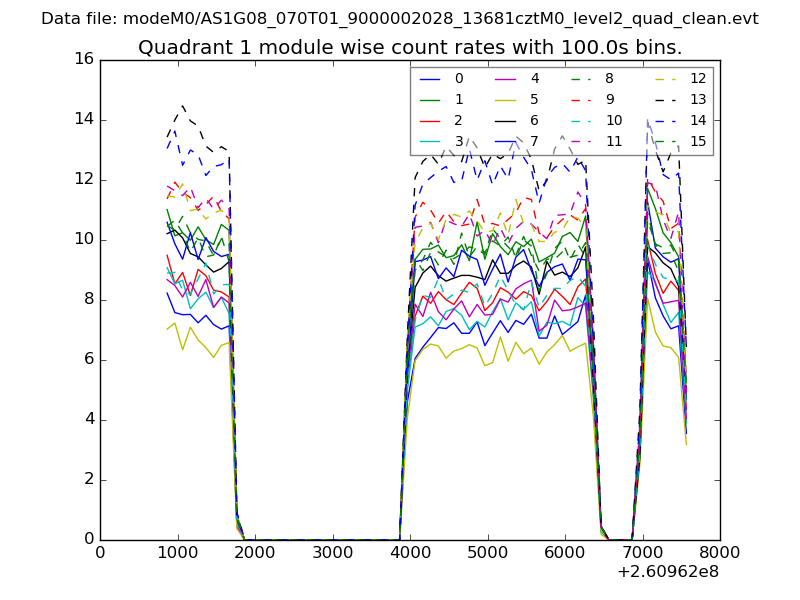
| Module-wise count rates for Quadrant A Data is divided into 100 sec bins |
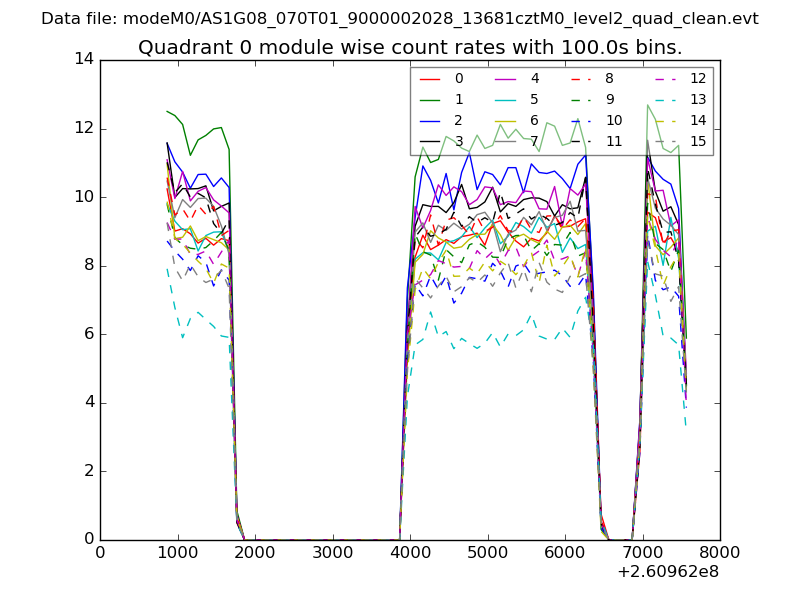 |
 |
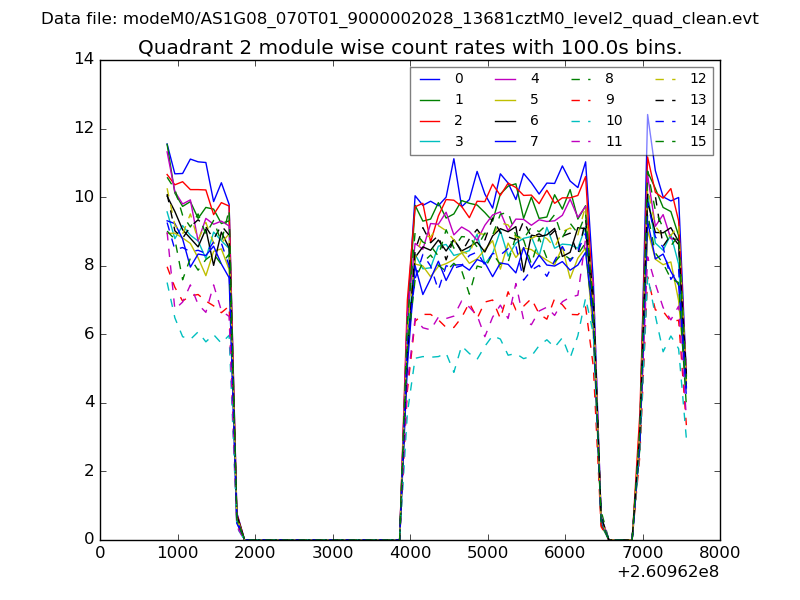
| Module-wise count rates for Quadrant B Data is divided into 100 sec bins |
 |
 |
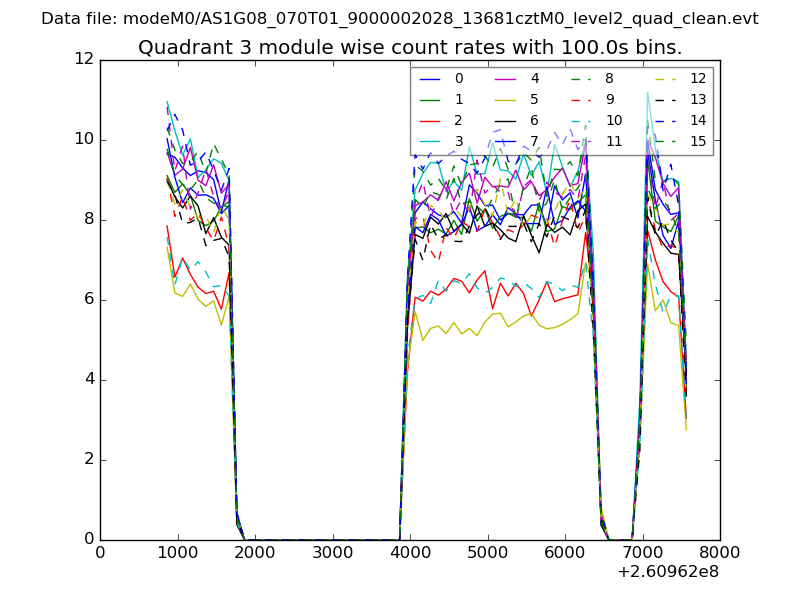
| Module-wise count rates for Quadrant C Data is divided into 100 sec bins |
 |
 |
| Module-wise count rates for Quadrant D Data is divided into 100 sec bins |
 |
 |
| Parameter | Plot |
|---|---|
| CZT HV Monitor | 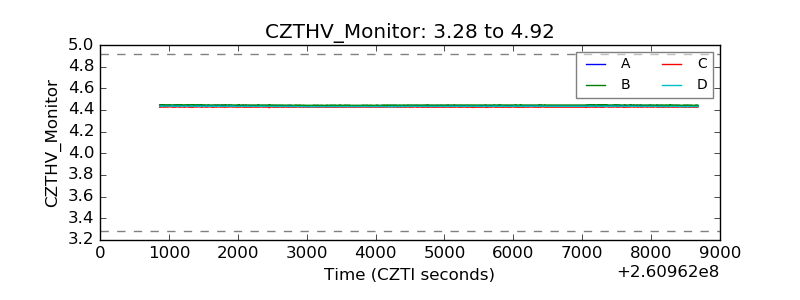 |
| D_VDD | 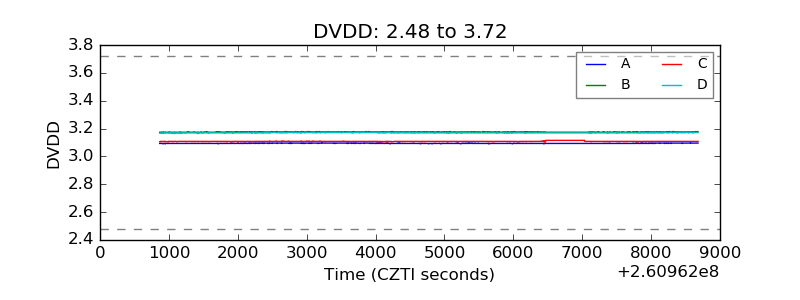 |
| Temperature 1 | 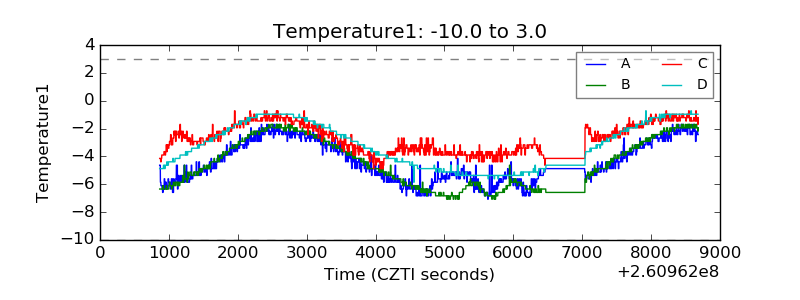 |
| Veto HV Monitor |  |
| Veto LLD | 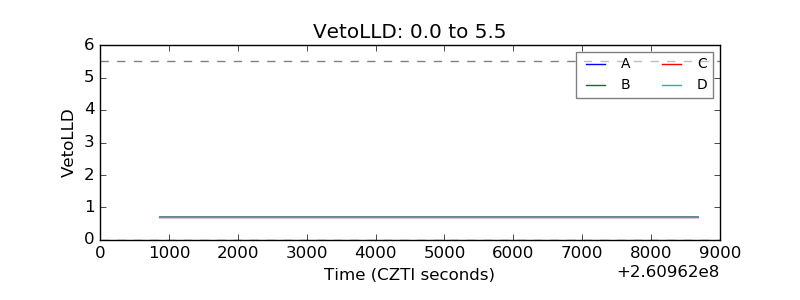 |
| Alpha Counter | 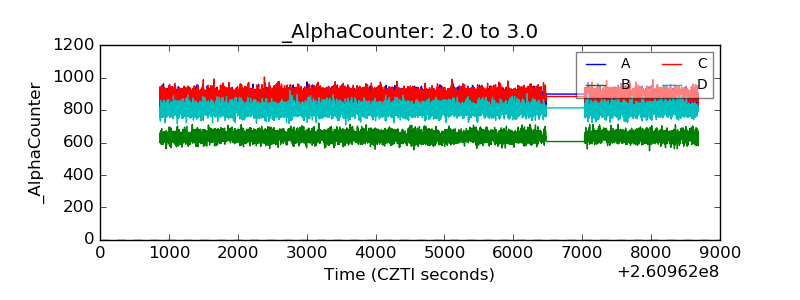 |
| _CPM_Rate | 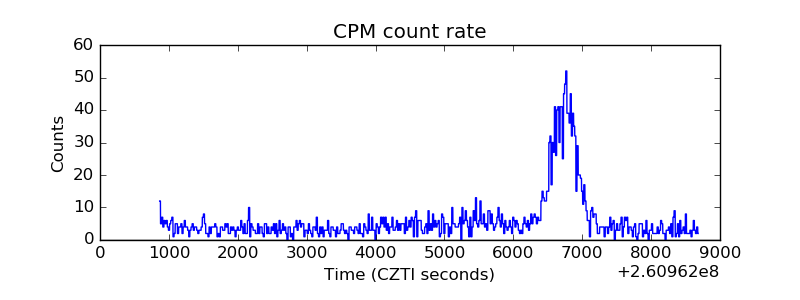 |
| CZT Counter | 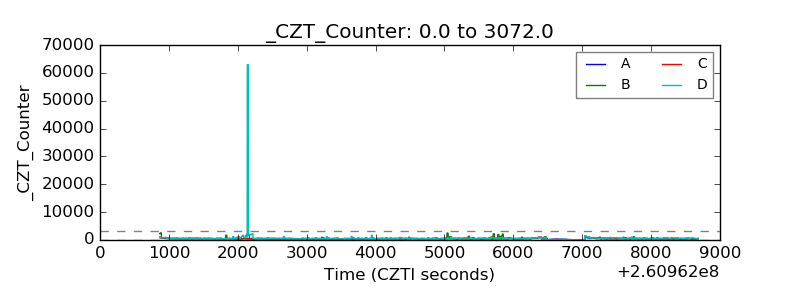 |
| +2.5 Volts monitor |  |
| +5 Volts monitor |  |
| _ROLL_ROT | 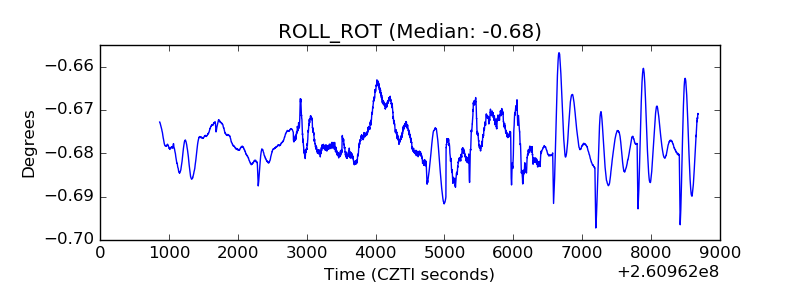 |
| _Roll_DEC | 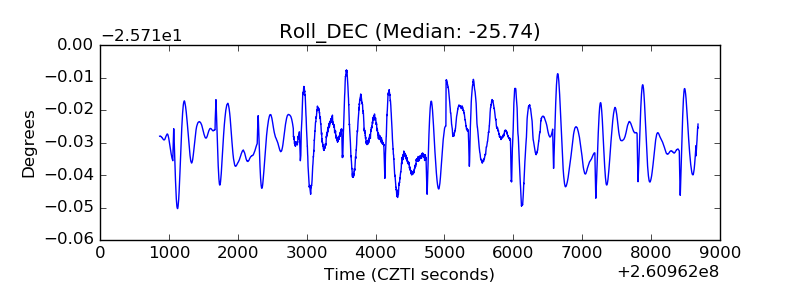 |
| _Roll_RA | 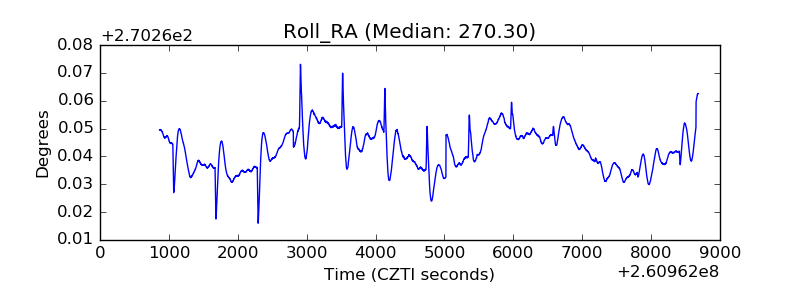 |
| Veto Counter | 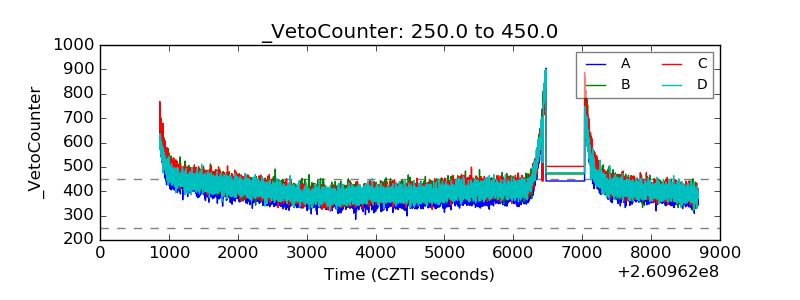 |