| Param | Original file | Final file |
|---|---|---|
| Filename | modeM0/AS1G08_070T01_9000002028_13682cztM0_level2.evt | modeM0/AS1G08_070T01_9000002028_13682cztM0_level2_quad_clean.evt |
| Size (bytes) | 616,544,640 | 93,193,920 |
| Size | 588.0 MB | 88.9 MB |
| Events in quadrant A | 4,017,861 | 578,060 |
| Events in quadrant B | 4,600,770 | 608,842 |
| Events in quadrant C | 4,185,549 | 558,092 |
| Events in quadrant D | 5,330,693 | 525,781 |
| Mode SS | |||
|---|---|---|---|
| Quadrant | BADHDUFLAG | Total packets | Discarded packets |
| A | 0 | 160 | 0 |
| B | 0 | 160 | 0 |
| C | 0 | 160 | 0 |
| D | 0 | 160 | 0 |
| Mode M9 | |||
|---|---|---|---|
| Quadrant | BADHDUFLAG | Total packets | Discarded packets |
| A | 1 | 273359709408 | 0 |
| B | 1 | -1 | -1 |
| C | 1 | -1 | -1 |
| D | 1 | -1 | -1 |
| Mode M0 | |||
|---|---|---|---|
| Quadrant | BADHDUFLAG | Total packets | Discarded packets |
| A | 0 | 17015 | 4 |
| B | 0 | 18535 | 3 |
| C | 0 | 17185 | 3 |
| D | 0 | 21016 | 3 |
| Quadrant | Total seconds | Saturated seconds | Saturation percentage |
|---|---|---|---|
| A | 7919 | 338 | 4.268216% |
| B | 7919 | 484 | 6.111883% |
| C | 7919 | 264 | 3.333754% |
| D | 7919 | 357 | 4.508145% |
Noise dominated data is calculated using 1-second bins in cleaned event files. If a bin has >2000 counts, and if more than 50% of those come from <1% of pixels, then it is considered to be noise-dominated and hence unusable.
| Quadrant | # 1 sec bins | Bins with >0 counts | Bins with >2000 counts | High rate bins dominated by noise | Noise dominated (total time) | Noise dominated (detector-on time) | Marked lightcurve |
|---|---|---|---|---|---|---|---|
| A | 7975 | 7922 | 5 | 5 | 0.06% | 0.06% | 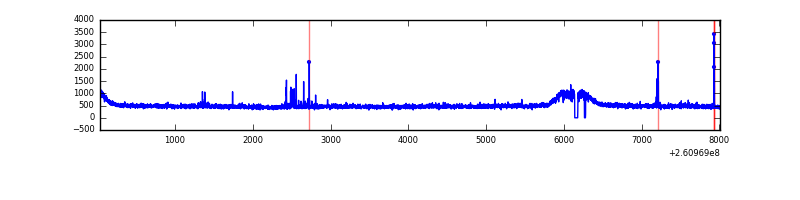 |
| B | 7975 | 7922 | 69 | 69 | 0.87% | 0.87% | 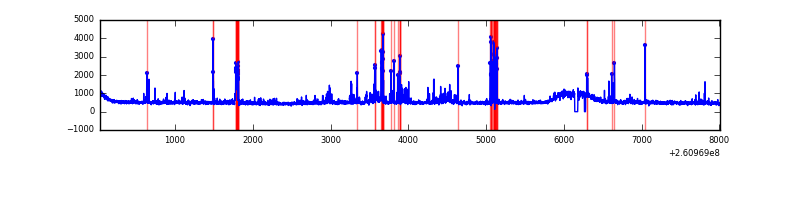 |
| C | 7975 | 7922 | 2 | 2 | 0.03% | 0.03% | 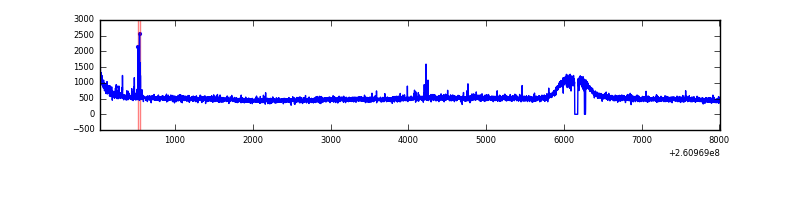 |
| D | 7975 | 7922 | 39 | 39 | 0.49% | 0.49% | 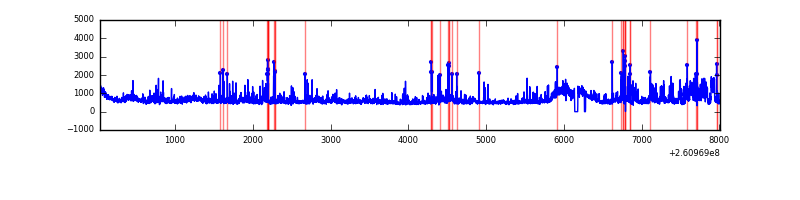 |
Top three noisy pixels from each quadrant. If the there are fewer than three noisy pixels in the level2.evt file, extra rows are filled as -1
| Pixel properties | Quadrant properties | ||||||
|---|---|---|---|---|---|---|---|
| Quadrant | DetID | PixID | Counts | Sigma | Mean | Median | Sigma |
| A | 15 | 69 | 67265 | 315.27 | 1020 | 997 | 210.2 |
| A | 1 | 162 | 19869 | 89.78 | 1020 | 997 | 210.2 |
| A | 0 | 226 | 9094 | 38.52 | 1020 | 997 | 210.2 |
| B | 4 | 48 | 190062 | 955.44 | 1018 | 995 | 197.9 |
| B | 3 | 64 | 152101 | 763.61 | 1018 | 995 | 197.9 |
| B | 8 | 250 | 136604 | 685.29 | 1018 | 995 | 197.9 |
| C | 3 | 233 | 325081 | 1397.78 | 986 | 991 | 231.9 |
| C | 14 | 234 | 19759 | 80.94 | 986 | 991 | 231.9 |
| C | 13 | 61 | 7066 | 26.2 | 986 | 991 | 231.9 |
| D | 13 | 122 | 701423 | 2666.94 | 972 | 953 | 262.6 |
| D | 1 | 52 | 450631 | 1712.08 | 972 | 953 | 262.6 |
| D | 8 | 195 | 170725 | 646.38 | 972 | 953 | 262.6 |
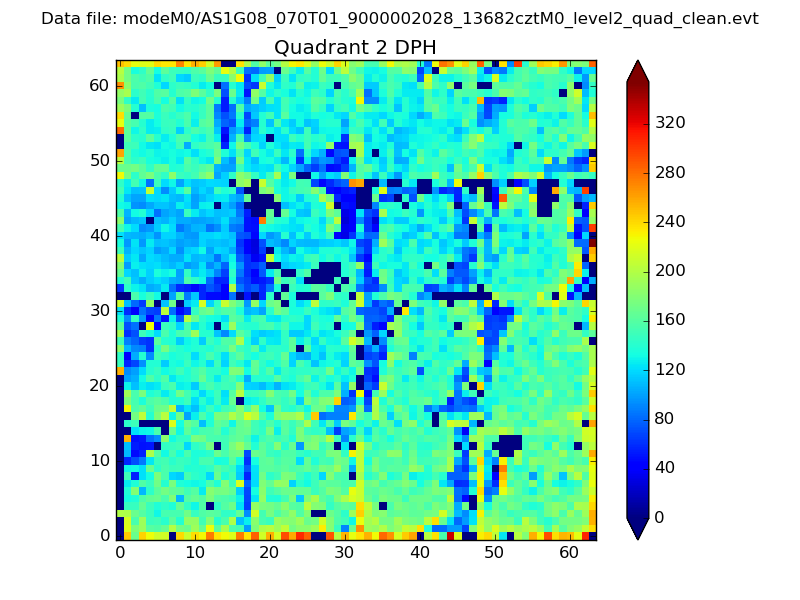
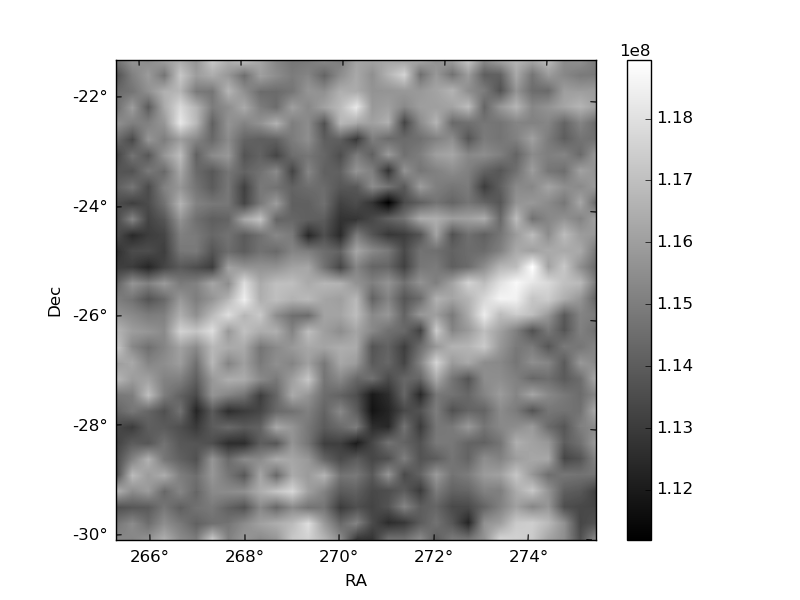
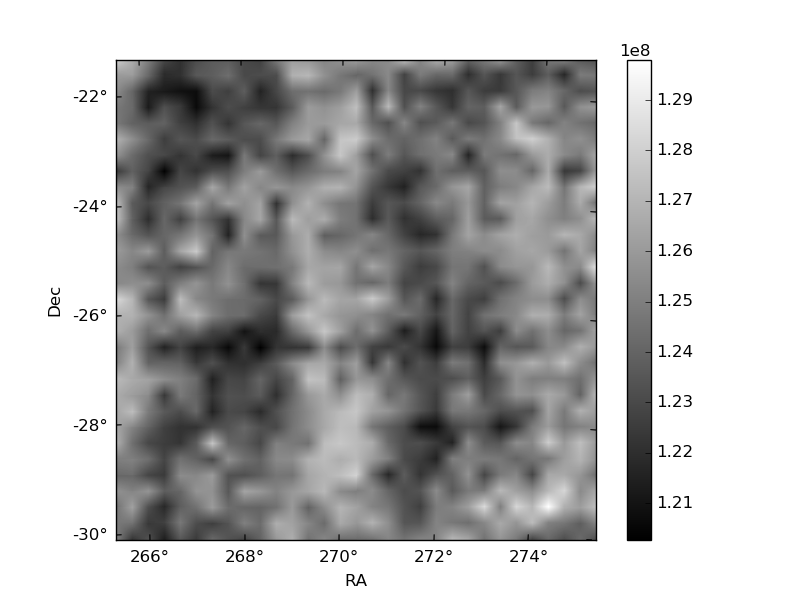
Histogram calculated using DETX and DETY for each event in the final _common_clean file
| Quadrant A | 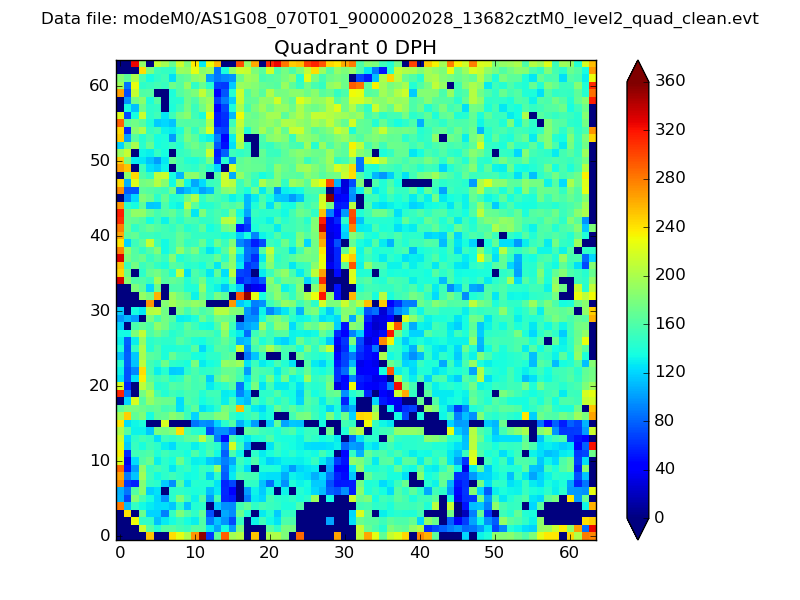 |
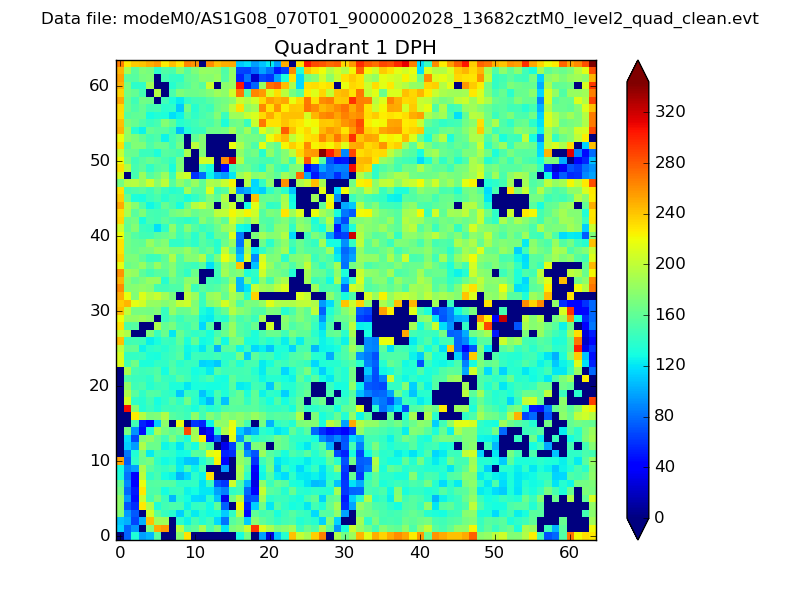 |
Quadrant B |
|---|---|---|---|
| Quadrant D | 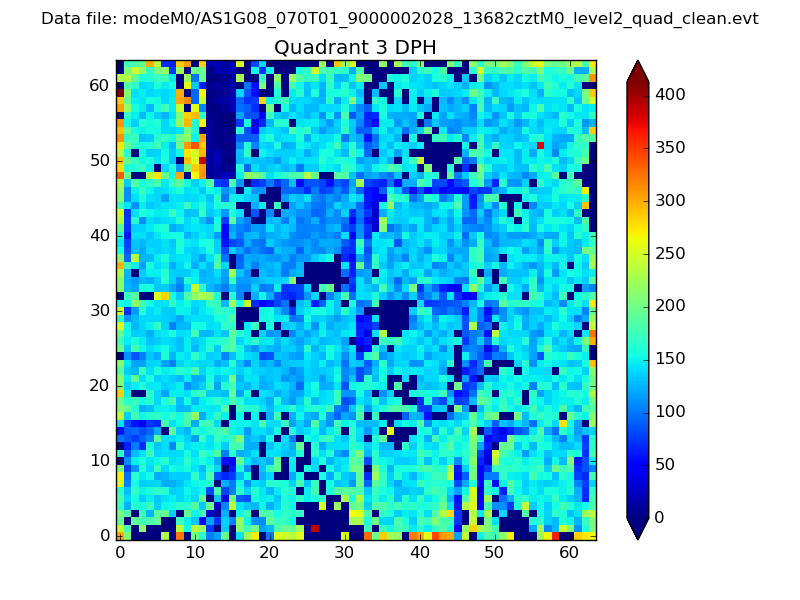 |
 |
Quadrant C |
| Plot type | Count rate plots | Images |
|---|---|---|
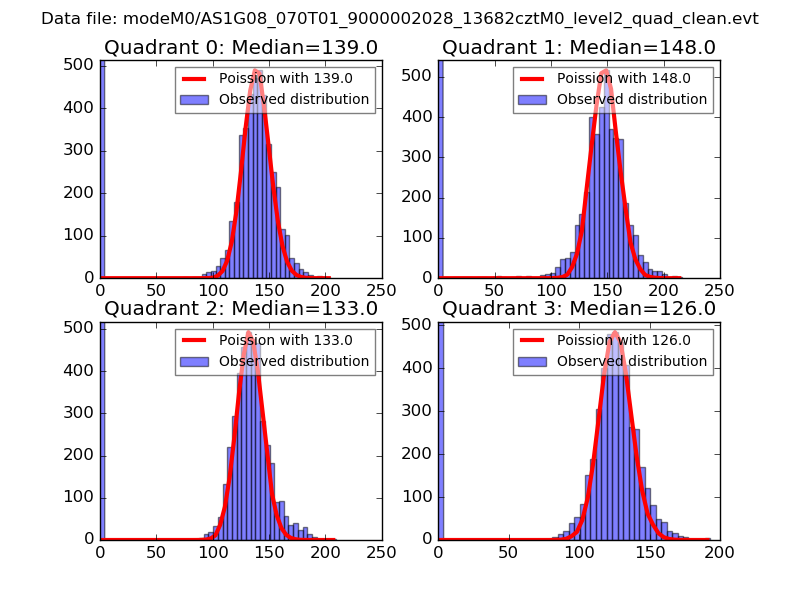
| Comparison with Poisson distribution Blue bars denote a histogram of data divided into 1 sec bins. Red curve is a Poisson curve with rate = median count rate of data. |
 |
 |
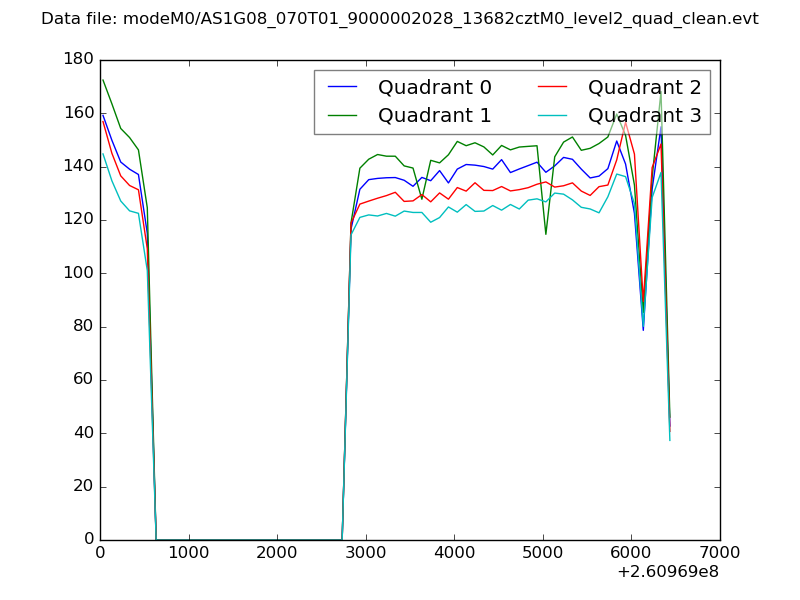
| Quadrant-wise count rates Data is divided into 100 sec bins |
 |
|
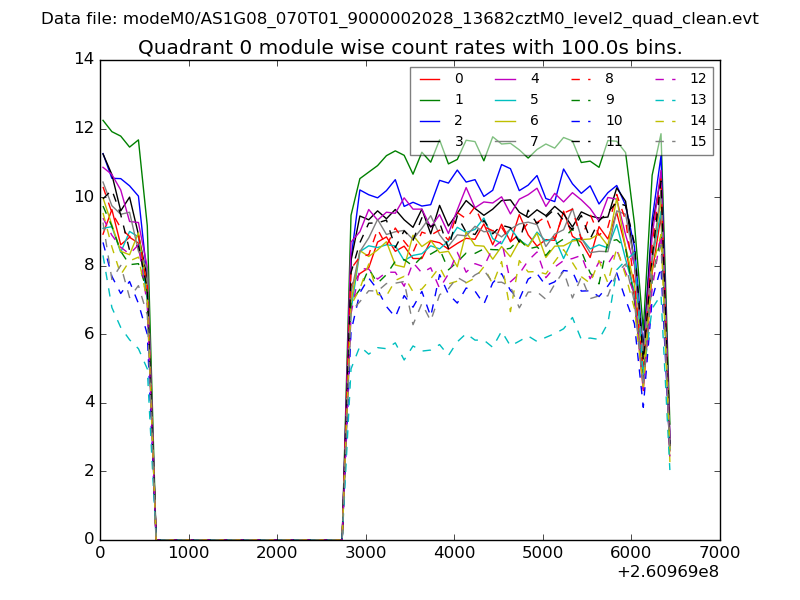
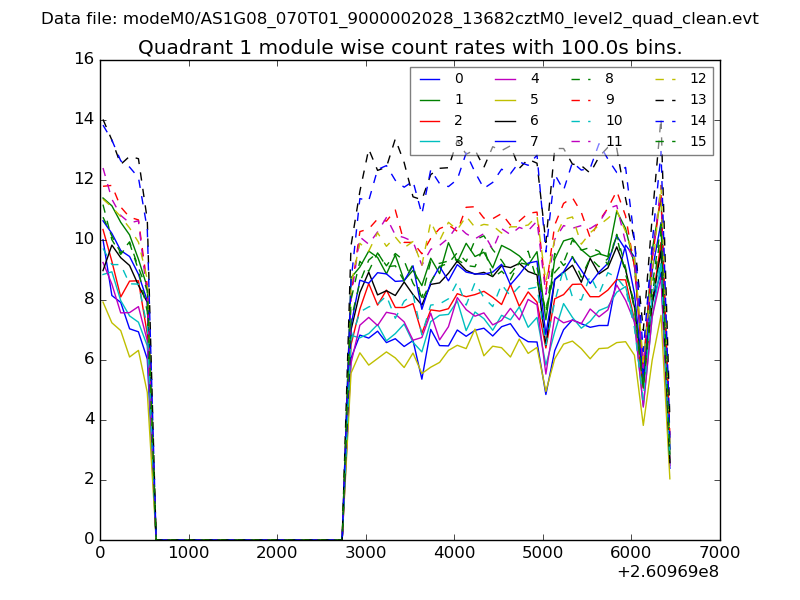
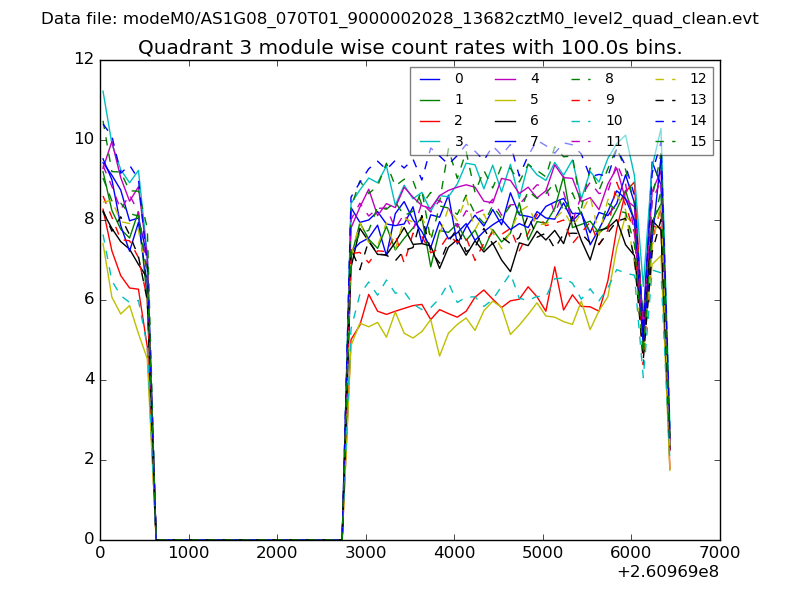
| Module-wise count rates for Quadrant A Data is divided into 100 sec bins |
 |
 |
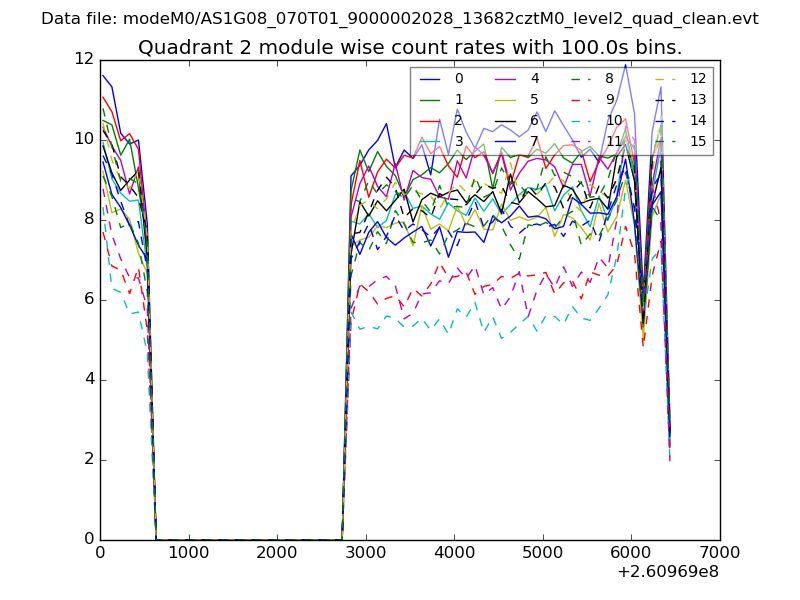
| Module-wise count rates for Quadrant B Data is divided into 100 sec bins |
 |
 |
| Module-wise count rates for Quadrant C Data is divided into 100 sec bins |
 |
 |
| Module-wise count rates for Quadrant D Data is divided into 100 sec bins |
 |
 |
| Parameter | Plot |
|---|---|
| CZT HV Monitor |  |
| D_VDD | 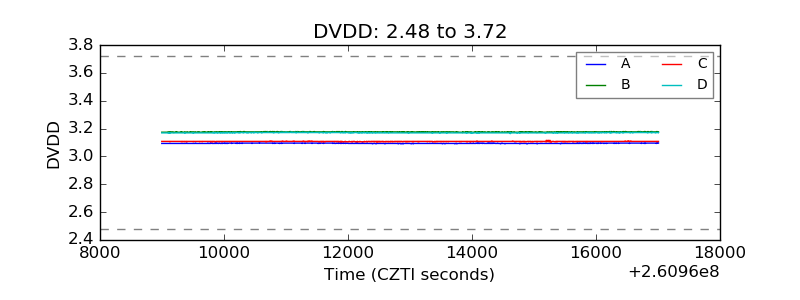 |
| Temperature 1 | 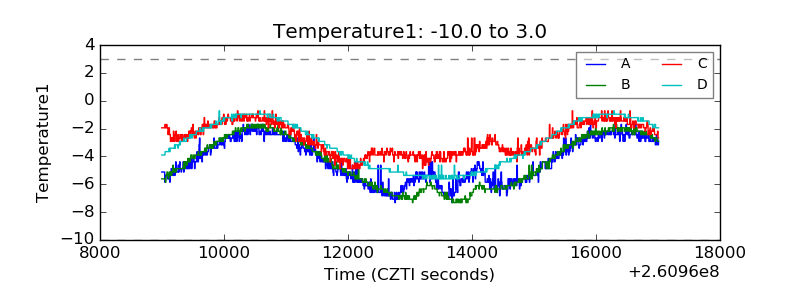 |
| Veto HV Monitor | 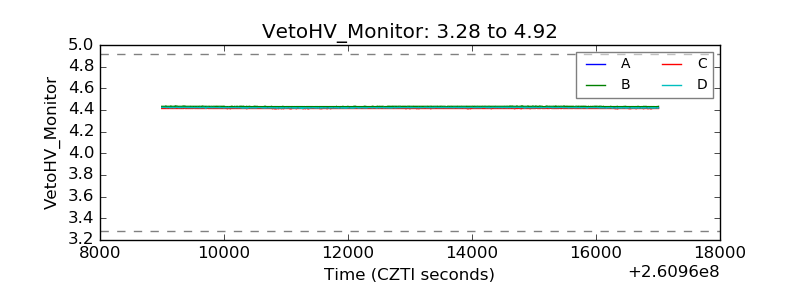 |
| Veto LLD | 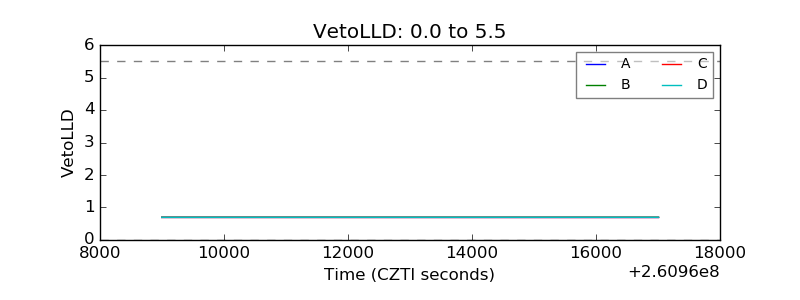 |
| Alpha Counter | 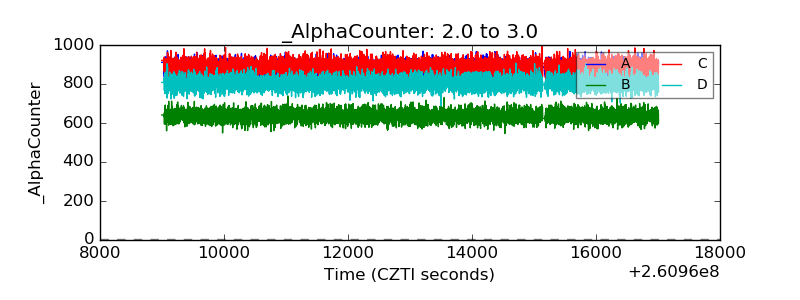 |
| _CPM_Rate | 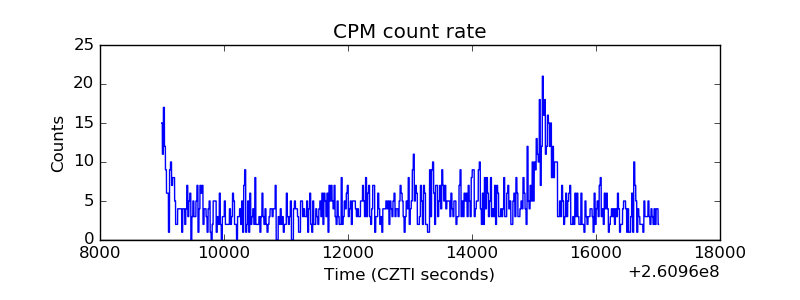 |
| CZT Counter | 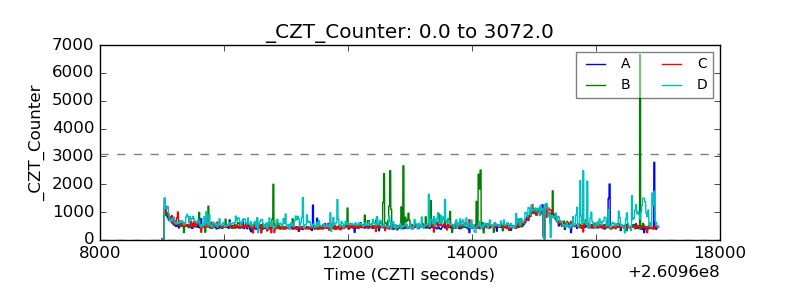 |
| +2.5 Volts monitor |  |
| +5 Volts monitor |  |
| _ROLL_ROT | 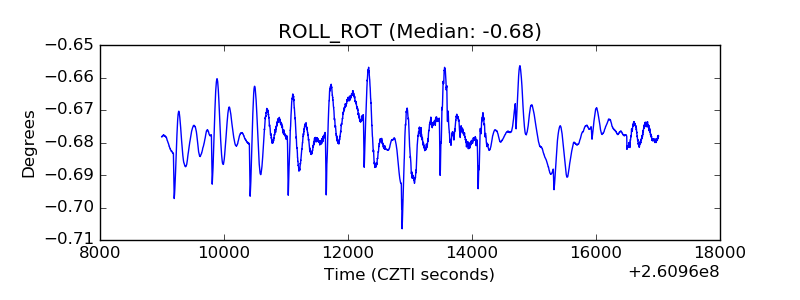 |
| _Roll_DEC | 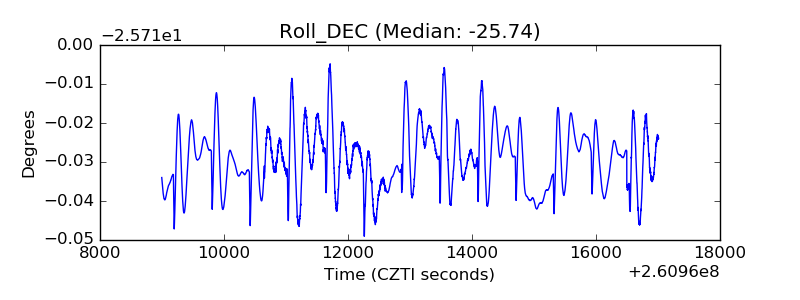 |
| _Roll_RA | 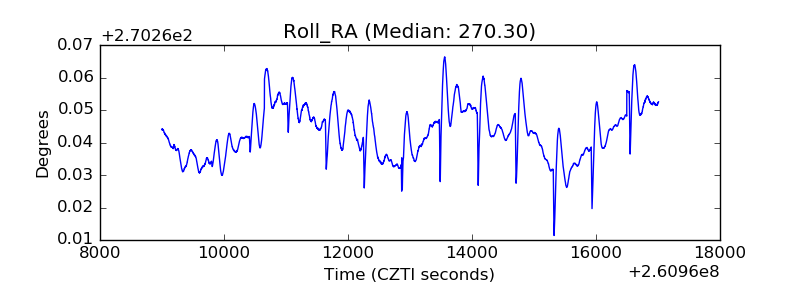 |
| Veto Counter | 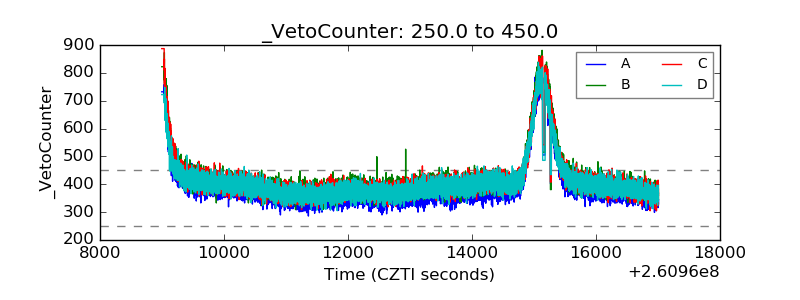 |