| Param | Original file | Final file |
|---|---|---|
| Filename | modeM0/AS1G08_070T01_9000002028_13684cztM0_level2.evt | modeM0/AS1G08_070T01_9000002028_13684cztM0_level2_quad_clean.evt |
| Size (bytes) | 616,101,120 | 84,905,280 |
| Size | 587.6 MB | 81.0 MB |
| Events in quadrant A | 3,823,692 | 520,565 |
| Events in quadrant B | 4,177,094 | 550,461 |
| Events in quadrant C | 3,894,044 | 493,425 |
| Events in quadrant D | 6,237,370 | 466,444 |
| Mode SS | |||
|---|---|---|---|
| Quadrant | BADHDUFLAG | Total packets | Discarded packets |
| A | 0 | 160 | 0 |
| B | 0 | 160 | 0 |
| C | 0 | 160 | 0 |
| D | 0 | 160 | 0 |
| Mode M9 | |||
|---|---|---|---|
| Quadrant | BADHDUFLAG | Total packets | Discarded packets |
| A | 0 | 5 | 0 |
| B | 0 | 5 | 0 |
| C | 0 | 5 | 0 |
| D | 0 | 5 | 0 |
| Mode M0 | |||
|---|---|---|---|
| Quadrant | BADHDUFLAG | Total packets | Discarded packets |
| A | 0 | 16337 | 4 |
| B | 0 | 17234 | 3 |
| C | 0 | 16345 | 3 |
| D | 0 | 23848 | 3 |
| Quadrant | Total seconds | Saturated seconds | Saturation percentage |
|---|---|---|---|
| A | 7766 | 187 | 2.407932% |
| B | 7766 | 251 | 3.232037% |
| C | 7766 | 126 | 1.622457% |
| D | 7766 | 551 | 7.095030% |
Noise dominated data is calculated using 1-second bins in cleaned event files. If a bin has >2000 counts, and if more than 50% of those come from <1% of pixels, then it is considered to be noise-dominated and hence unusable.
| Quadrant | # 1 sec bins | Bins with >0 counts | Bins with >2000 counts | High rate bins dominated by noise | Noise dominated (total time) | Noise dominated (detector-on time) | Marked lightcurve |
|---|---|---|---|---|---|---|---|
| A | 8332 | 7770 | 1 | 1 | 0.01% | 0.01% | 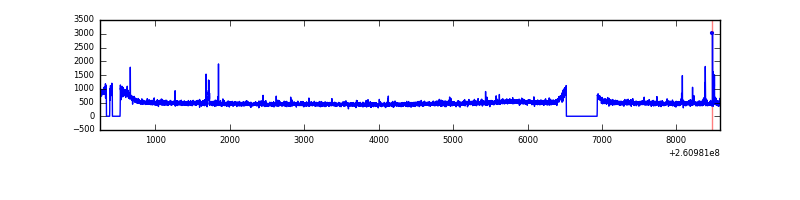 |
| B | 8332 | 7770 | 8 | 8 | 0.10% | 0.10% | 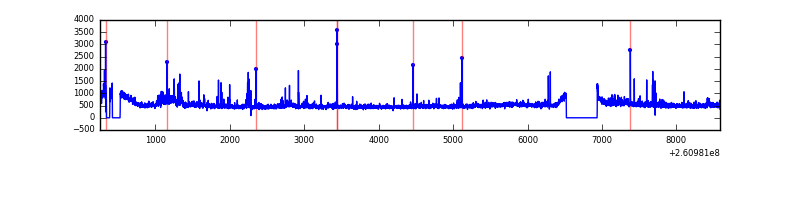 |
| C | 8332 | 7770 | 5 | 5 | 0.06% | 0.06% | 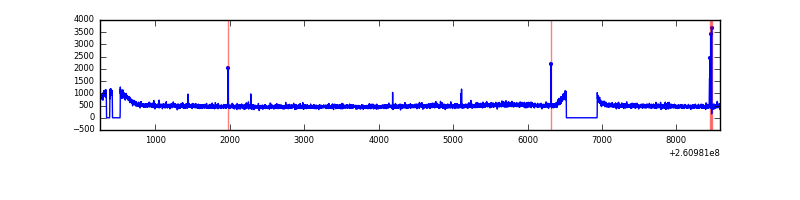 |
| D | 8332 | 7770 | 297 | 297 | 3.56% | 3.82% | 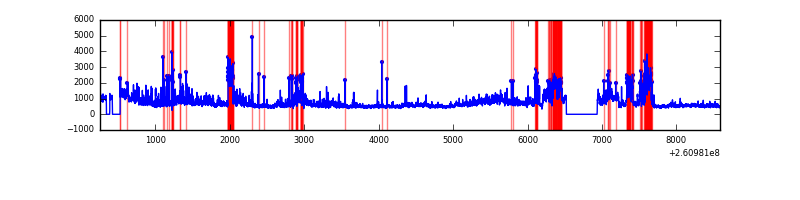 |
Top three noisy pixels from each quadrant. If the there are fewer than three noisy pixels in the level2.evt file, extra rows are filled as -1
| Pixel properties | Quadrant properties | ||||||
|---|---|---|---|---|---|---|---|
| Quadrant | DetID | PixID | Counts | Sigma | Mean | Median | Sigma |
| A | 15 | 69 | 52449 | 255.73 | 974 | 954 | 201.4 |
| A | 1 | 162 | 15163 | 70.56 | 974 | 954 | 201.4 |
| A | 0 | 226 | 8724 | 38.59 | 974 | 954 | 201.4 |
| B | 0 | 219 | 148979 | 783.21 | 978 | 958 | 189.0 |
| B | 3 | 64 | 52359 | 271.97 | 978 | 958 | 189.0 |
| B | 4 | 142 | 44176 | 228.68 | 978 | 958 | 189.0 |
| C | 3 | 233 | 207971 | 946.11 | 937 | 943 | 218.8 |
| C | 14 | 234 | 26262 | 115.71 | 937 | 943 | 218.8 |
| C | 13 | 61 | 6838 | 26.94 | 937 | 943 | 218.8 |
| D | 5 | 222 | 1095497 | 4838.76 | 921 | 892 | 226.2 |
| D | 13 | 122 | 706407 | 3118.77 | 921 | 892 | 226.2 |
| D | 8 | 195 | 495672 | 2187.2 | 921 | 892 | 226.2 |
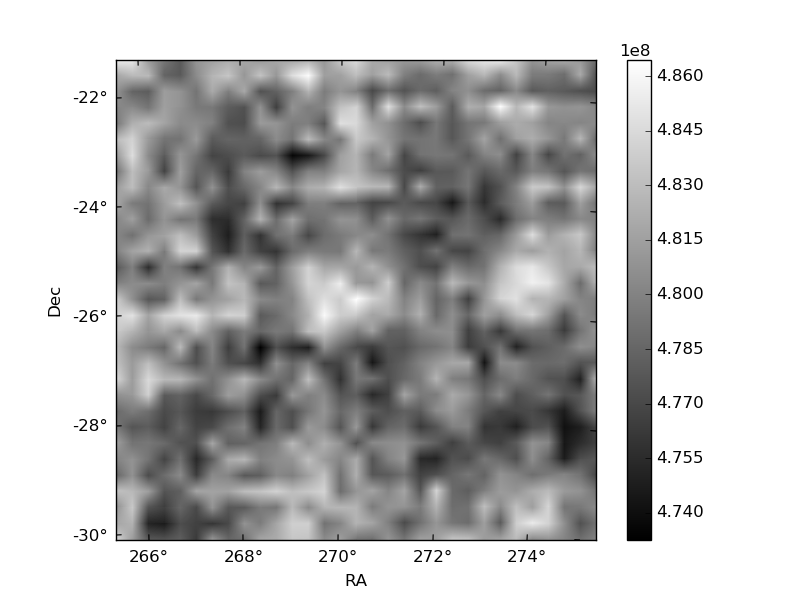
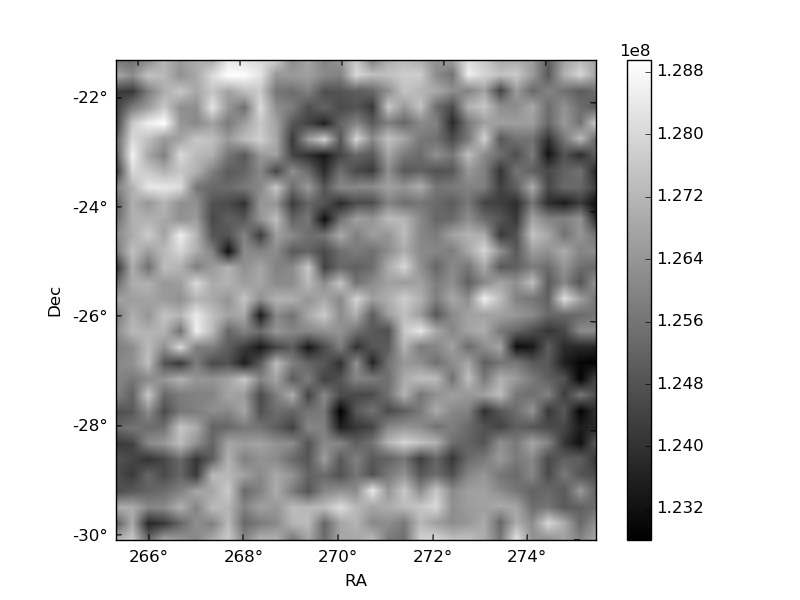
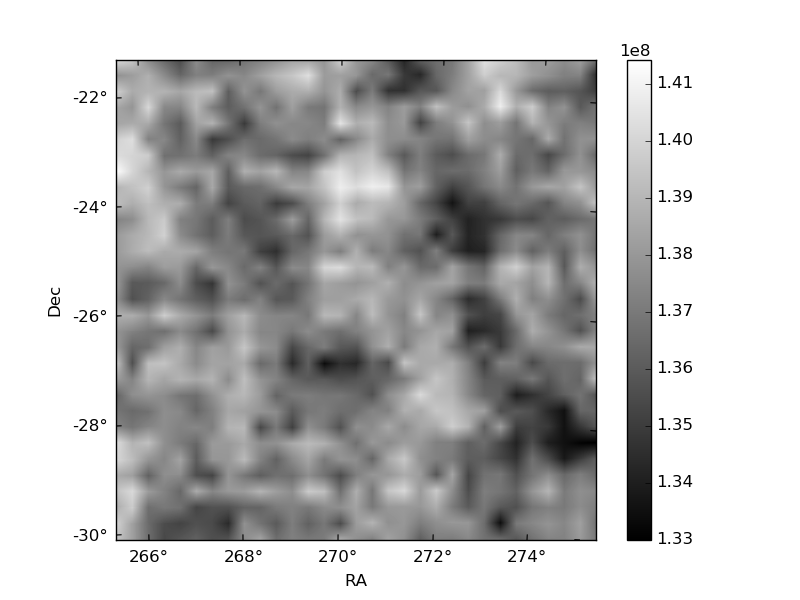
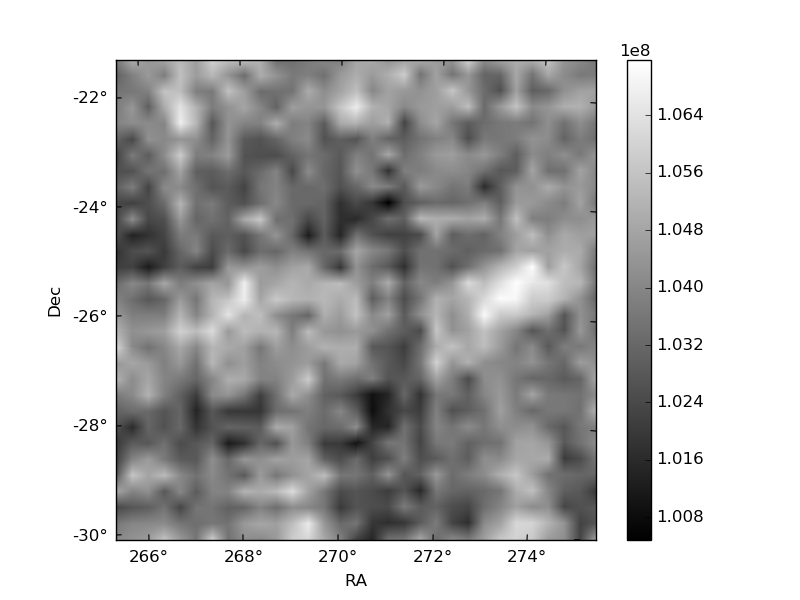
Histogram calculated using DETX and DETY for each event in the final _common_clean file
| Quadrant A | 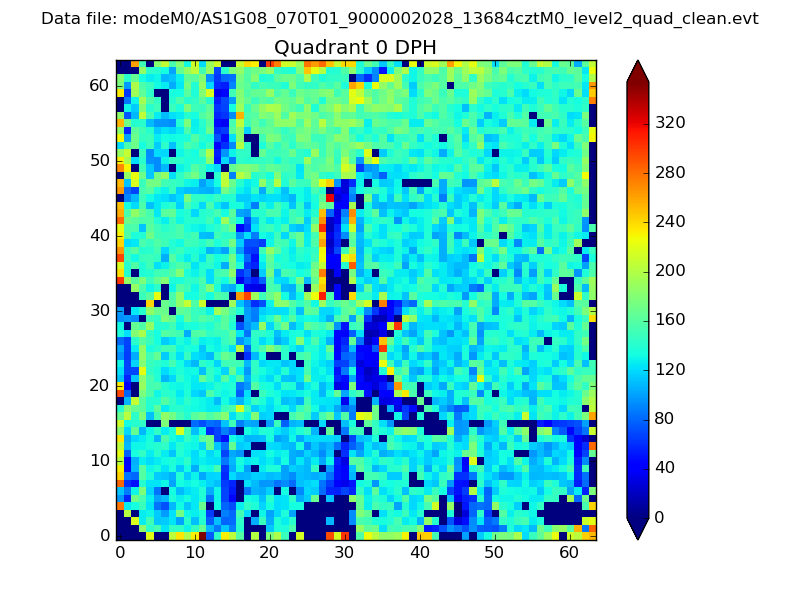 |
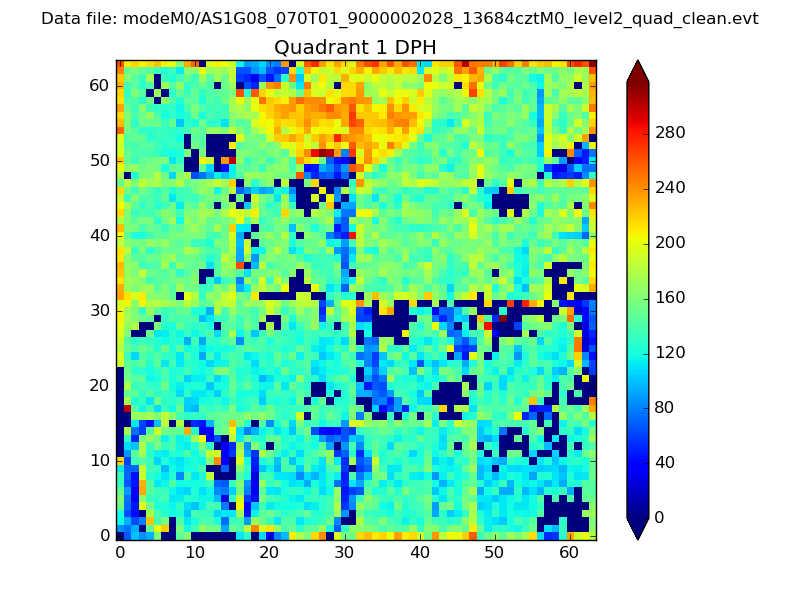 |
Quadrant B |
|---|---|---|---|
| Quadrant D | 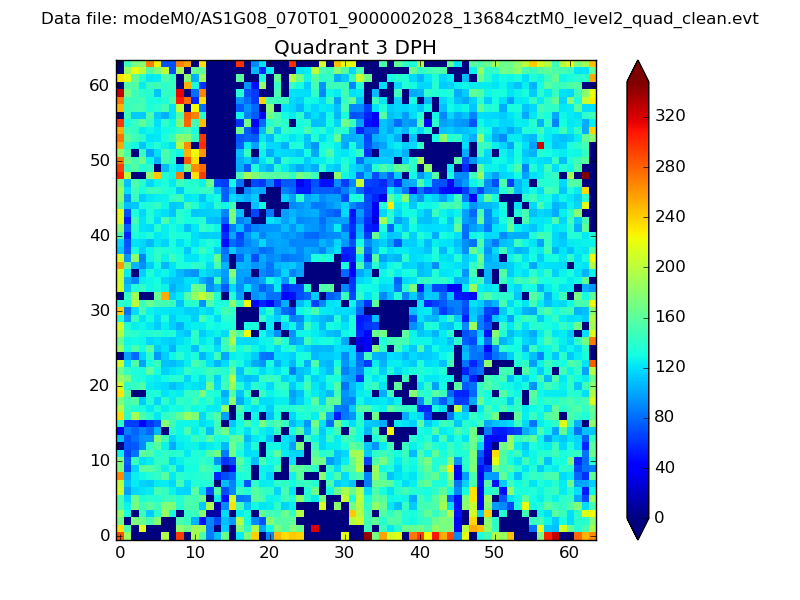 |
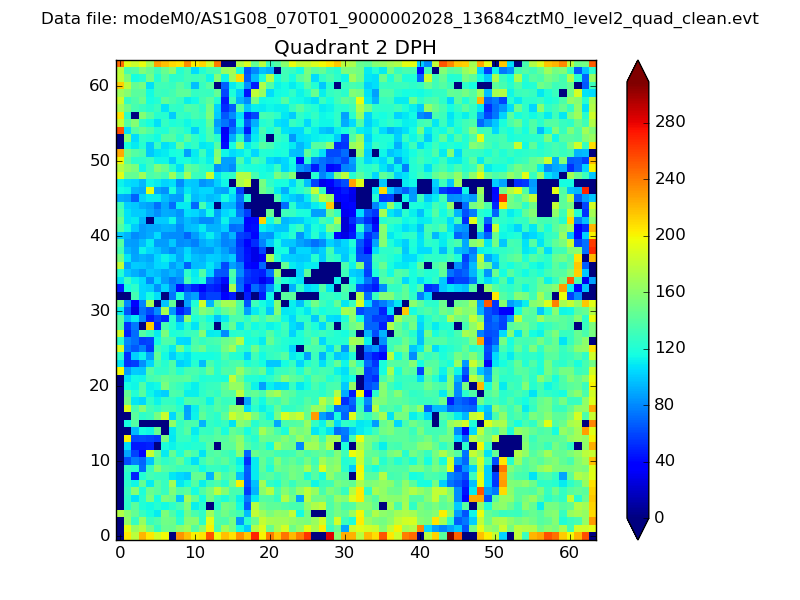 |
Quadrant C |
| Plot type | Count rate plots | Images |
|---|---|---|
| Comparison with Poisson distribution Blue bars denote a histogram of data divided into 1 sec bins. Red curve is a Poisson curve with rate = median count rate of data. |
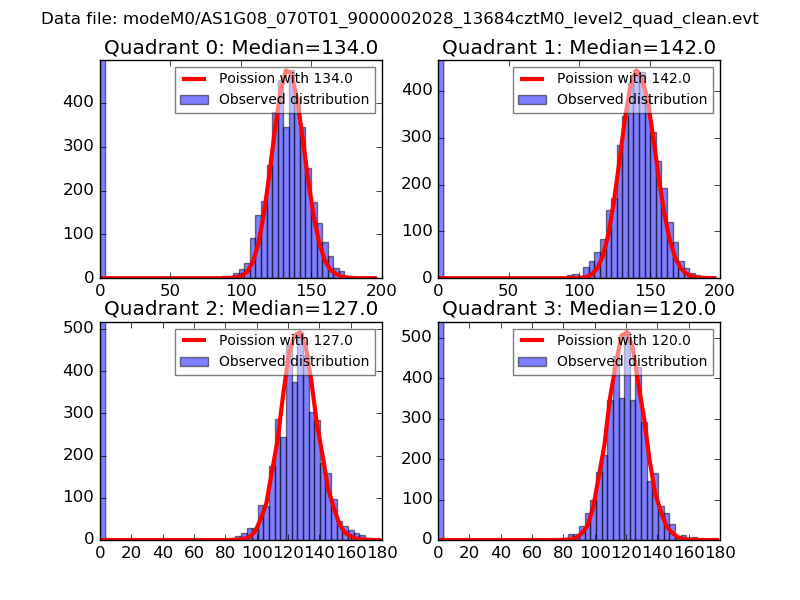 |
 |
| Quadrant-wise count rates Data is divided into 100 sec bins |
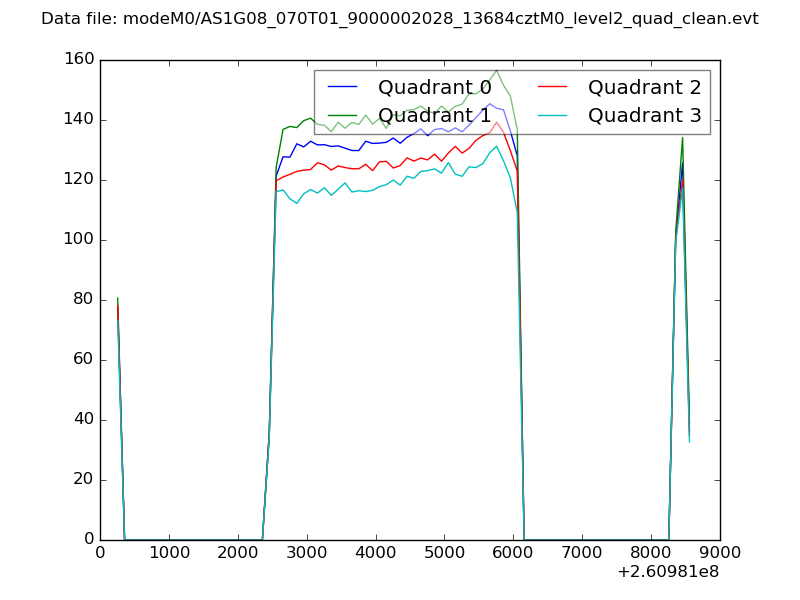 |
|
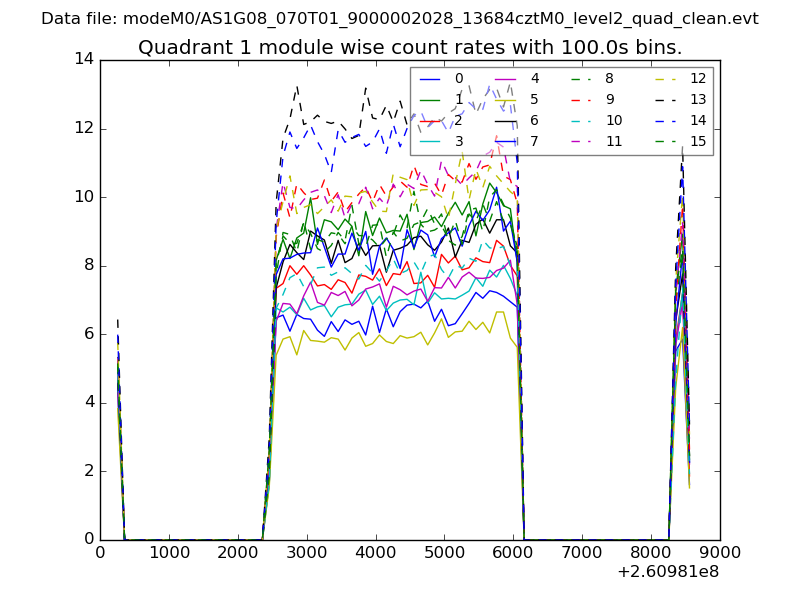
| Module-wise count rates for Quadrant A Data is divided into 100 sec bins |
 |
 |
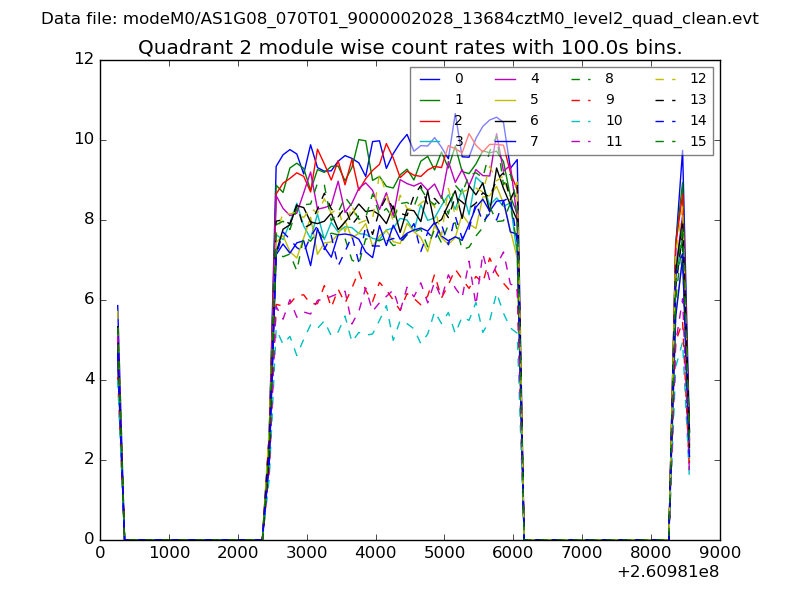
| Module-wise count rates for Quadrant B Data is divided into 100 sec bins |
 |
 |
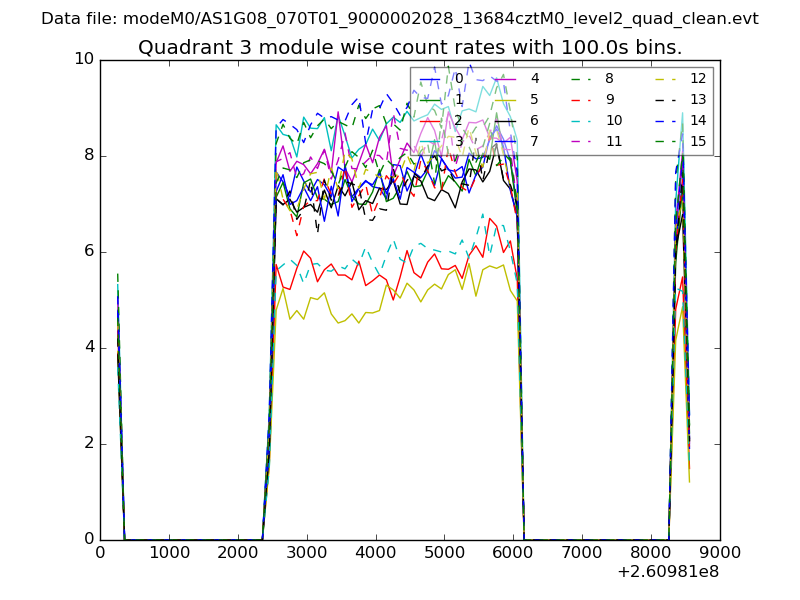
| Module-wise count rates for Quadrant C Data is divided into 100 sec bins |
 |
 |
| Module-wise count rates for Quadrant D Data is divided into 100 sec bins |
 |
 |
| Parameter | Plot |
|---|---|
| CZT HV Monitor | 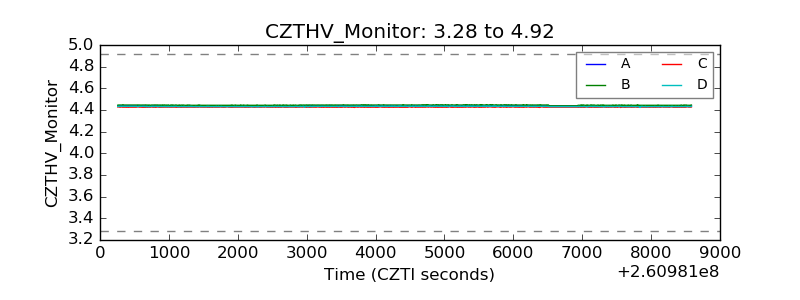 |
| D_VDD |  |
| Temperature 1 | 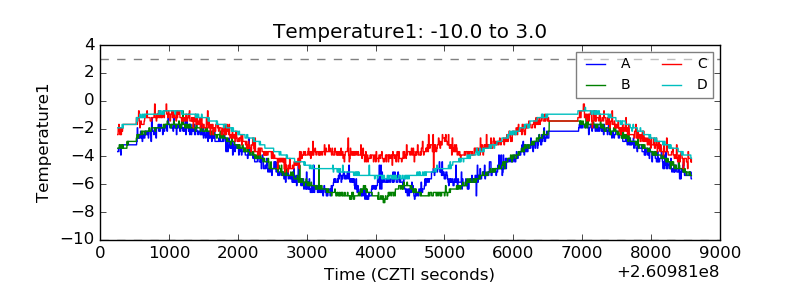 |
| Veto HV Monitor | 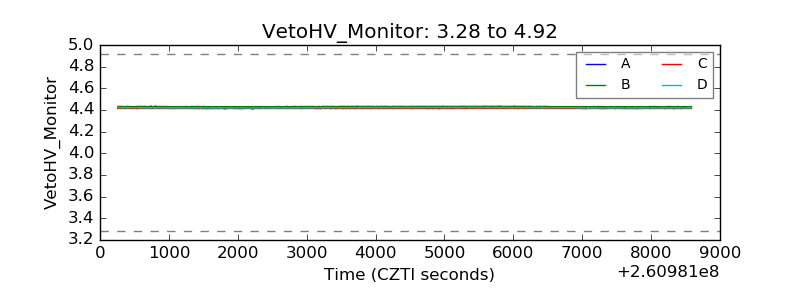 |
| Veto LLD |  |
| Alpha Counter | 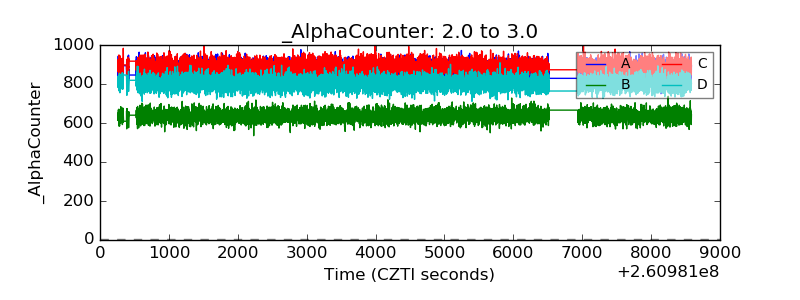 |
| _CPM_Rate | 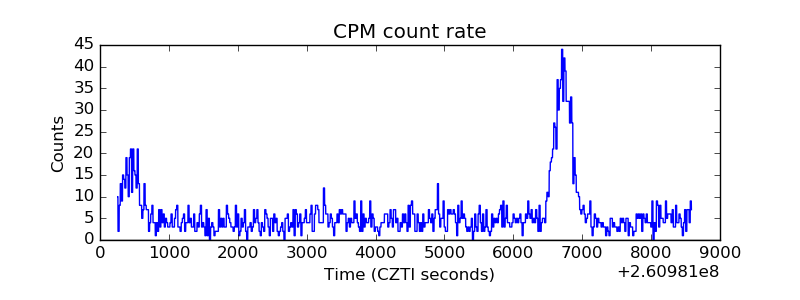 |
| CZT Counter | 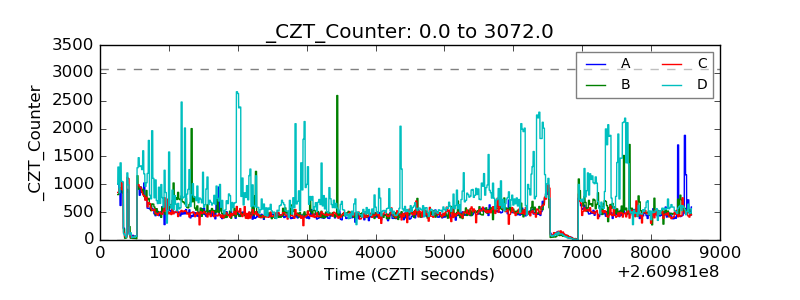 |
| +2.5 Volts monitor |  |
| +5 Volts monitor |  |
| _ROLL_ROT |  |
| _Roll_DEC | 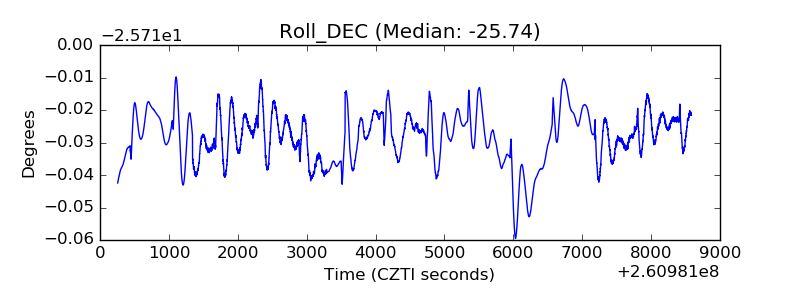 |
| _Roll_RA | 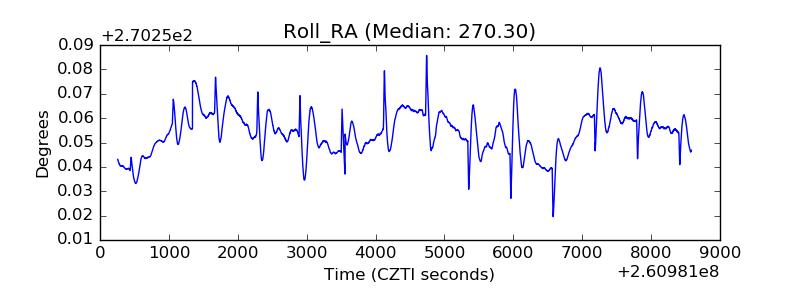 |
| Veto Counter | 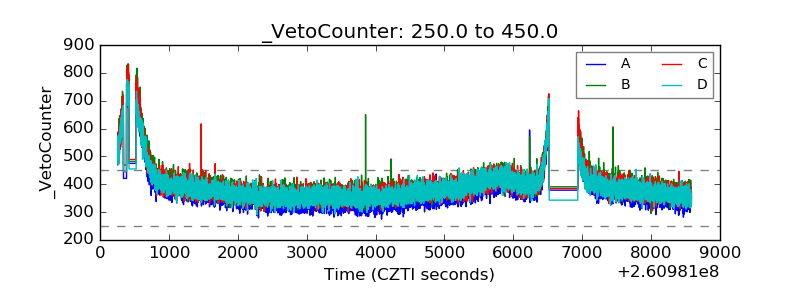 |