| Param | Original file | Final file |
|---|---|---|
| Filename | modeM0/AS1G08_070T01_9000002028_13688cztM0_level2.evt | modeM0/AS1G08_070T01_9000002028_13688cztM0_level2_quad_clean.evt |
| Size (bytes) | 501,384,960 | 103,789,440 |
| Size | 478.2 MB | 99.0 MB |
| Events in quadrant A | 3,119,188 | 692,015 |
| Events in quadrant B | 3,738,233 | 739,278 |
| Events in quadrant C | 3,295,778 | 670,093 |
| Events in quadrant D | 4,588,300 | 586,810 |
| Mode SS | |||
|---|---|---|---|
| Quadrant | BADHDUFLAG | Total packets | Discarded packets |
| A | 0 | 132 | 0 |
| B | 0 | 132 | 0 |
| C | 0 | 132 | 0 |
| D | 0 | 132 | 0 |
| Mode M9 | |||
|---|---|---|---|
| Quadrant | BADHDUFLAG | Total packets | Discarded packets |
| A | 0 | 14 | 0 |
| B | 0 | 14 | 0 |
| C | 0 | 14 | 0 |
| D | 0 | 15 | 0 |
| Mode M0 | |||
|---|---|---|---|
| Quadrant | BADHDUFLAG | Total packets | Discarded packets |
| A | 0 | 13423 | 3 |
| B | 0 | 15234 | 2 |
| C | 0 | 13700 | 2 |
| D | 0 | 17909 | 2 |
| Quadrant | Total seconds | Saturated seconds | Saturation percentage |
|---|---|---|---|
| A | 6524 | 12 | 0.183936% |
| B | 6524 | 137 | 2.099939% |
| C | 6524 | 9 | 0.137952% |
| D | 6524 | 534 | 8.185162% |
Noise dominated data is calculated using 1-second bins in cleaned event files. If a bin has >2000 counts, and if more than 50% of those come from <1% of pixels, then it is considered to be noise-dominated and hence unusable.
| Quadrant | # 1 sec bins | Bins with >0 counts | Bins with >2000 counts | High rate bins dominated by noise | Noise dominated (total time) | Noise dominated (detector-on time) | Marked lightcurve |
|---|---|---|---|---|---|---|---|
| A | 7615 | 6526 | 0 | 0 | 0.00% | 0.00% | 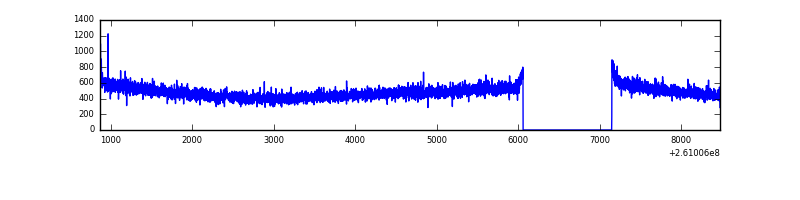 |
| B | 7615 | 6526 | 53 | 53 | 0.70% | 0.81% | 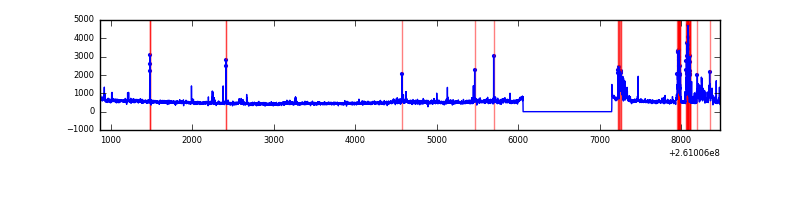 |
| C | 7615 | 6526 | 0 | 0 | 0.00% | 0.00% | 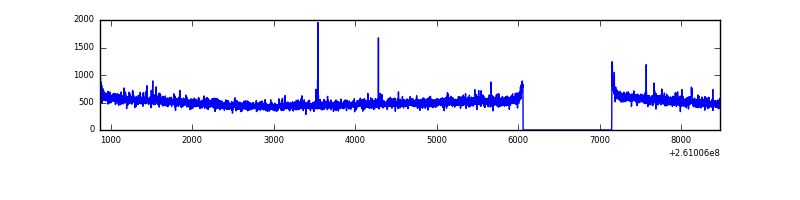 |
| D | 7615 | 6526 | 406 | 406 | 5.33% | 6.22% | 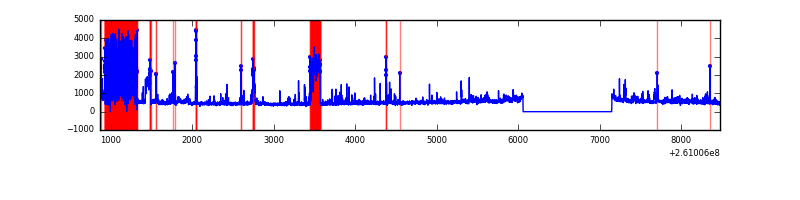 |
Top three noisy pixels from each quadrant. If the there are fewer than three noisy pixels in the level2.evt file, extra rows are filled as -1
| Pixel properties | Quadrant properties | ||||||
|---|---|---|---|---|---|---|---|
| Quadrant | DetID | PixID | Counts | Sigma | Mean | Median | Sigma |
| A | 0 | 226 | 7121 | 38.41 | 810 | 795 | 164.7 |
| A | 12 | 194 | 6101 | 32.22 | 810 | 795 | 164.7 |
| A | 3 | 137 | 4817 | 24.42 | 810 | 795 | 164.7 |
| B | 8 | 250 | 281774 | 1786.17 | 825 | 810 | 157.3 |
| B | 0 | 219 | 186835 | 1182.61 | 825 | 810 | 157.3 |
| B | 4 | 80 | 26083 | 160.67 | 825 | 810 | 157.3 |
| C | 3 | 233 | 209066 | 1132.98 | 790 | 798 | 183.8 |
| C | 14 | 234 | 8358 | 41.13 | 790 | 798 | 183.8 |
| C | 13 | 61 | 5569 | 25.95 | 790 | 798 | 183.8 |
| D | 13 | 122 | 915446 | 5136.85 | 739 | 718 | 178.1 |
| D | 1 | 52 | 457675 | 2566.14 | 739 | 718 | 178.1 |
| D | 5 | 222 | 227836 | 1275.43 | 739 | 718 | 178.1 |
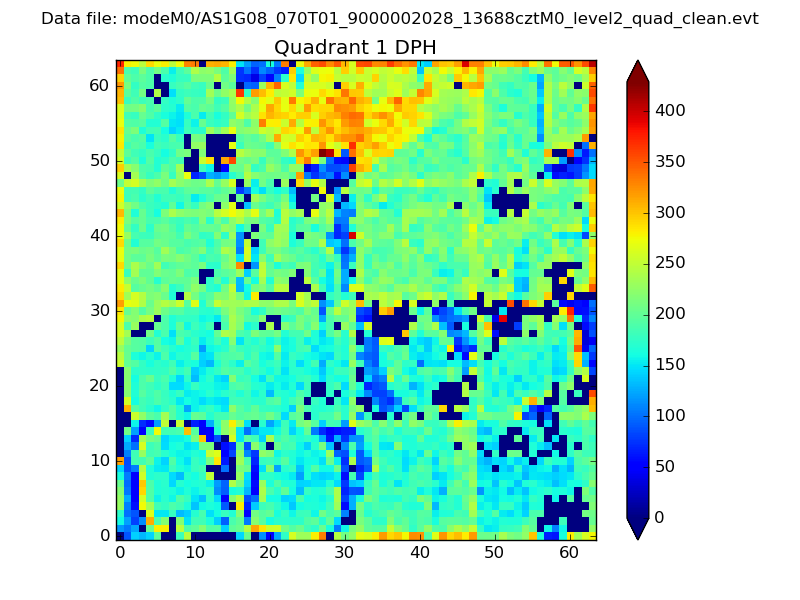
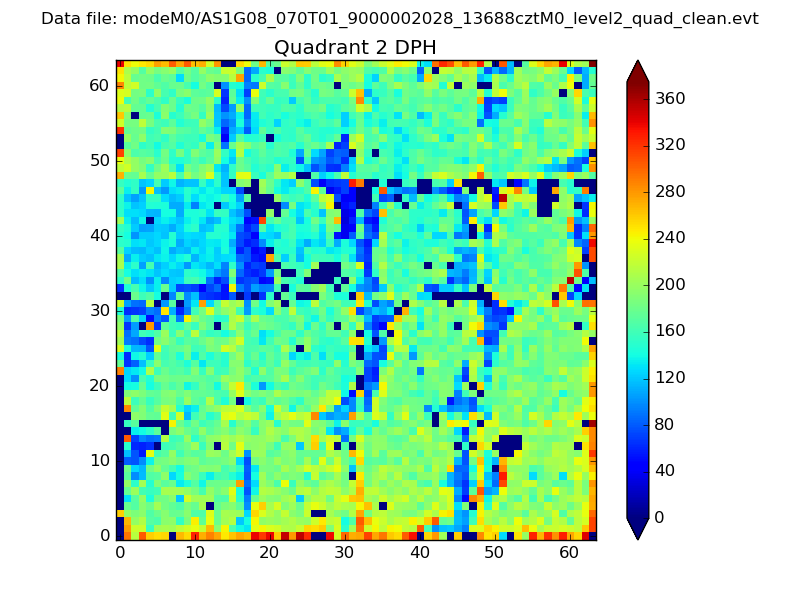
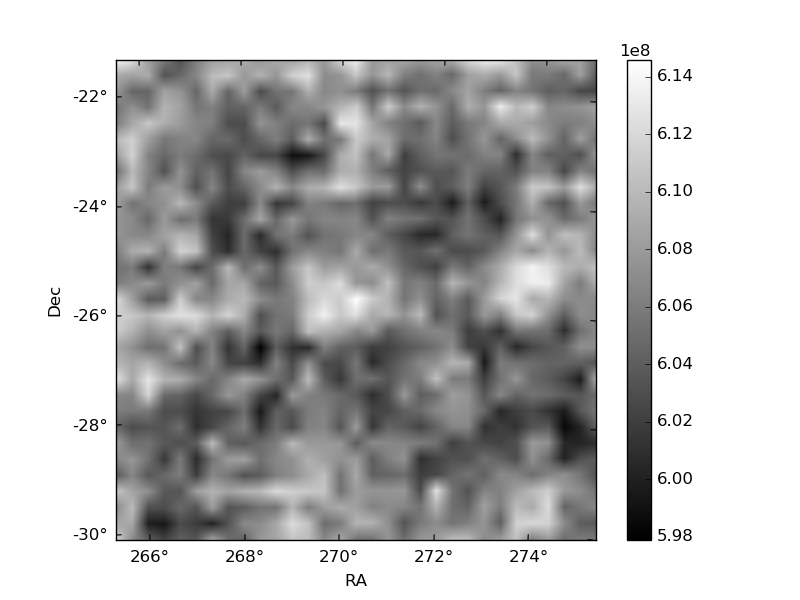
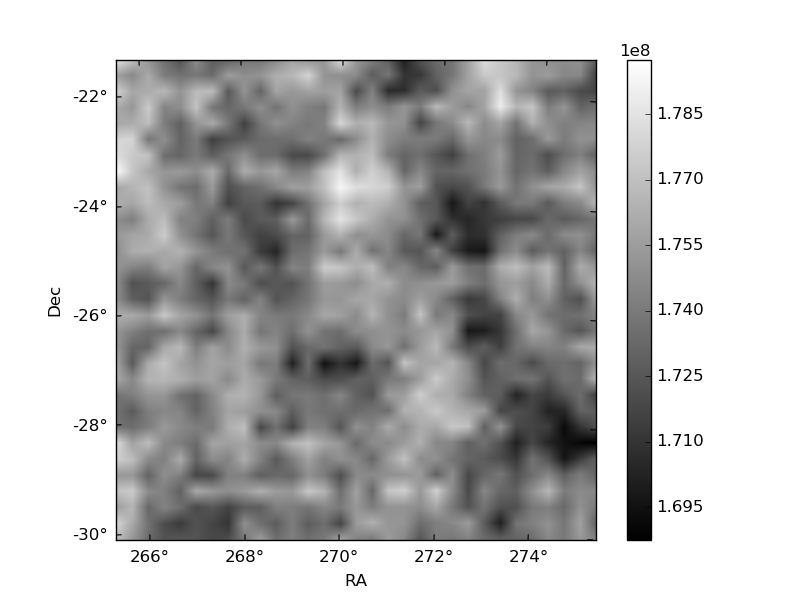
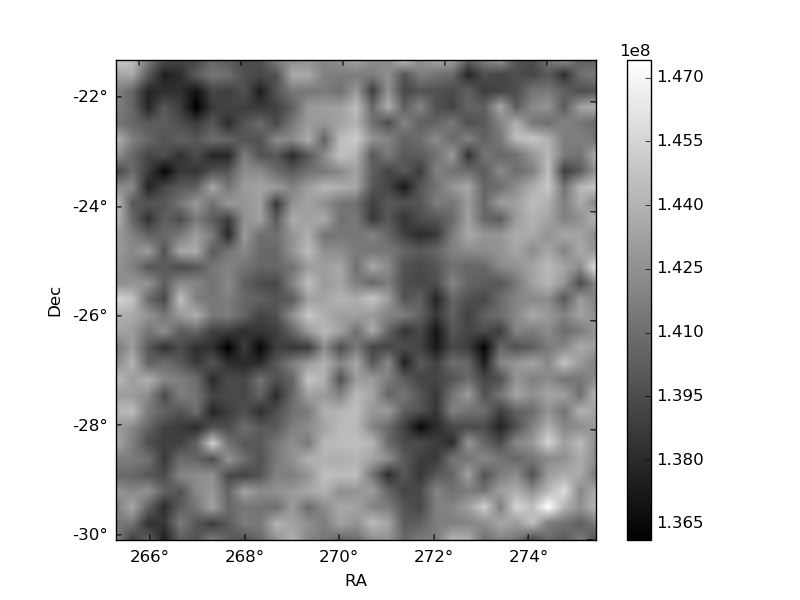
Histogram calculated using DETX and DETY for each event in the final _common_clean file
| Quadrant A |  |
 |
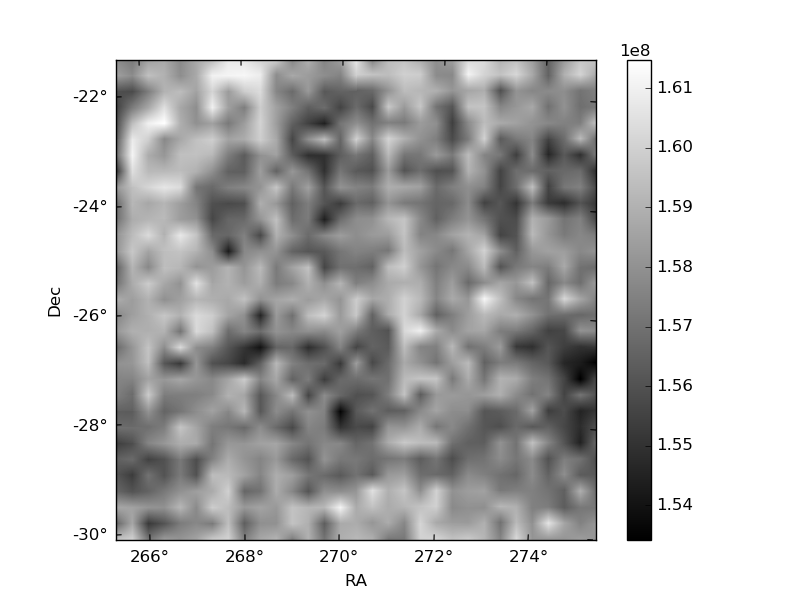
Quadrant B |
|---|---|---|---|
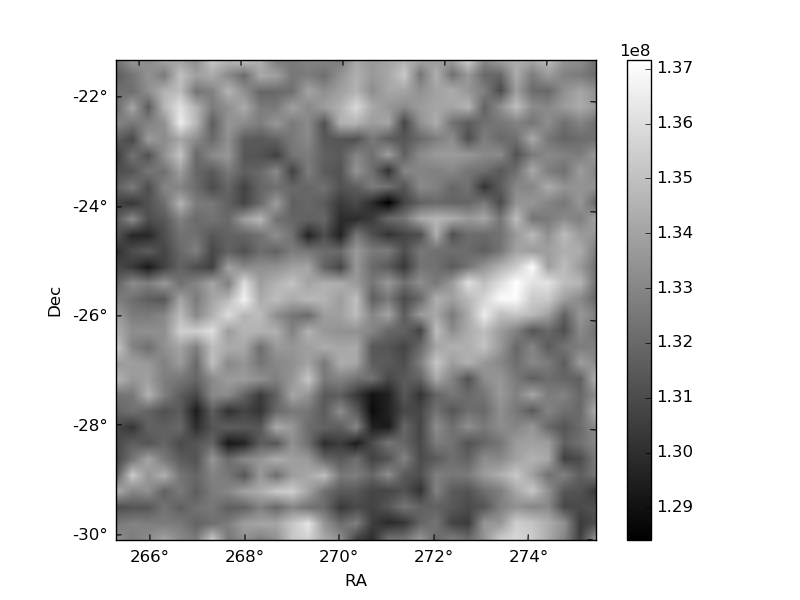
| Quadrant D | 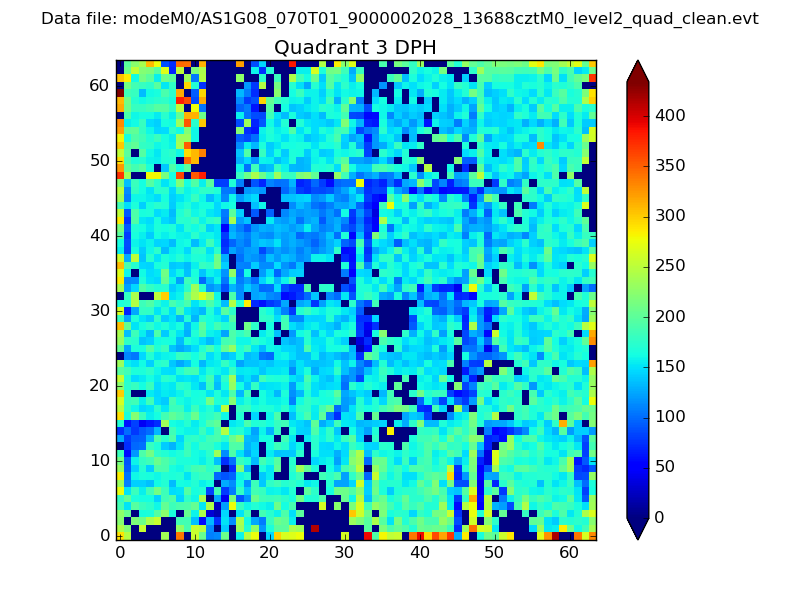 |
 |
Quadrant C |
| Plot type | Count rate plots | Images |
|---|---|---|
| Comparison with Poisson distribution Blue bars denote a histogram of data divided into 1 sec bins. Red curve is a Poisson curve with rate = median count rate of data. |
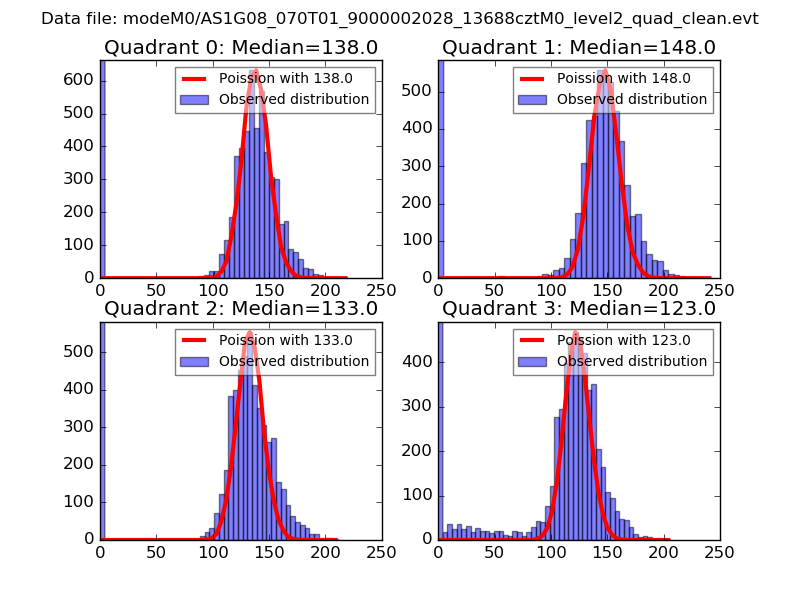 |
 |
| Quadrant-wise count rates Data is divided into 100 sec bins |
 |
|
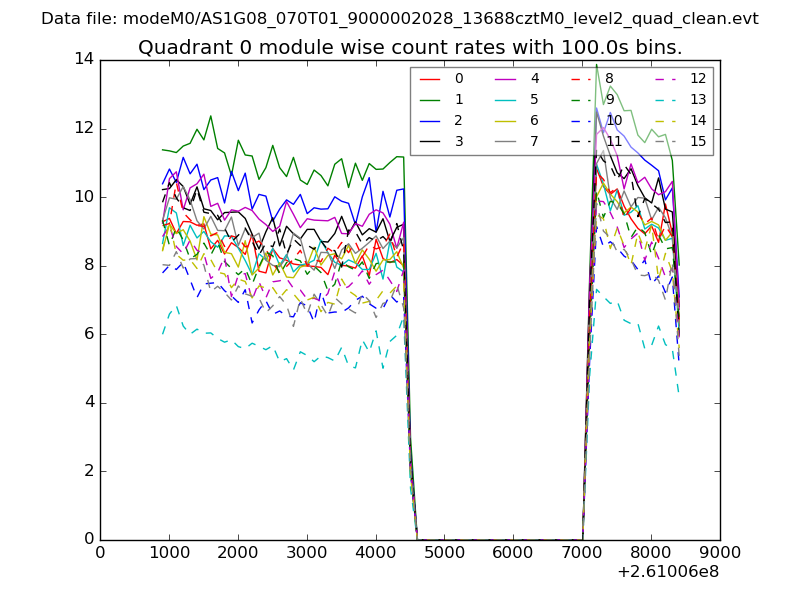
| Module-wise count rates for Quadrant A Data is divided into 100 sec bins |
 |
 |
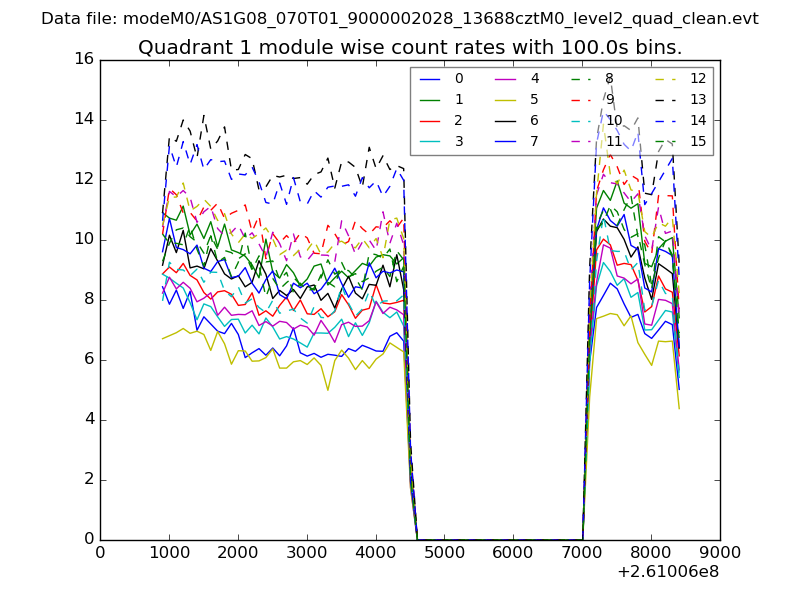
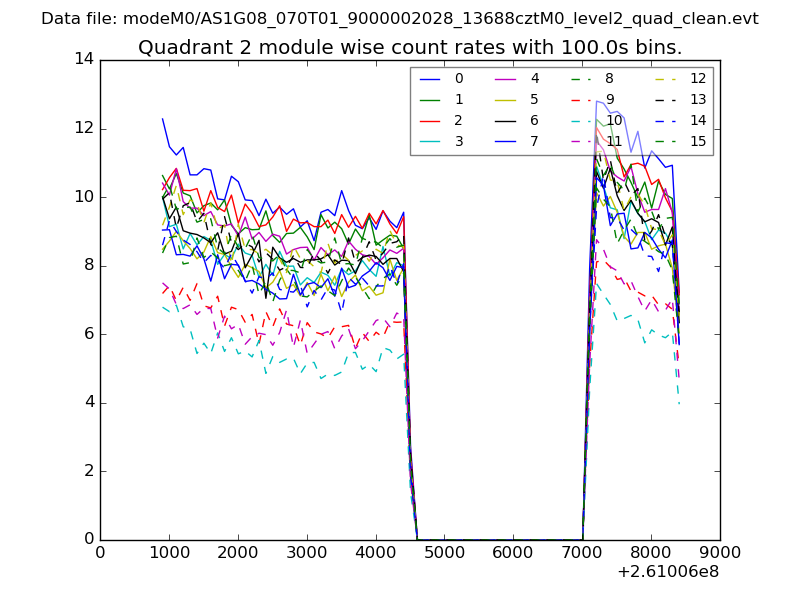
| Module-wise count rates for Quadrant B Data is divided into 100 sec bins |
 |
 |
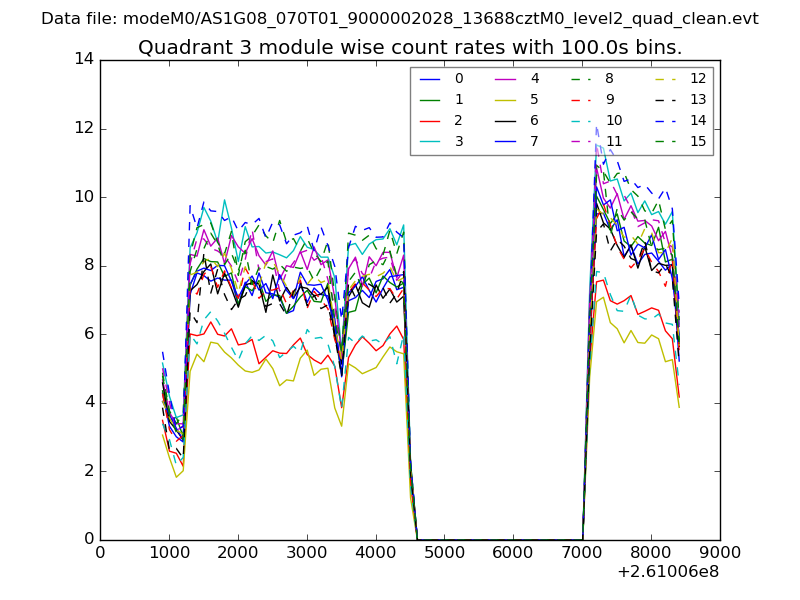
| Module-wise count rates for Quadrant C Data is divided into 100 sec bins |
 |
 |
| Module-wise count rates for Quadrant D Data is divided into 100 sec bins |
 |
 |
| Parameter | Plot |
|---|---|
| CZT HV Monitor | 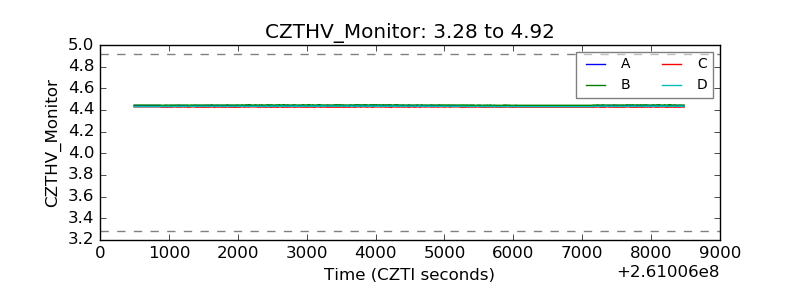 |
| D_VDD | 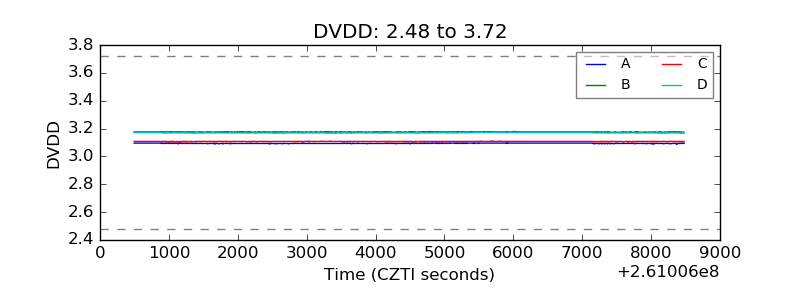 |
| Temperature 1 | 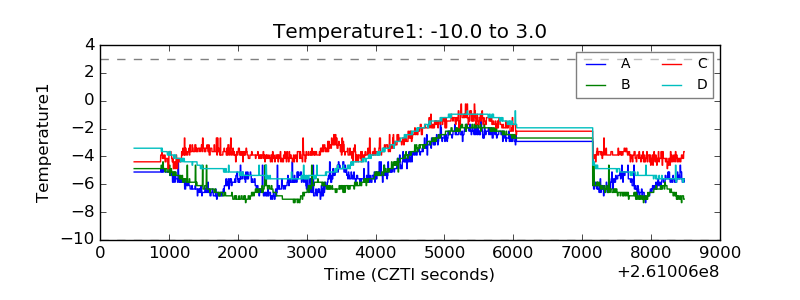 |
| Veto HV Monitor |  |
| Veto LLD |  |
| Alpha Counter | 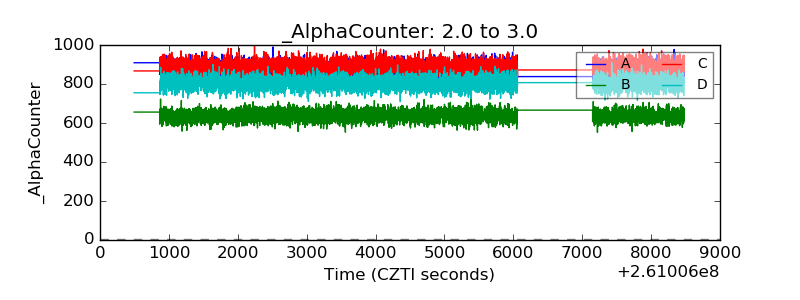 |
| _CPM_Rate | 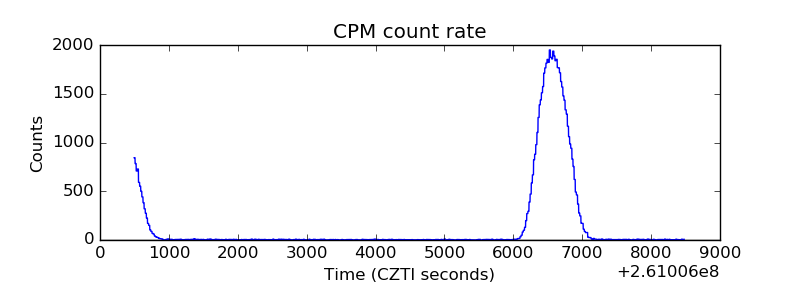 |
| CZT Counter | 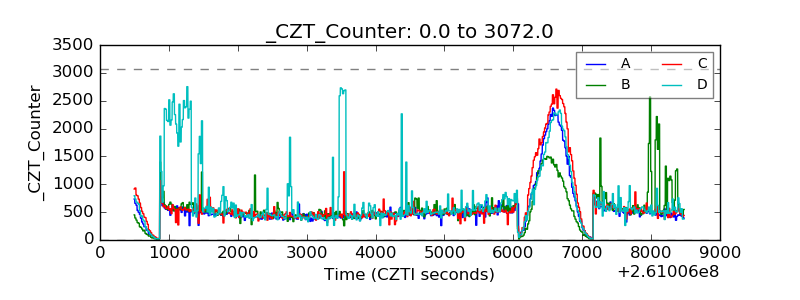 |
| +2.5 Volts monitor |  |
| +5 Volts monitor |  |
| _ROLL_ROT | 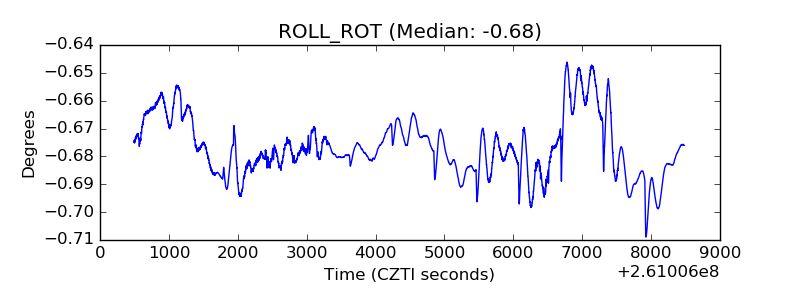 |
| _Roll_DEC | 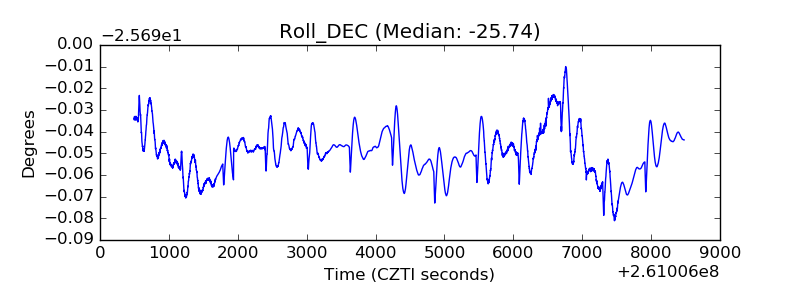 |
| _Roll_RA |  |
| Veto Counter | 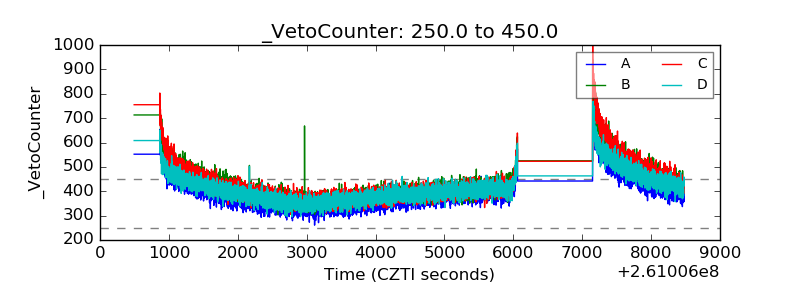 |