| Param | Original file | Final file |
|---|---|---|
| Filename | modeM0/AS1G08_070T01_9000002028_13690cztM0_level2.evt | modeM0/AS1G08_070T01_9000002028_13690cztM0_level2_quad_clean.evt |
| Size (bytes) | 508,204,800 | 98,104,320 |
| Size | 484.7 MB | 93.6 MB |
| Events in quadrant A | 3,051,073 | 654,384 |
| Events in quadrant B | 3,814,146 | 700,040 |
| Events in quadrant C | 3,200,219 | 641,022 |
| Events in quadrant D | 4,902,562 | 540,308 |
| Mode SS | |||
|---|---|---|---|
| Quadrant | BADHDUFLAG | Total packets | Discarded packets |
| A | 0 | 128 | 0 |
| B | 0 | 128 | 0 |
| C | 0 | 128 | 0 |
| D | 0 | 128 | 0 |
| Mode M9 | |||
|---|---|---|---|
| Quadrant | BADHDUFLAG | Total packets | Discarded packets |
| A | 0 | 21 | 0 |
| B | 0 | 21 | 0 |
| C | 0 | 21 | 0 |
| D | 0 | 22 | 0 |
| Mode M0 | |||
|---|---|---|---|
| Quadrant | BADHDUFLAG | Total packets | Discarded packets |
| A | 0 | 12938 | 3 |
| B | 0 | 15160 | 2 |
| C | 0 | 13347 | 2 |
| D | 0 | 18686 | 2 |
| Quadrant | Total seconds | Saturated seconds | Saturation percentage |
|---|---|---|---|
| A | 6228 | 8 | 0.128452% |
| B | 6228 | 198 | 3.179191% |
| C | 6228 | 4 | 0.064226% |
| D | 6228 | 650 | 10.436737% |
Noise dominated data is calculated using 1-second bins in cleaned event files. If a bin has >2000 counts, and if more than 50% of those come from <1% of pixels, then it is considered to be noise-dominated and hence unusable.
| Quadrant | # 1 sec bins | Bins with >0 counts | Bins with >2000 counts | High rate bins dominated by noise | Noise dominated (total time) | Noise dominated (detector-on time) | Marked lightcurve |
|---|---|---|---|---|---|---|---|
| A | 7454 | 6230 | 0 | 0 | 0.00% | 0.00% | 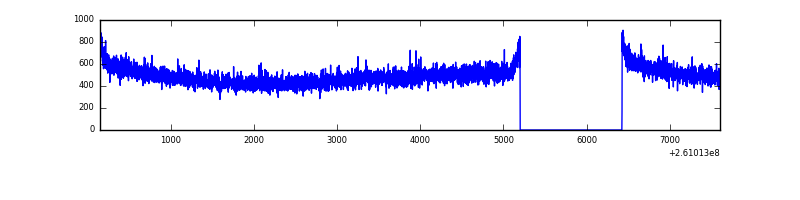 |
| B | 7454 | 6230 | 85 | 85 | 1.14% | 1.36% | 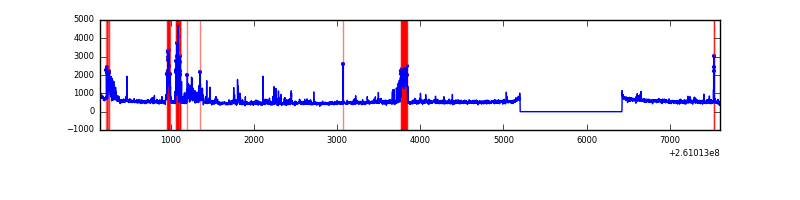 |
| C | 7454 | 6230 | 0 | 0 | 0.00% | 0.00% | 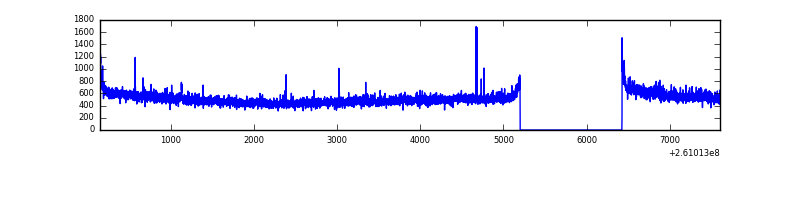 |
| D | 7454 | 6230 | 519 | 519 | 6.96% | 8.33% | 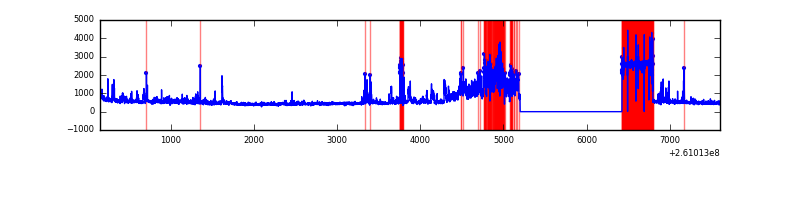 |
Top three noisy pixels from each quadrant. If the there are fewer than three noisy pixels in the level2.evt file, extra rows are filled as -1
| Pixel properties | Quadrant properties | ||||||
|---|---|---|---|---|---|---|---|
| Quadrant | DetID | PixID | Counts | Sigma | Mean | Median | Sigma |
| A | 0 | 226 | 6996 | 38.76 | 792 | 774 | 160.5 |
| A | 1 | 162 | 6609 | 36.35 | 792 | 774 | 160.5 |
| A | 12 | 194 | 5776 | 31.16 | 792 | 774 | 160.5 |
| B | 0 | 219 | 369886 | 2469.41 | 801 | 788 | 149.5 |
| B | 8 | 250 | 281534 | 1878.3 | 801 | 788 | 149.5 |
| B | 12 | 111 | 16827 | 107.31 | 801 | 788 | 149.5 |
| C | 3 | 233 | 164202 | 908.78 | 776 | 783 | 179.8 |
| C | 14 | 234 | 11890 | 61.77 | 776 | 783 | 179.8 |
| C | 13 | 61 | 5536 | 26.43 | 776 | 783 | 179.8 |
| D | 13 | 122 | 1660505 | 9775.95 | 704 | 685 | 169.8 |
| D | 5 | 222 | 347435 | 2042.27 | 704 | 685 | 169.8 |
| D | 8 | 195 | 97921 | 572.69 | 704 | 685 | 169.8 |
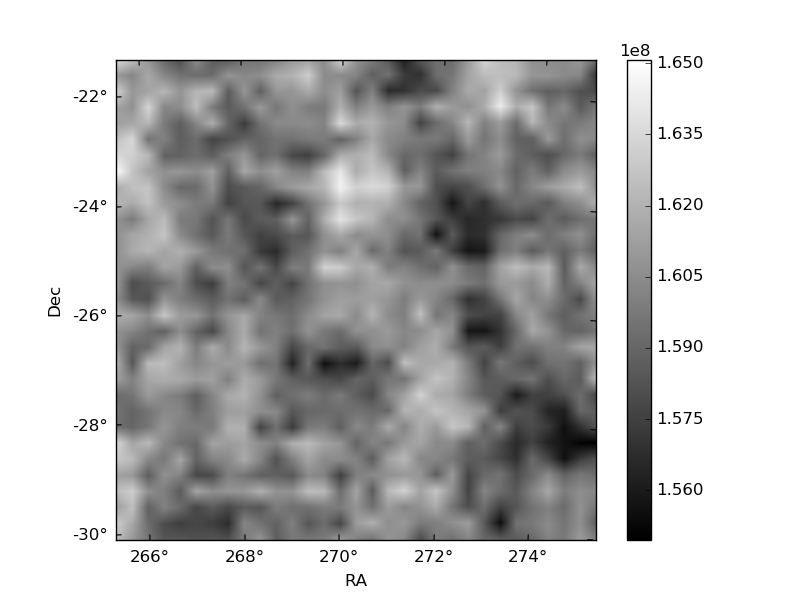
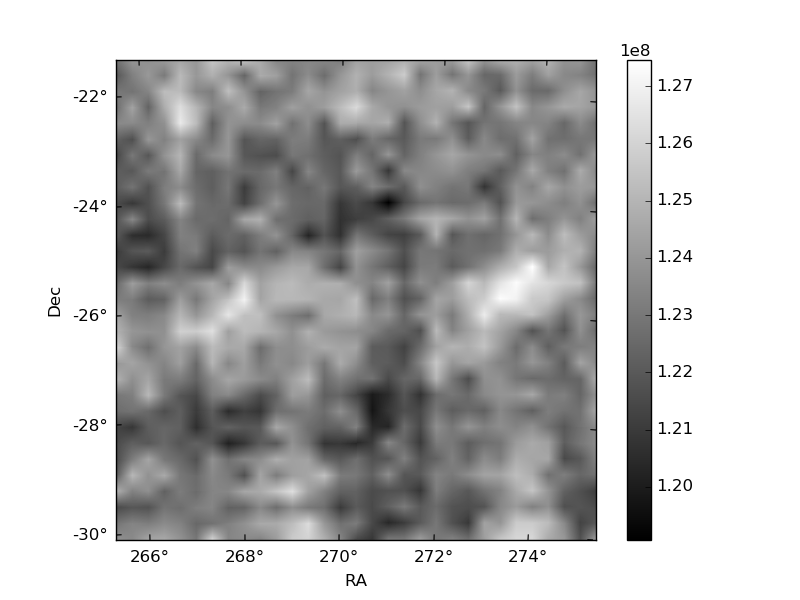
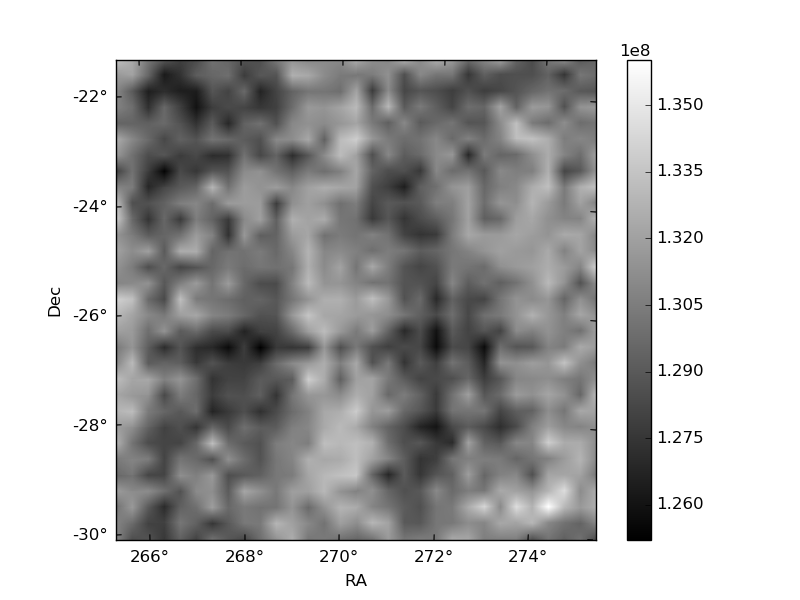
Histogram calculated using DETX and DETY for each event in the final _common_clean file
| Quadrant A | 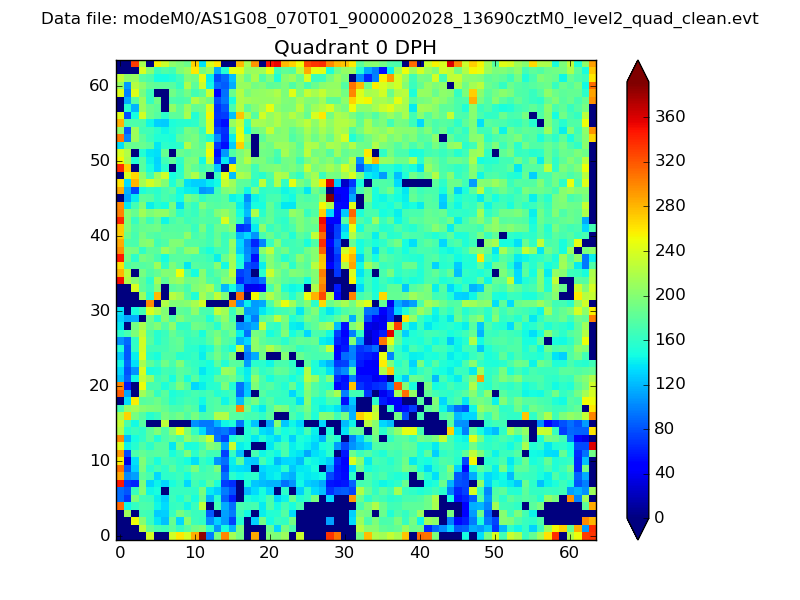 |
 |
Quadrant B |
|---|---|---|---|
| Quadrant D |  |
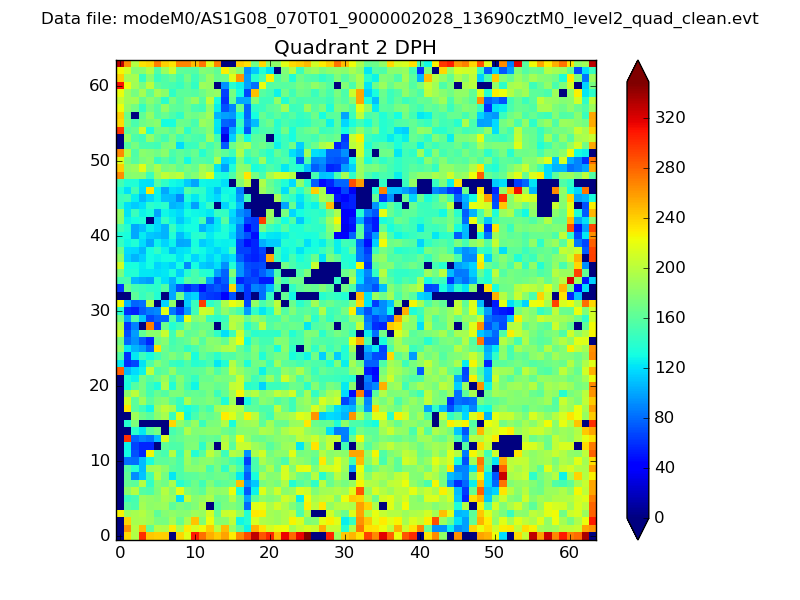 |
Quadrant C |
| Plot type | Count rate plots | Images |
|---|---|---|
| Comparison with Poisson distribution Blue bars denote a histogram of data divided into 1 sec bins. Red curve is a Poisson curve with rate = median count rate of data. |
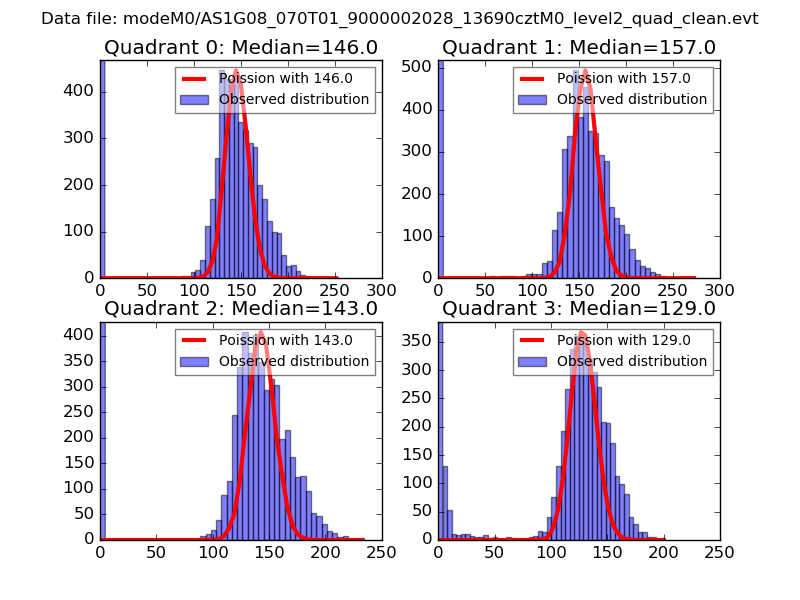 |
 |
| Quadrant-wise count rates Data is divided into 100 sec bins |
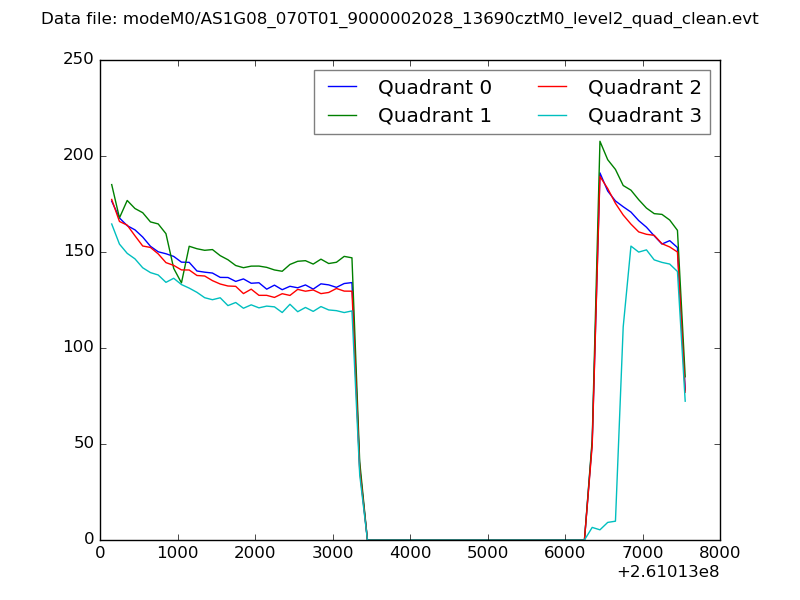 |
|
| Module-wise count rates for Quadrant A Data is divided into 100 sec bins |
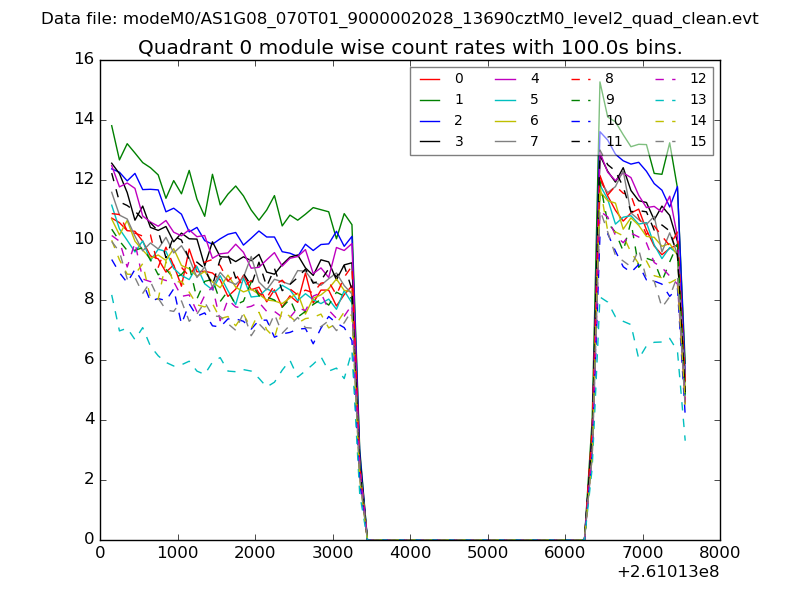 |
 |
| Module-wise count rates for Quadrant B Data is divided into 100 sec bins |
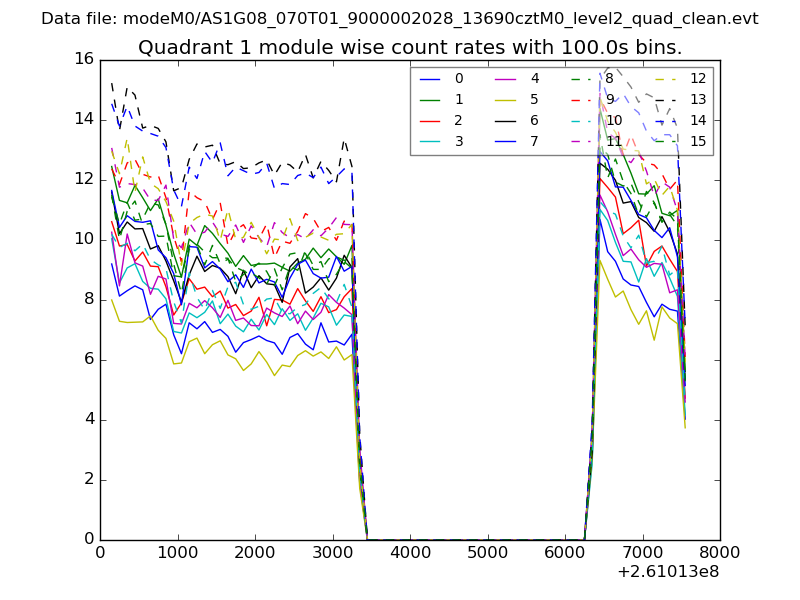 |
 |
| Module-wise count rates for Quadrant C Data is divided into 100 sec bins |
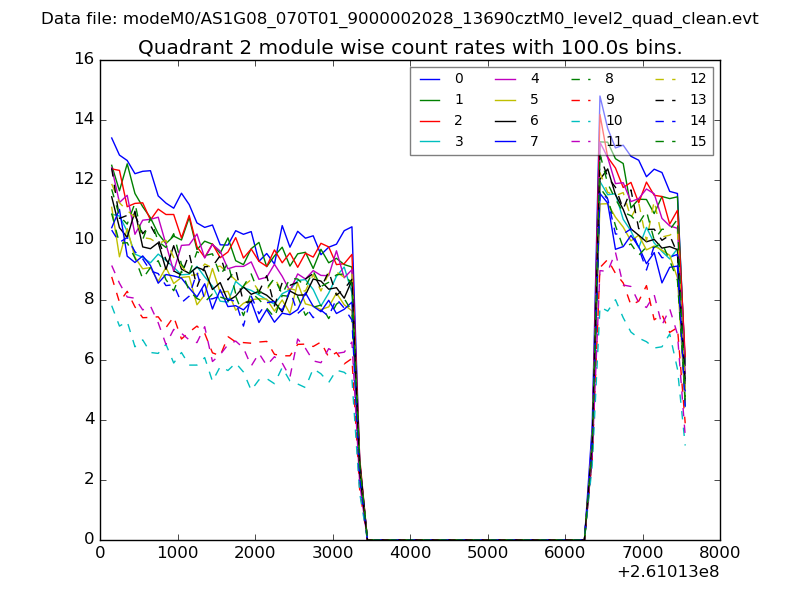 |
 |
| Module-wise count rates for Quadrant D Data is divided into 100 sec bins |
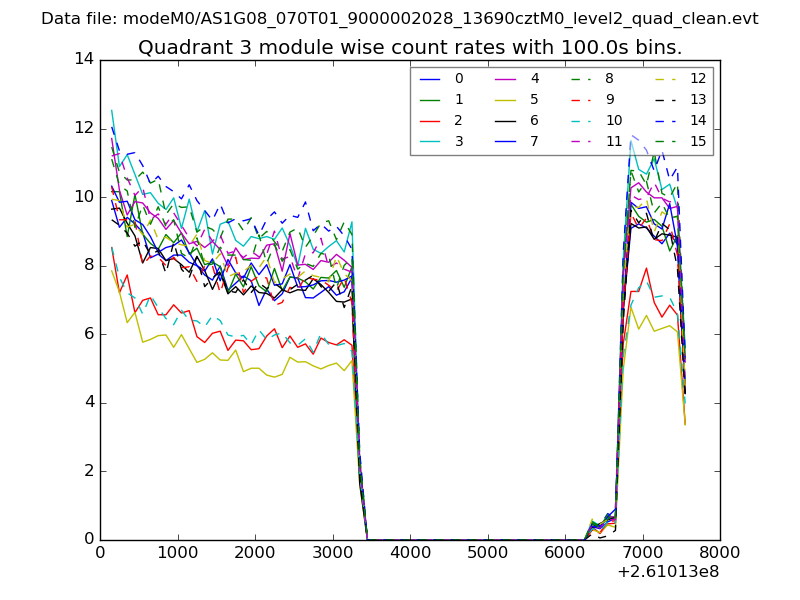 |
 |
| Parameter | Plot |
|---|---|
| CZT HV Monitor | 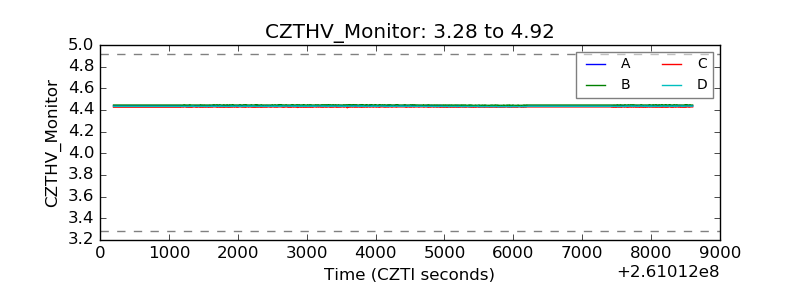 |
| D_VDD | 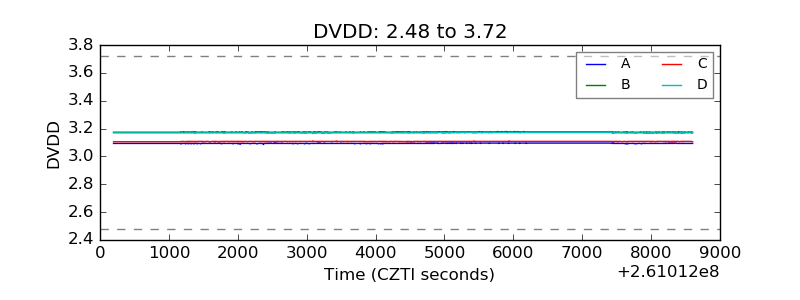 |
| Temperature 1 | 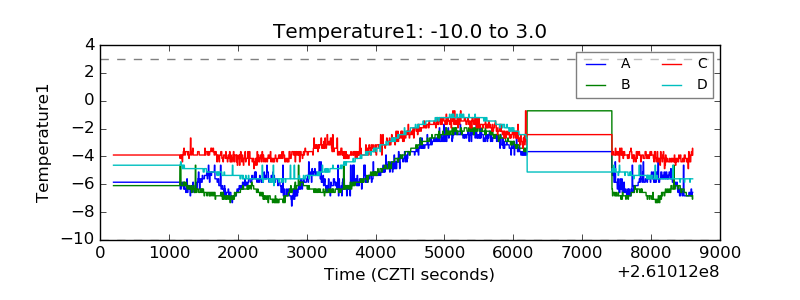 |
| Veto HV Monitor | 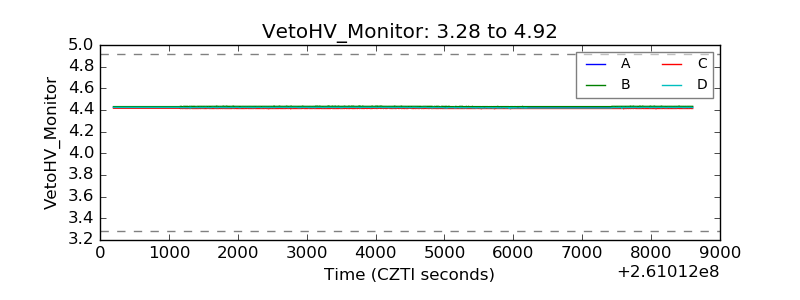 |
| Veto LLD | 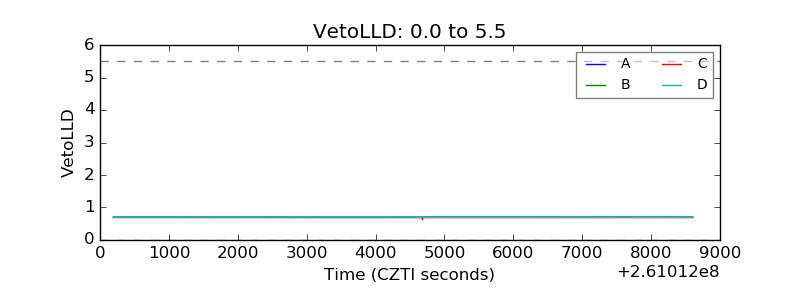 |
| Alpha Counter | 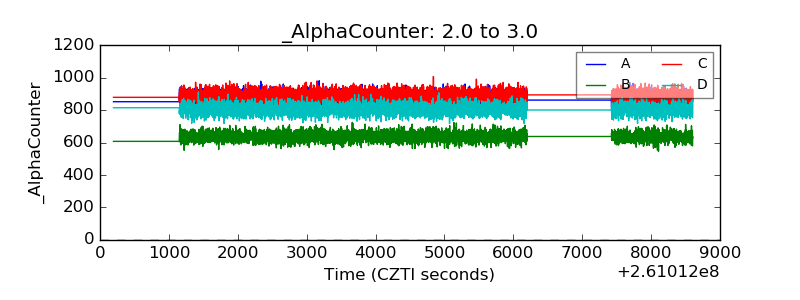 |
| _CPM_Rate | 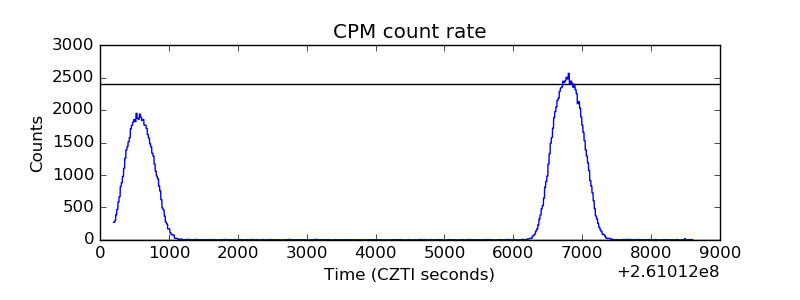 |
| CZT Counter | 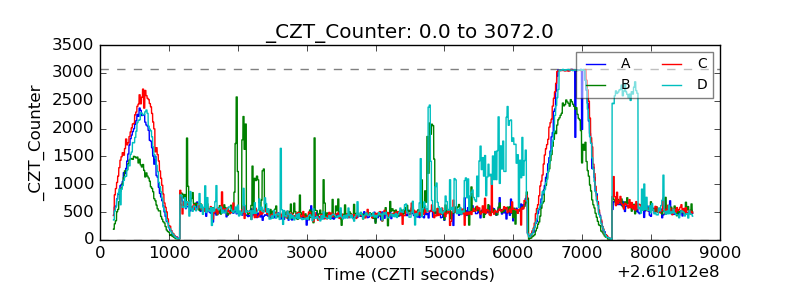 |
| +2.5 Volts monitor |  |
| +5 Volts monitor |  |
| _ROLL_ROT | 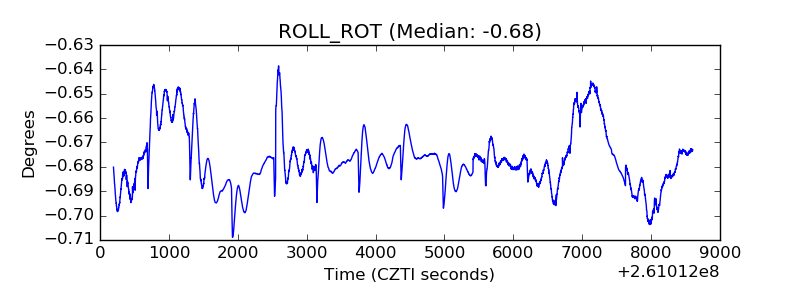 |
| _Roll_DEC | 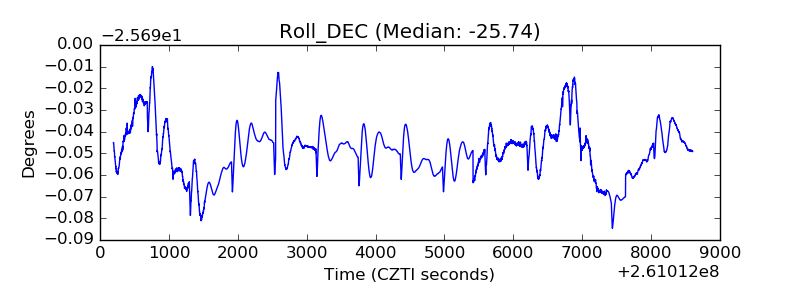 |
| _Roll_RA | 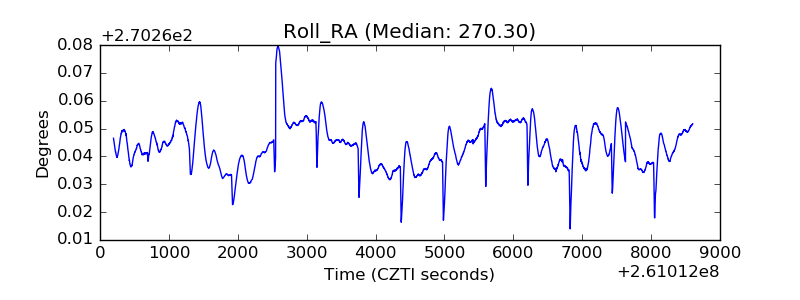 |
| Veto Counter | 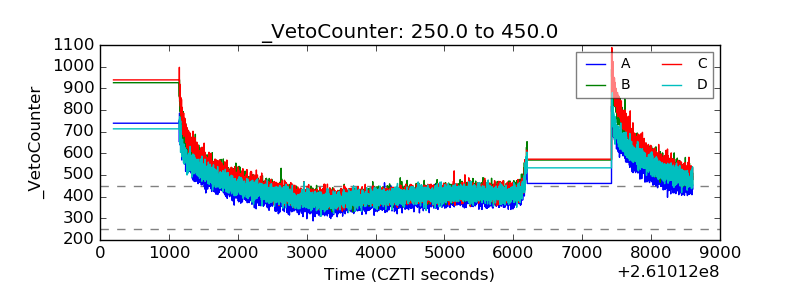 |