| Param | Original file | Final file |
|---|---|---|
| Filename | modeM0/AS1G08_070T01_9000002028_13691cztM0_level2.evt | modeM0/AS1G08_070T01_9000002028_13691cztM0_level2_quad_clean.evt |
| Size (bytes) | 557,326,080 | 105,693,120 |
| Size | 531.5 MB | 100.8 MB |
| Events in quadrant A | 3,386,739 | 707,358 |
| Events in quadrant B | 3,992,370 | 758,036 |
| Events in quadrant C | 3,551,852 | 692,126 |
| Events in quadrant D | 5,500,461 | 582,989 |
| Mode SS | |||
|---|---|---|---|
| Quadrant | BADHDUFLAG | Total packets | Discarded packets |
| A | 0 | 134 | 0 |
| B | 0 | 134 | 0 |
| C | 0 | 134 | 0 |
| D | 0 | 134 | 0 |
| Mode M9 | |||
|---|---|---|---|
| Quadrant | BADHDUFLAG | Total packets | Discarded packets |
| A | 0 | 15 | 0 |
| B | 0 | 15 | 0 |
| C | 0 | 15 | 0 |
| D | 0 | 16 | 0 |
| Mode M0 | |||
|---|---|---|---|
| Quadrant | BADHDUFLAG | Total packets | Discarded packets |
| A | 0 | 13987 | 3 |
| B | 0 | 15985 | 2 |
| C | 0 | 14497 | 2 |
| D | 0 | 20639 | 2 |
| Quadrant | Total seconds | Saturated seconds | Saturation percentage |
|---|---|---|---|
| A | 6602 | 23 | 0.348379% |
| B | 6602 | 67 | 1.014844% |
| C | 6602 | 17 | 0.257498% |
| D | 6602 | 479 | 7.255377% |
Noise dominated data is calculated using 1-second bins in cleaned event files. If a bin has >2000 counts, and if more than 50% of those come from <1% of pixels, then it is considered to be noise-dominated and hence unusable.
| Quadrant | # 1 sec bins | Bins with >0 counts | Bins with >2000 counts | High rate bins dominated by noise | Noise dominated (total time) | Noise dominated (detector-on time) | Marked lightcurve |
|---|---|---|---|---|---|---|---|
| A | 7888 | 6604 | 0 | 0 | 0.00% | 0.00% | 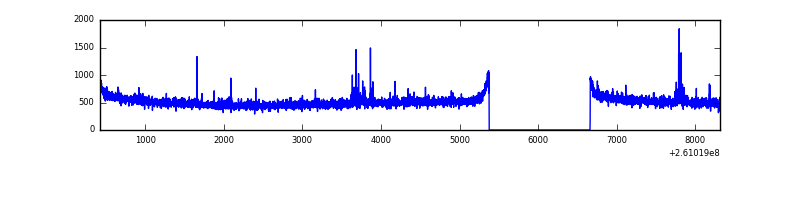 |
| B | 7888 | 6604 | 16 | 16 | 0.20% | 0.24% | 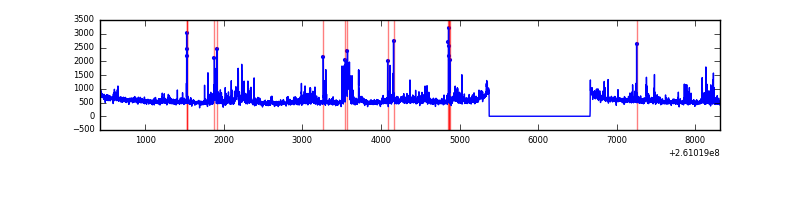 |
| C | 7888 | 6604 | 0 | 0 | 0.00% | 0.00% | 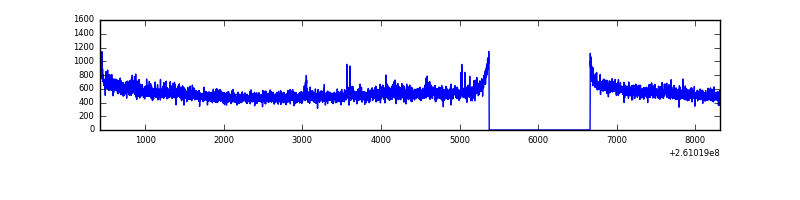 |
| D | 7888 | 6604 | 413 | 413 | 5.24% | 6.25% | 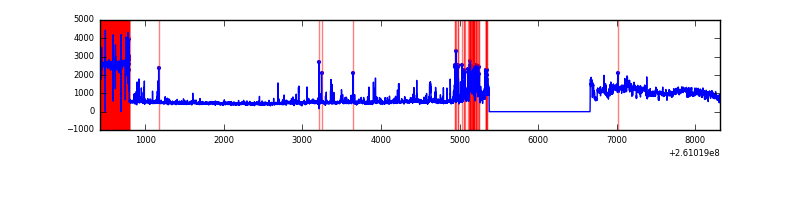 |
Top three noisy pixels from each quadrant. If the there are fewer than three noisy pixels in the level2.evt file, extra rows are filled as -1
| Pixel properties | Quadrant properties | ||||||
|---|---|---|---|---|---|---|---|
| Quadrant | DetID | PixID | Counts | Sigma | Mean | Median | Sigma |
| A | 1 | 162 | 30906 | 171.68 | 866 | 851 | 175.1 |
| A | 1 | 178 | 10498 | 55.11 | 866 | 851 | 175.1 |
| A | 1 | 161 | 9841 | 51.35 | 866 | 851 | 175.1 |
| B | 0 | 219 | 387586 | 2359.77 | 879 | 864 | 163.9 |
| B | 3 | 64 | 48622 | 291.42 | 879 | 864 | 163.9 |
| B | 4 | 48 | 38942 | 232.35 | 879 | 864 | 163.9 |
| C | 3 | 233 | 247356 | 1264.02 | 847 | 854 | 195.0 |
| C | 13 | 61 | 6135 | 27.08 | 847 | 854 | 195.0 |
| C | 12 | 4 | 3583 | 13.99 | 847 | 854 | 195.0 |
| D | 13 | 122 | 1927219 | 10298.94 | 784 | 766 | 187.1 |
| D | 5 | 222 | 422767 | 2256.04 | 784 | 766 | 187.1 |
| D | 8 | 195 | 122322 | 649.85 | 784 | 766 | 187.1 |
Histogram calculated using DETX and DETY for each event in the final _common_clean file
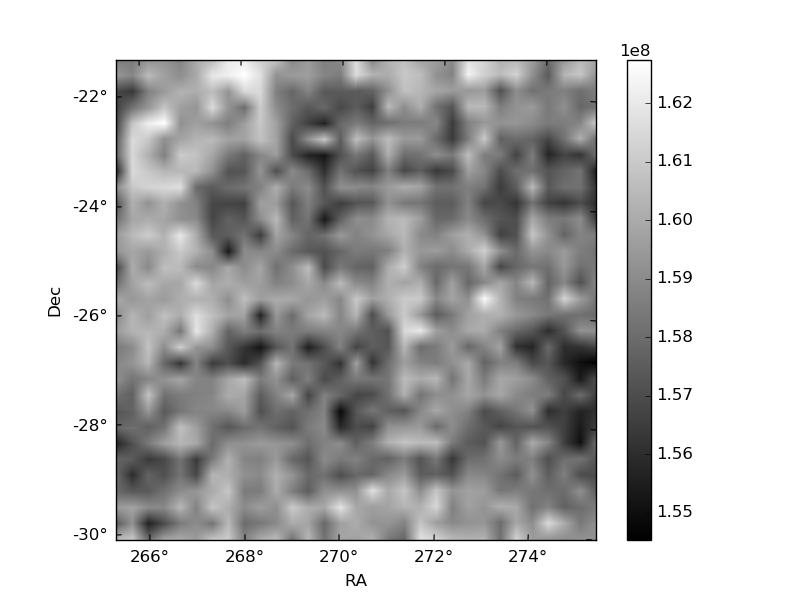
| Quadrant A |  |
 |
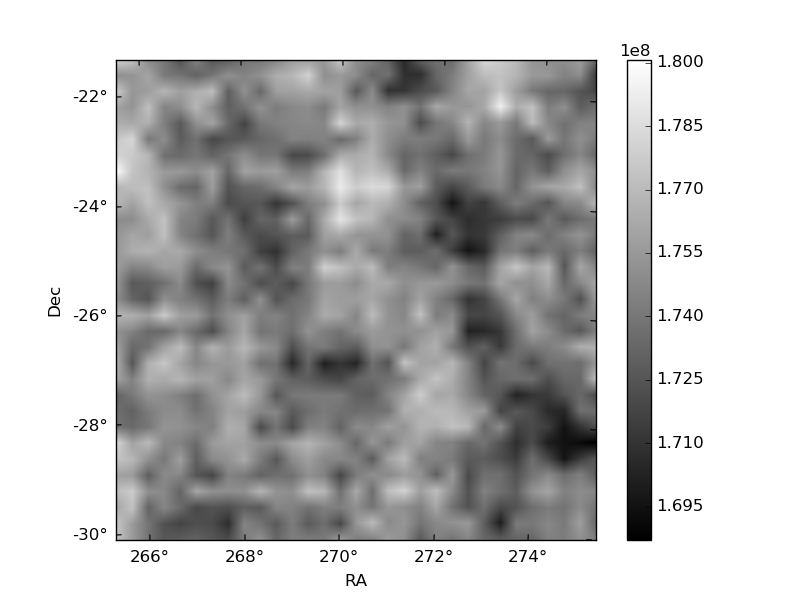
Quadrant B |
|---|---|---|---|
| Quadrant D |  |
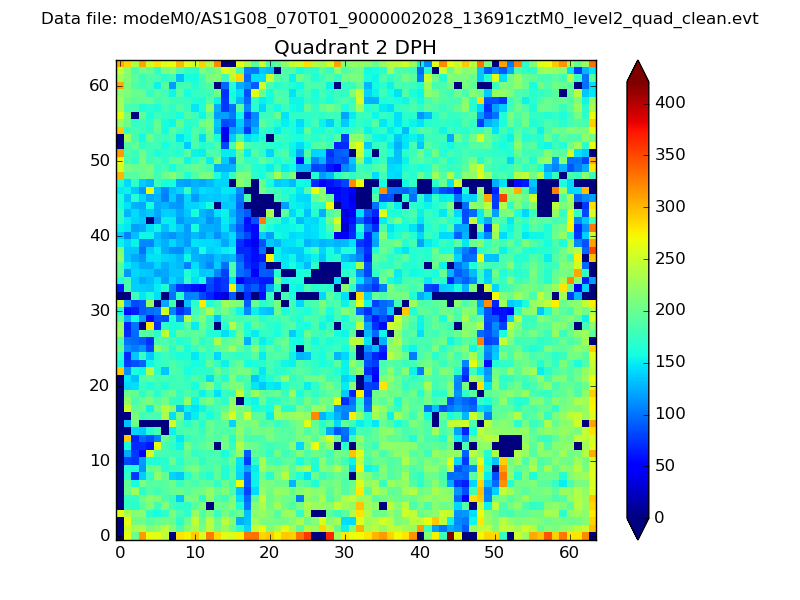 |
Quadrant C |
| Plot type | Count rate plots | Images |
|---|---|---|
| Comparison with Poisson distribution Blue bars denote a histogram of data divided into 1 sec bins. Red curve is a Poisson curve with rate = median count rate of data. |
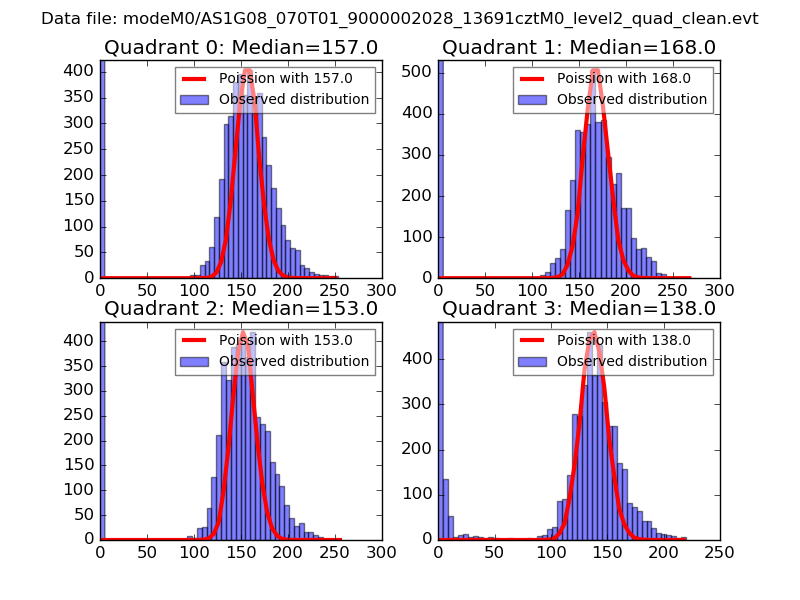 |
 |
| Quadrant-wise count rates Data is divided into 100 sec bins |
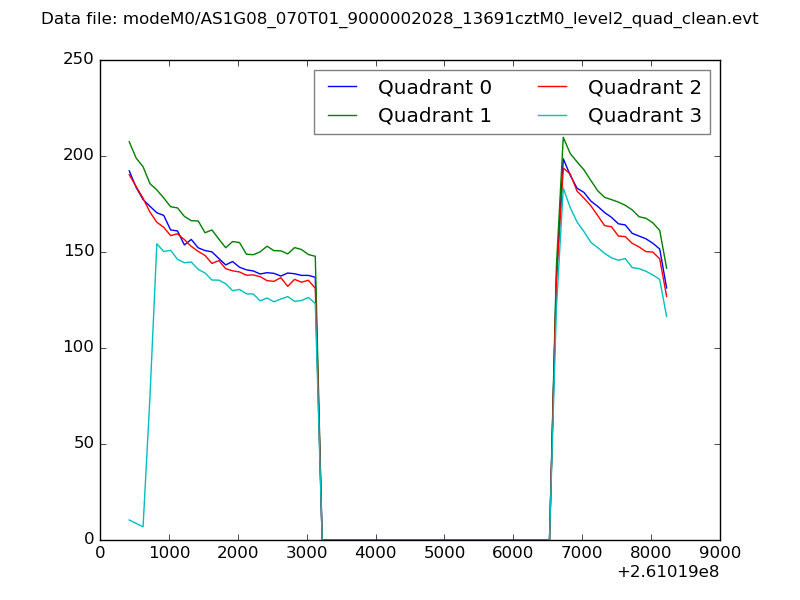 |
|
| Module-wise count rates for Quadrant A Data is divided into 100 sec bins |
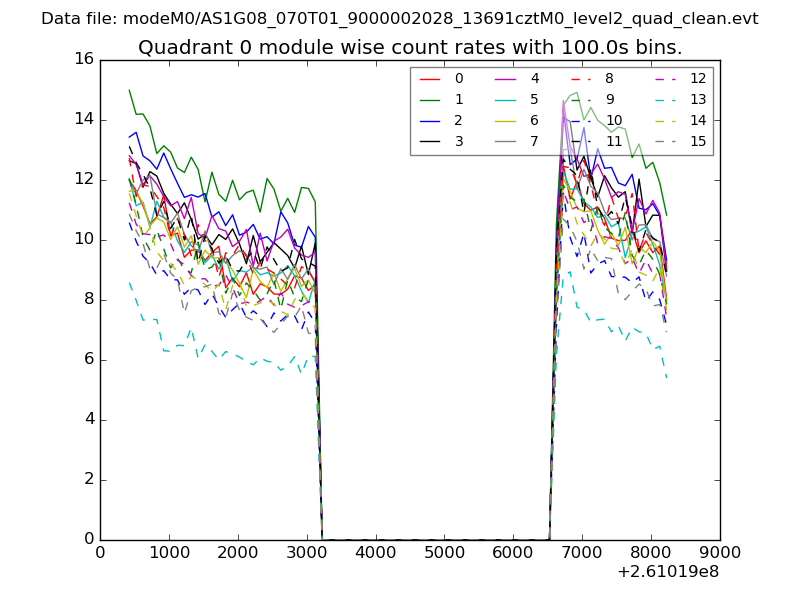 |
 |
| Module-wise count rates for Quadrant B Data is divided into 100 sec bins |
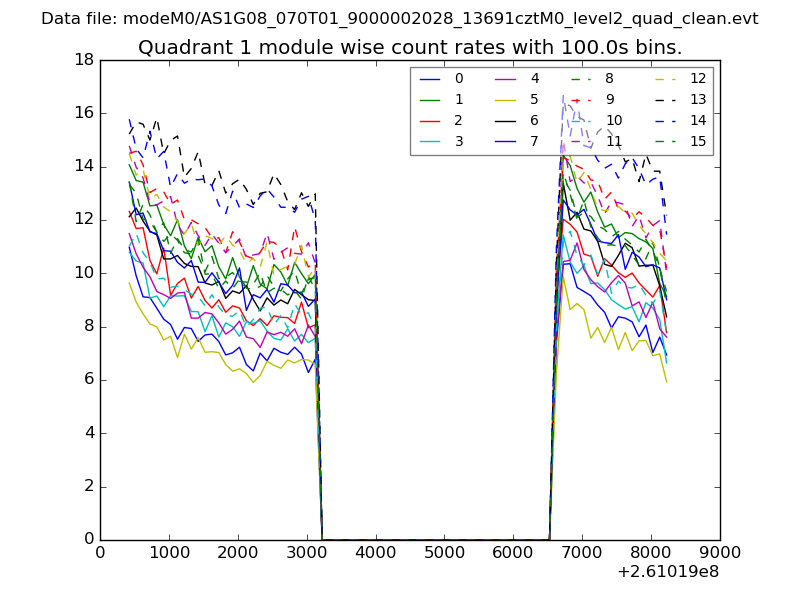 |
 |
| Module-wise count rates for Quadrant C Data is divided into 100 sec bins |
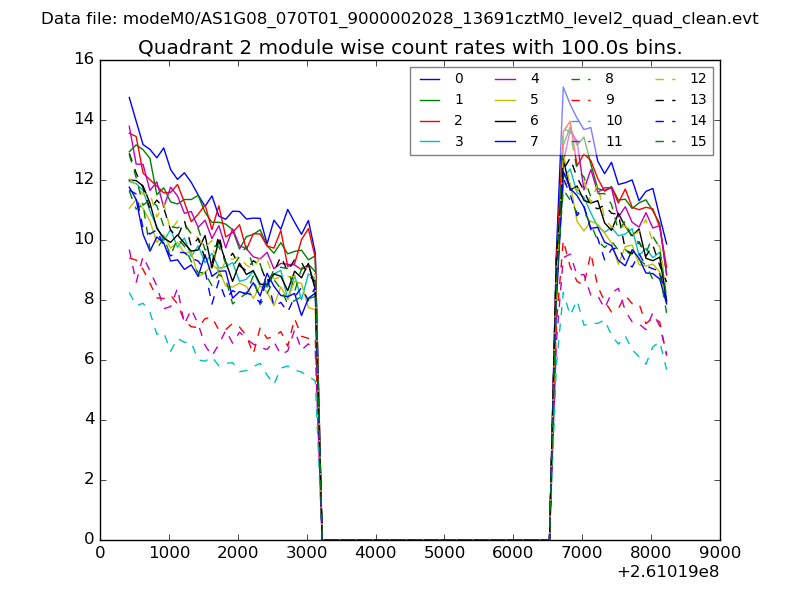 |
 |
| Module-wise count rates for Quadrant D Data is divided into 100 sec bins |
 |
 |
| Parameter | Plot |
|---|---|
| CZT HV Monitor | 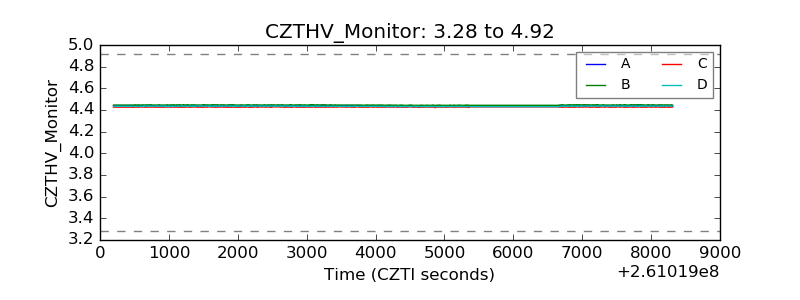 |
| D_VDD | 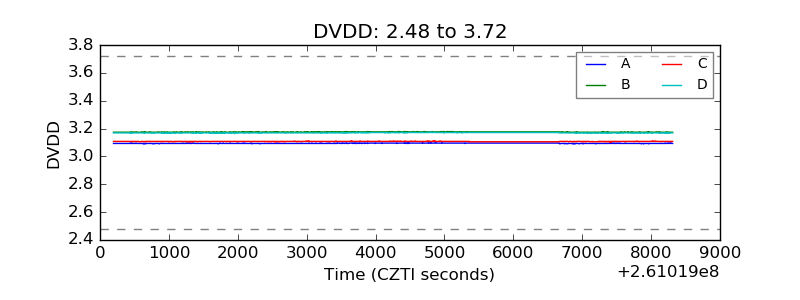 |
| Temperature 1 | 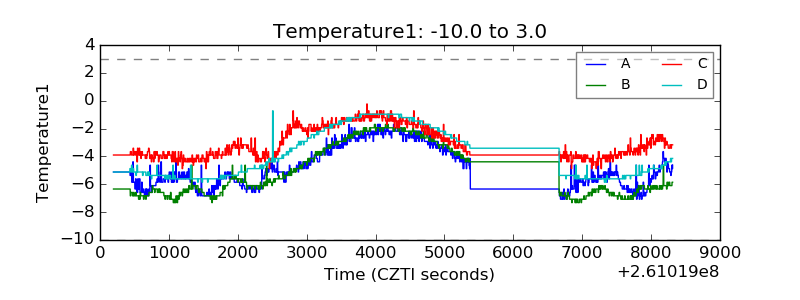 |
| Veto HV Monitor | 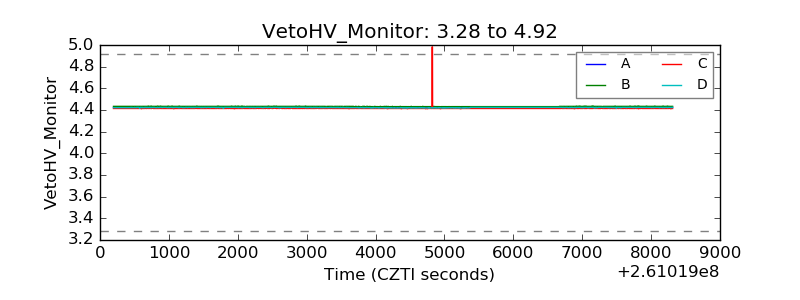 |
| Veto LLD |  |
| Alpha Counter | 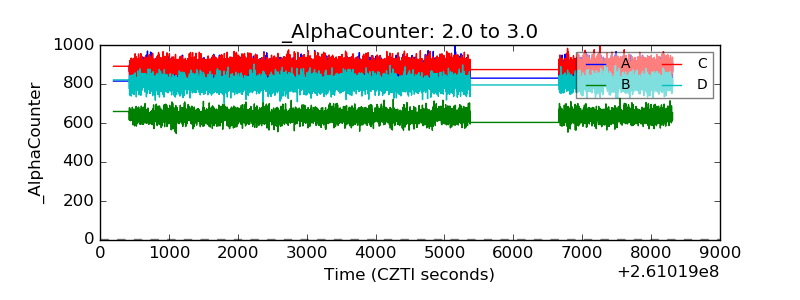 |
| _CPM_Rate | 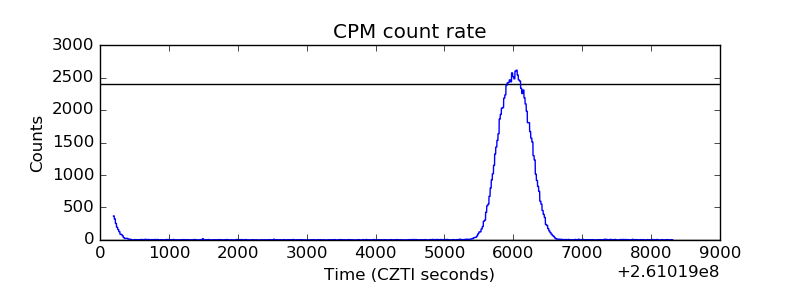 |
| CZT Counter | 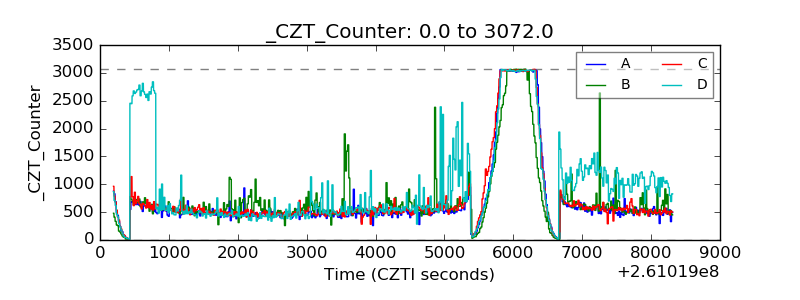 |
| +2.5 Volts monitor | 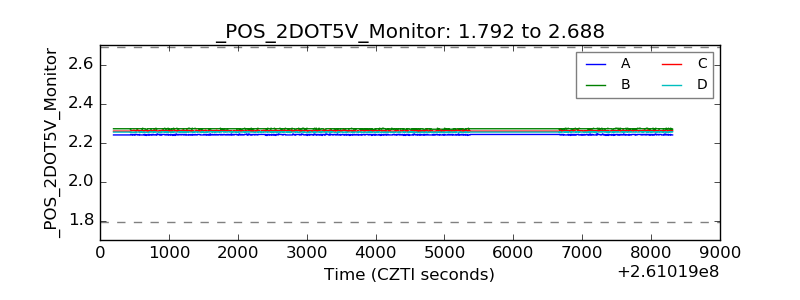 |
| +5 Volts monitor |  |
| _ROLL_ROT | 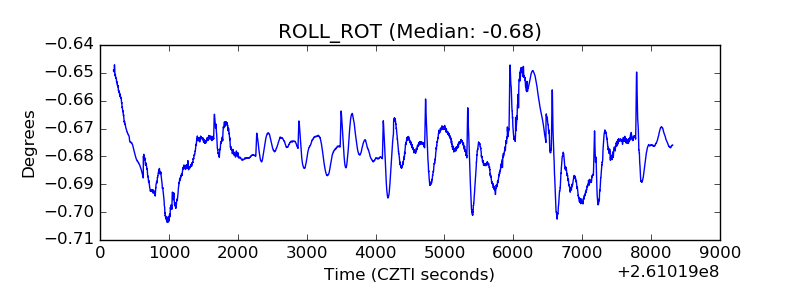 |
| _Roll_DEC | 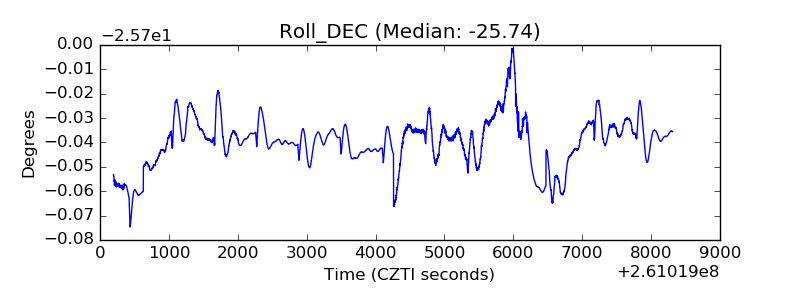 |
| _Roll_RA | 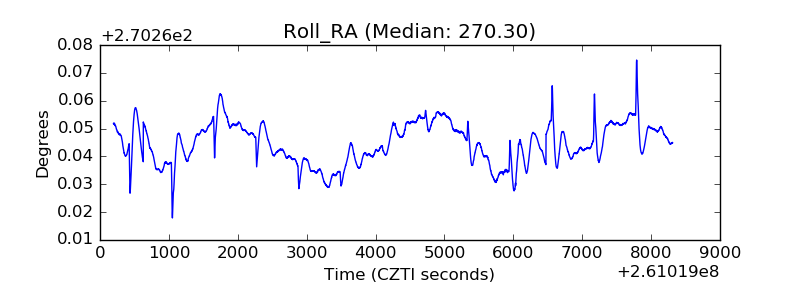 |
| Veto Counter | 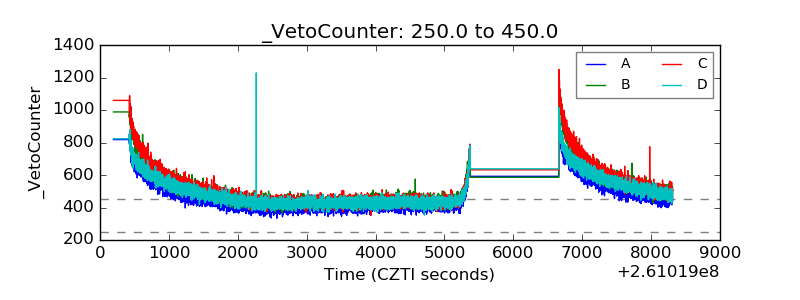 |