| Param | Original file | Final file |
|---|---|---|
| Filename | modeM0/AS1G08_070T01_9000002028_13693cztM0_level2.evt | modeM0/AS1G08_070T01_9000002028_13693cztM0_level2_quad_clean.evt |
| Size (bytes) | 557,412,480 | 102,188,160 |
| Size | 531.6 MB | 97.5 MB |
| Events in quadrant A | 3,373,637 | 681,940 |
| Events in quadrant B | 4,616,612 | 687,835 |
| Events in quadrant C | 3,424,710 | 656,851 |
| Events in quadrant D | 5,029,328 | 617,904 |
| Mode SS | |||
|---|---|---|---|
| Quadrant | BADHDUFLAG | Total packets | Discarded packets |
| A | 0 | 130 | 0 |
| B | 0 | 130 | 0 |
| C | 0 | 130 | 0 |
| D | 0 | 130 | 0 |
| Mode M9 | |||
|---|---|---|---|
| Quadrant | BADHDUFLAG | Total packets | Discarded packets |
| A | 0 | 13 | 0 |
| B | 0 | 13 | 0 |
| C | 0 | 13 | 0 |
| D | 0 | 13 | 0 |
| Mode M0 | |||
|---|---|---|---|
| Quadrant | BADHDUFLAG | Total packets | Discarded packets |
| A | 0 | 13717 | 3 |
| B | 0 | 17469 | 2 |
| C | 0 | 13940 | 2 |
| D | 0 | 19339 | 2 |
| Quadrant | Total seconds | Saturated seconds | Saturation percentage |
|---|---|---|---|
| A | 6453 | 79 | 1.224237% |
| B | 6453 | 617 | 9.561444% |
| C | 6453 | 58 | 0.898807% |
| D | 6454 | 225 | 3.486210% |
Noise dominated data is calculated using 1-second bins in cleaned event files. If a bin has >2000 counts, and if more than 50% of those come from <1% of pixels, then it is considered to be noise-dominated and hence unusable.
| Quadrant | # 1 sec bins | Bins with >0 counts | Bins with >2000 counts | High rate bins dominated by noise | Noise dominated (total time) | Noise dominated (detector-on time) | Marked lightcurve |
|---|---|---|---|---|---|---|---|
| A | 7724 | 6455 | 0 | 0 | 0.00% | 0.00% | 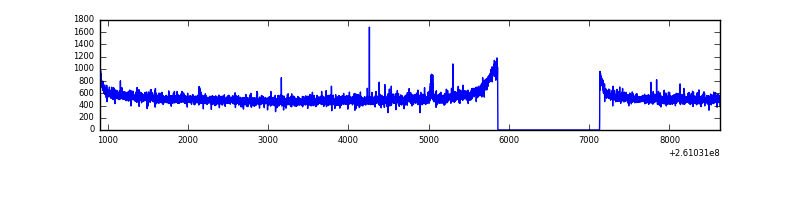 |
| B | 7724 | 6455 | 430 | 430 | 5.57% | 6.66% | 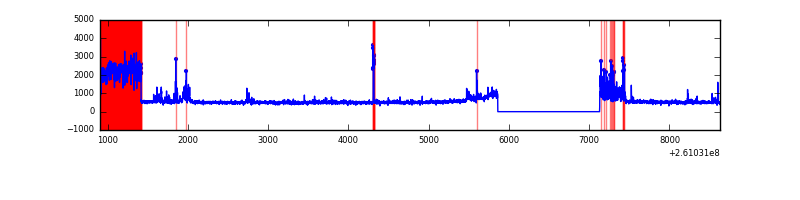 |
| C | 7724 | 6455 | 0 | 0 | 0.00% | 0.00% | 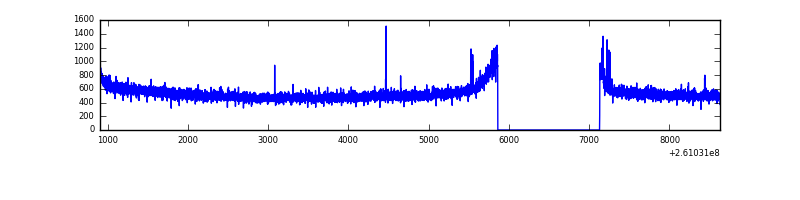 |
| D | 7725 | 6456 | 130 | 130 | 1.68% | 2.01% | 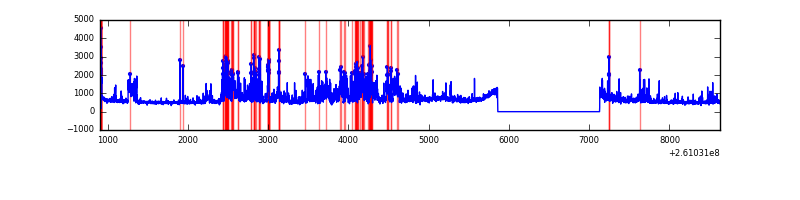 |
Top three noisy pixels from each quadrant. If the there are fewer than three noisy pixels in the level2.evt file, extra rows are filled as -1
| Pixel properties | Quadrant properties | ||||||
|---|---|---|---|---|---|---|---|
| Quadrant | DetID | PixID | Counts | Sigma | Mean | Median | Sigma |
| A | 15 | 69 | 11942 | 63.15 | 871 | 856 | 175.5 |
| A | 1 | 162 | 8542 | 43.79 | 871 | 856 | 175.5 |
| A | 0 | 226 | 7753 | 39.29 | 871 | 856 | 175.5 |
| B | 3 | 64 | 892597 | 5636.82 | 849 | 833 | 158.2 |
| B | 8 | 250 | 267892 | 1688.07 | 849 | 833 | 158.2 |
| B | 0 | 219 | 93333 | 584.69 | 849 | 833 | 158.2 |
| C | 3 | 233 | 147508 | 758.31 | 840 | 846 | 193.4 |
| C | 13 | 61 | 5944 | 26.36 | 840 | 846 | 193.4 |
| C | 14 | 234 | 3179 | 12.06 | 840 | 846 | 193.4 |
| D | 5 | 222 | 1251834 | 5769.79 | 825 | 813 | 216.8 |
| D | 13 | 122 | 315375 | 1450.78 | 825 | 813 | 216.8 |
| D | 8 | 195 | 186117 | 854.63 | 825 | 813 | 216.8 |
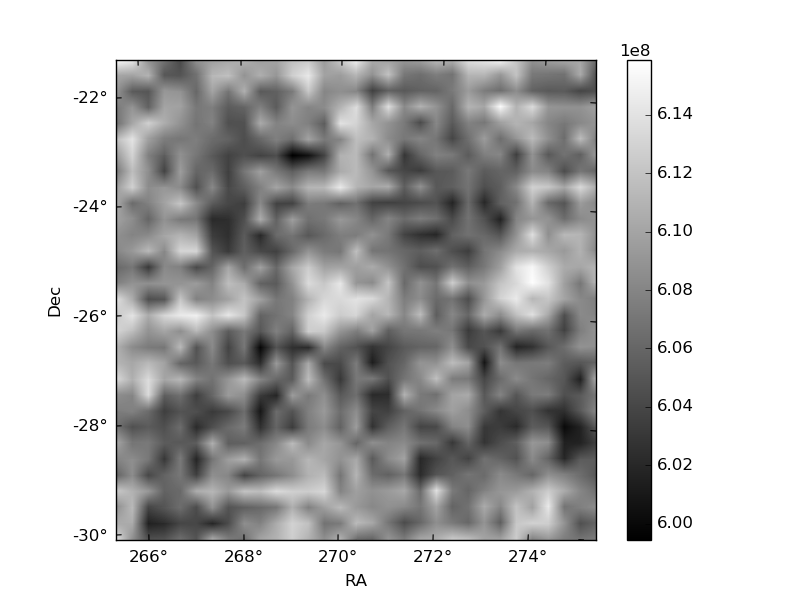
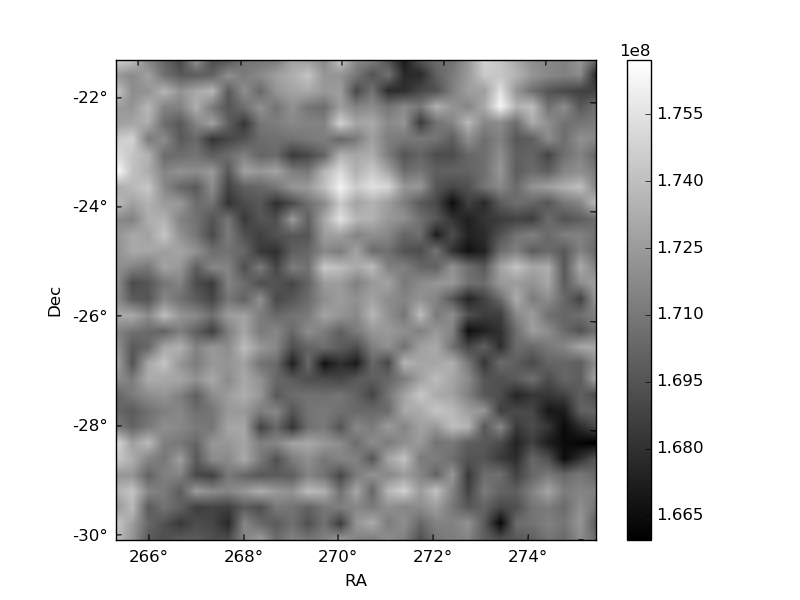
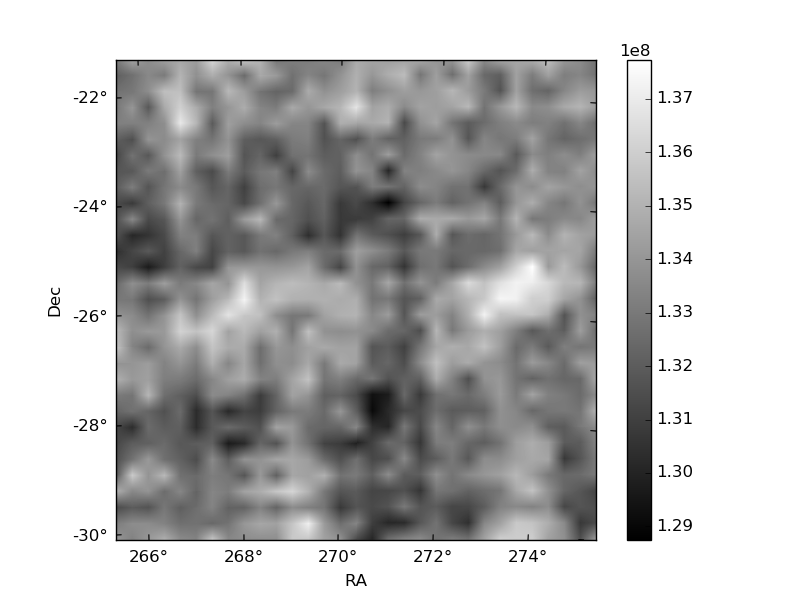
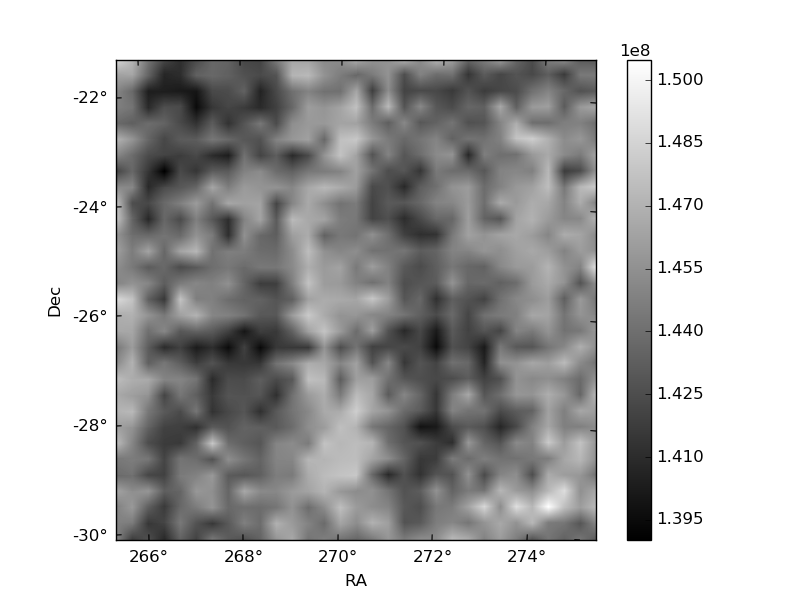
Histogram calculated using DETX and DETY for each event in the final _common_clean file
| Quadrant A | 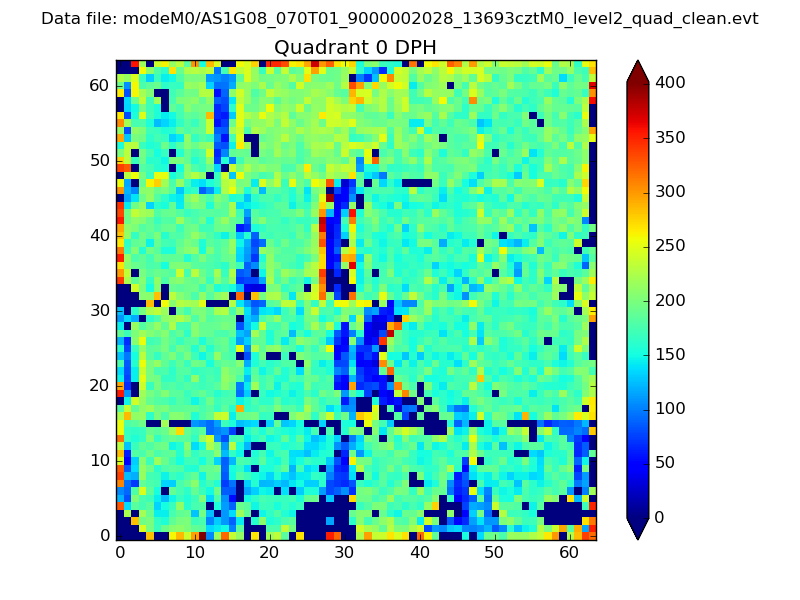 |
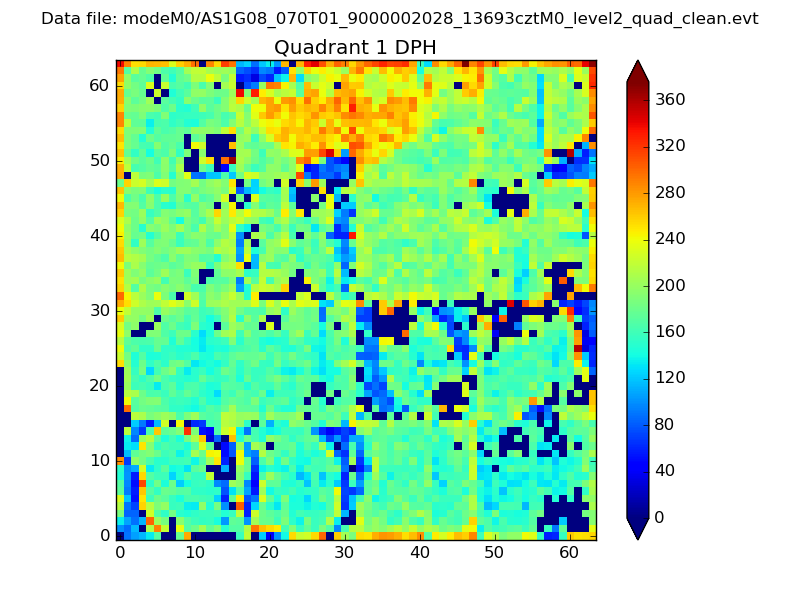 |
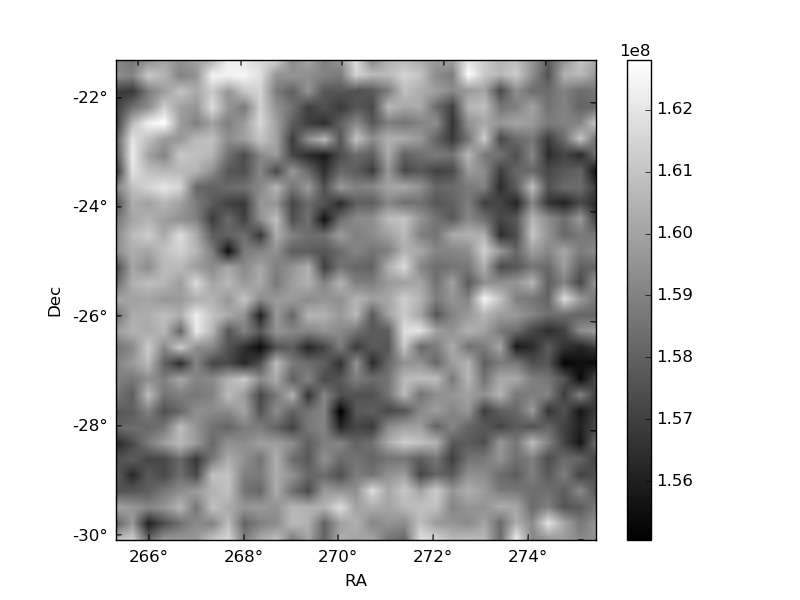
Quadrant B |
|---|---|---|---|
| Quadrant D | 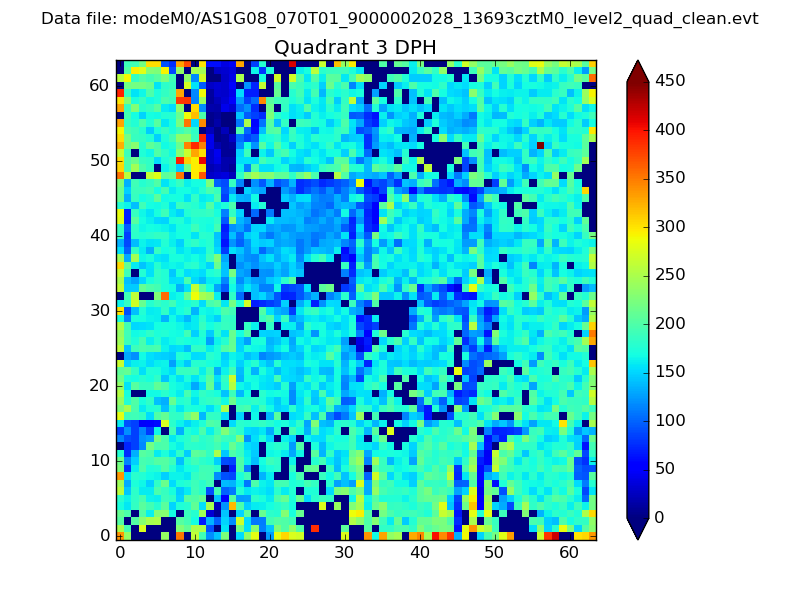 |
 |
Quadrant C |
| Plot type | Count rate plots | Images |
|---|---|---|
| Comparison with Poisson distribution Blue bars denote a histogram of data divided into 1 sec bins. Red curve is a Poisson curve with rate = median count rate of data. |
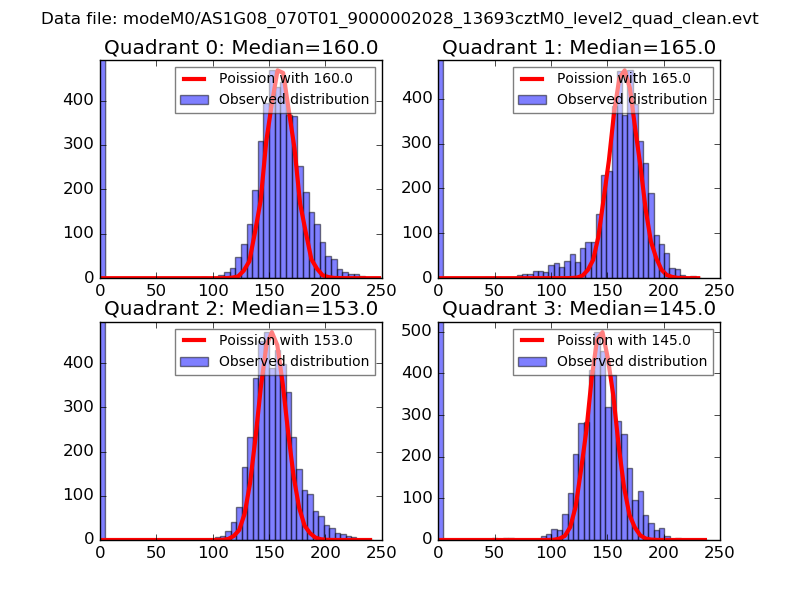 |
 |
| Quadrant-wise count rates Data is divided into 100 sec bins |
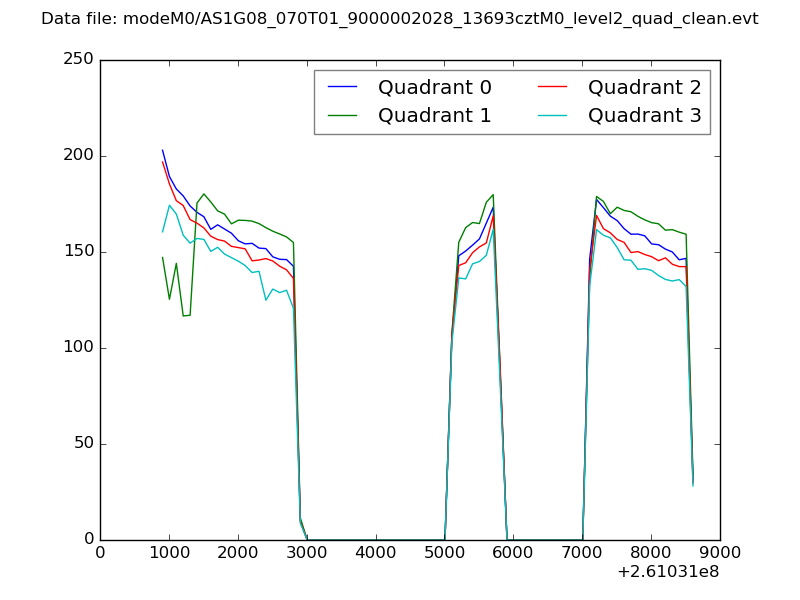 |
|
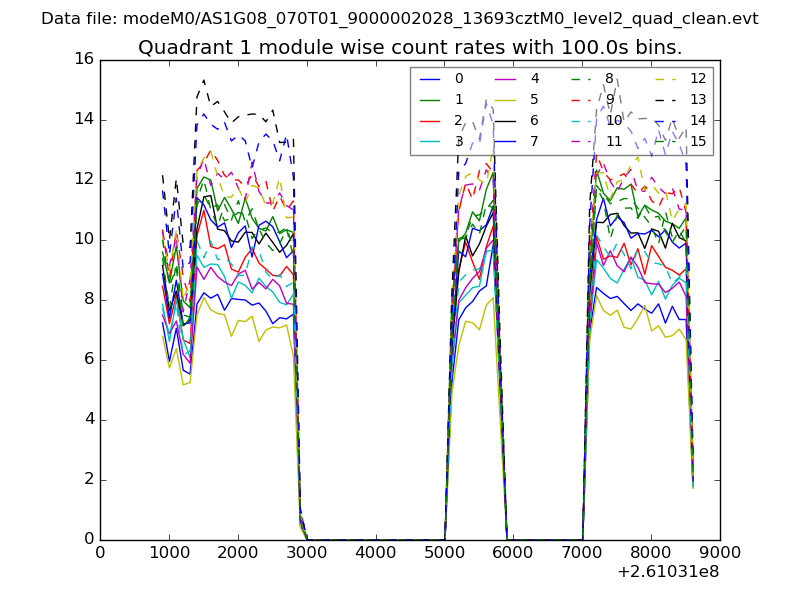
| Module-wise count rates for Quadrant A Data is divided into 100 sec bins |
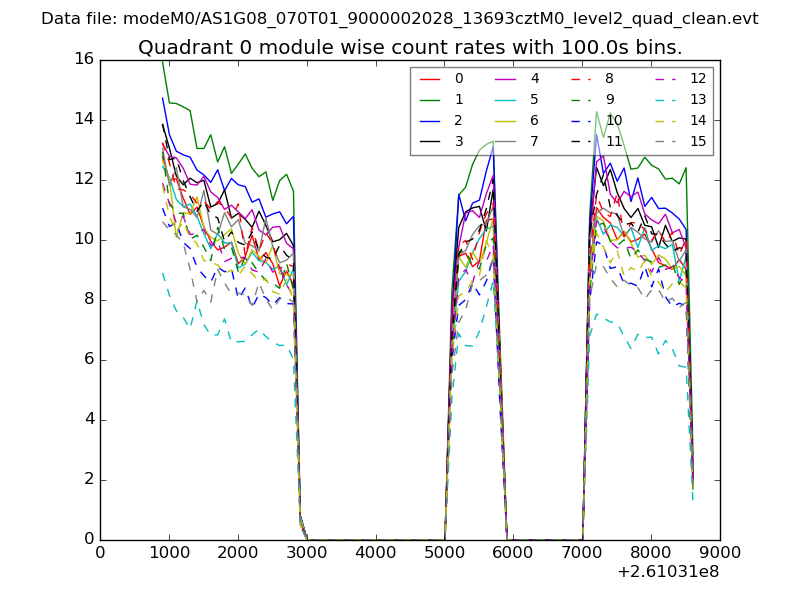 |
 |
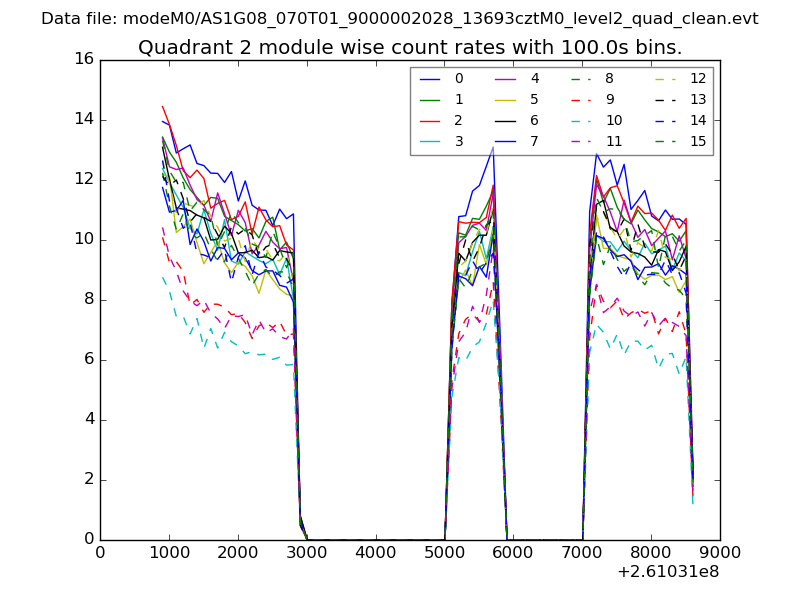
| Module-wise count rates for Quadrant B Data is divided into 100 sec bins |
 |
 |
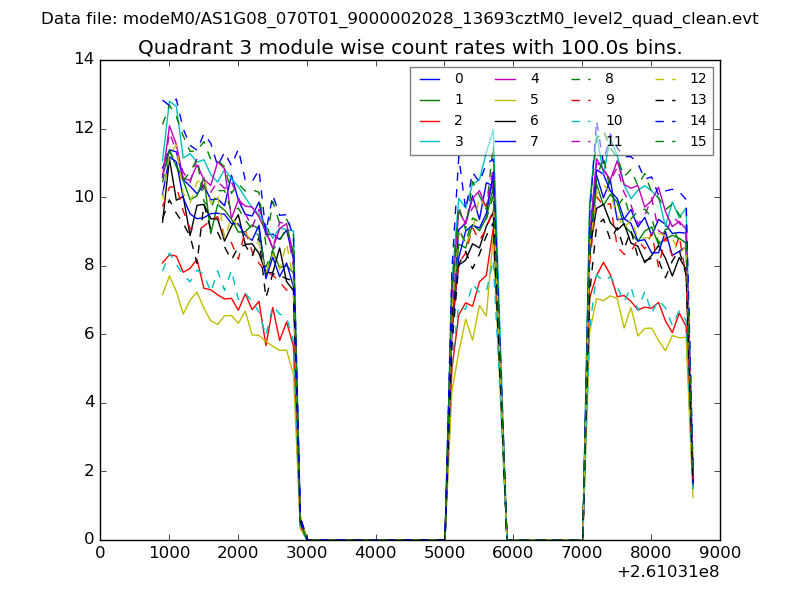
| Module-wise count rates for Quadrant C Data is divided into 100 sec bins |
 |
 |
| Module-wise count rates for Quadrant D Data is divided into 100 sec bins |
 |
 |
| Parameter | Plot |
|---|---|
| CZT HV Monitor | 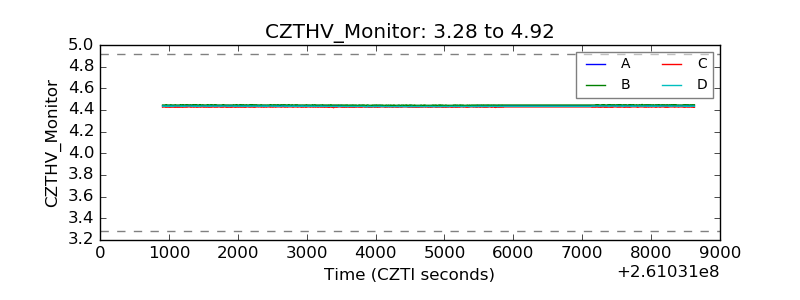 |
| D_VDD | 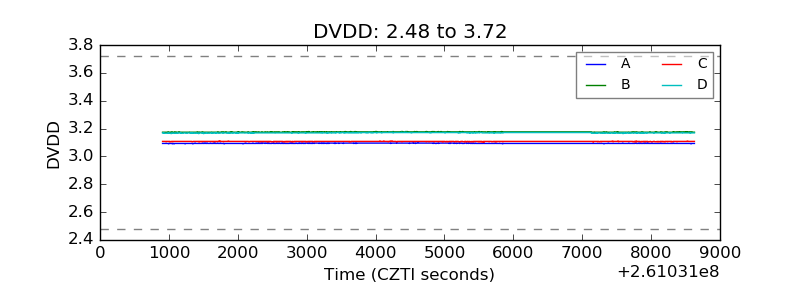 |
| Temperature 1 | 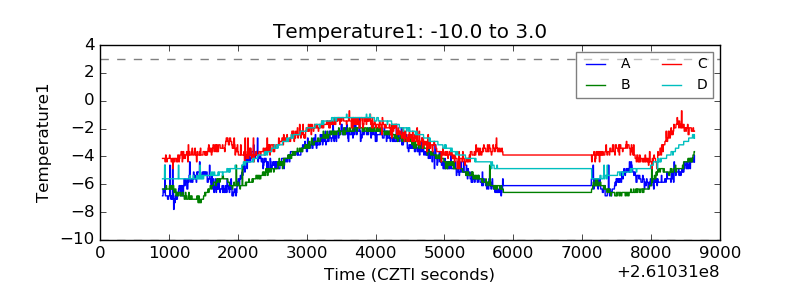 |
| Veto HV Monitor | 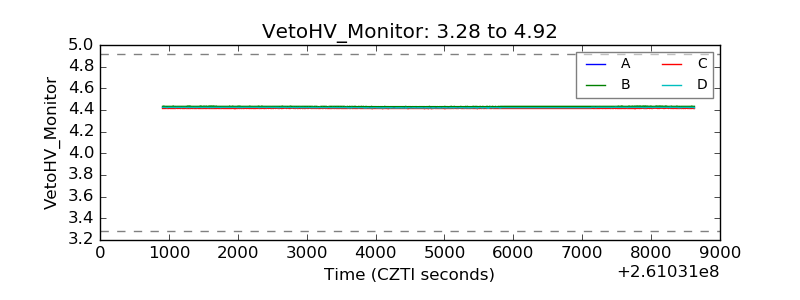 |
| Veto LLD | 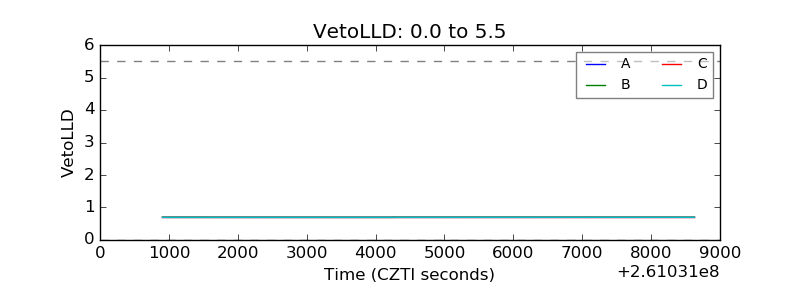 |
| Alpha Counter | 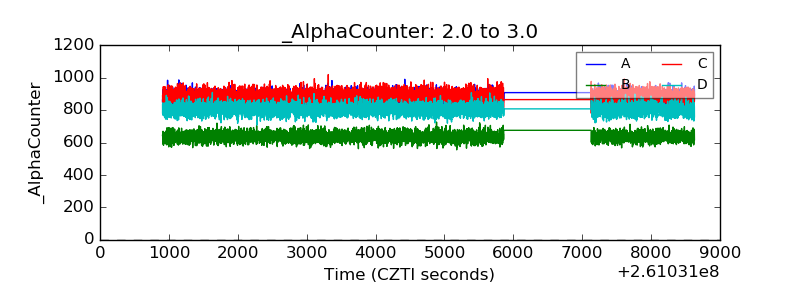 |
| _CPM_Rate | 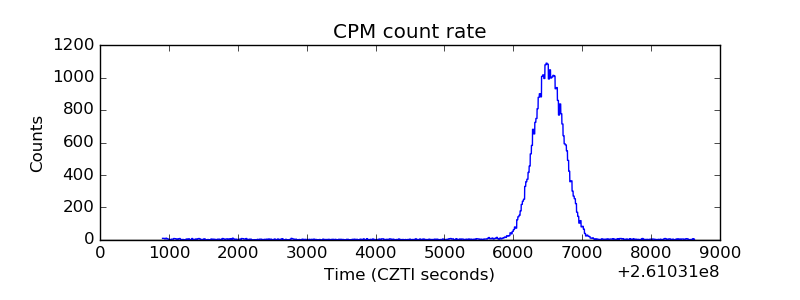 |
| CZT Counter | 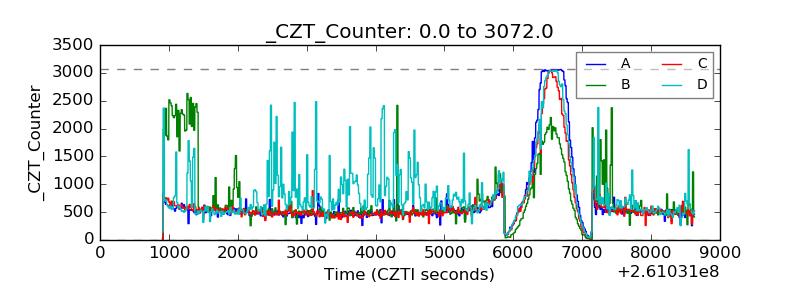 |
| +2.5 Volts monitor |  |
| +5 Volts monitor | 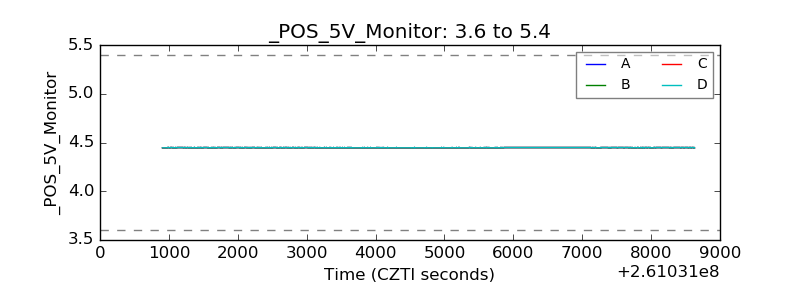 |
| _ROLL_ROT | 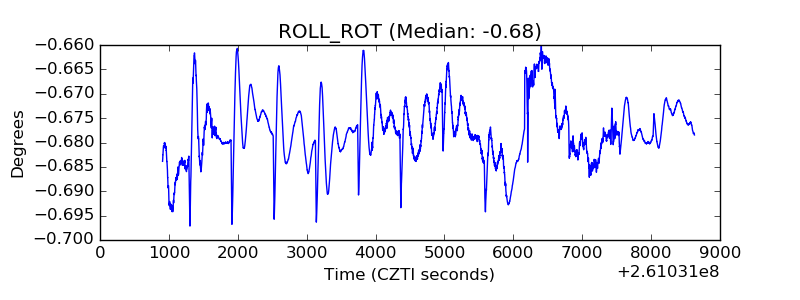 |
| _Roll_DEC | 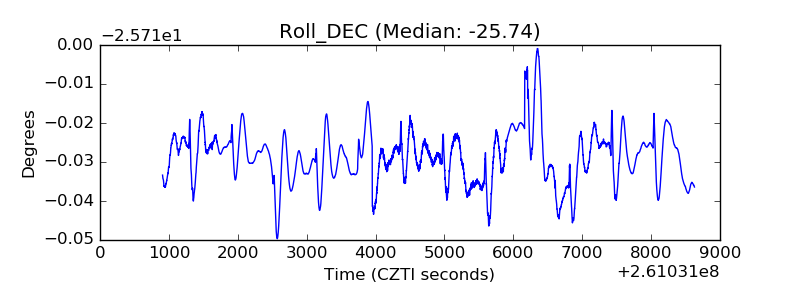 |
| _Roll_RA | 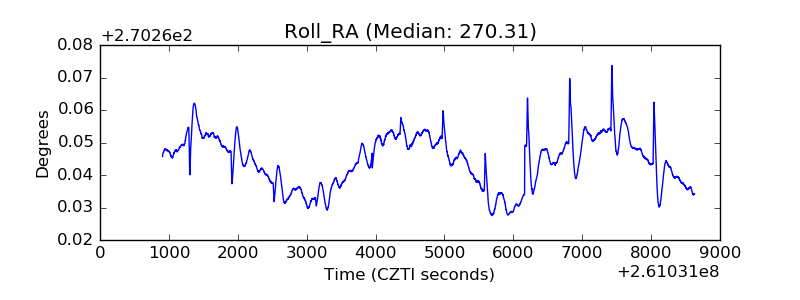 |
| Veto Counter | 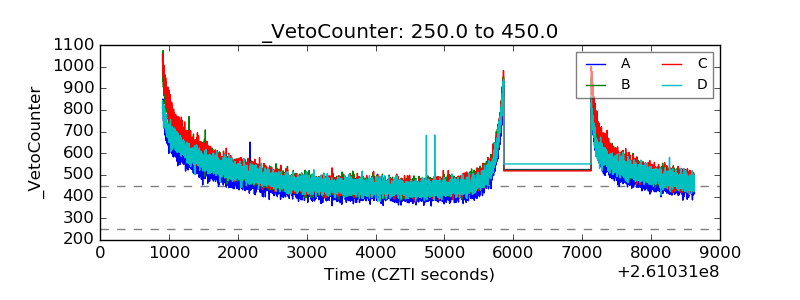 |