| Param | Original file | Final file |
|---|---|---|
| Filename | modeM0/AS1G08_070T01_9000002028_13694cztM0_level2.evt | modeM0/AS1G08_070T01_9000002028_13694cztM0_level2_quad_clean.evt |
| Size (bytes) | 447,569,280 | 82,488,960 |
| Size | 426.8 MB | 78.7 MB |
| Events in quadrant A | 2,988,479 | 533,312 |
| Events in quadrant B | 3,266,797 | 565,266 |
| Events in quadrant C | 3,071,050 | 511,538 |
| Events in quadrant D | 3,827,979 | 475,954 |
| Mode SS | |||
|---|---|---|---|
| Quadrant | BADHDUFLAG | Total packets | Discarded packets |
| A | 0 | 120 | 0 |
| B | 0 | 120 | 0 |
| C | 0 | 120 | 0 |
| D | 0 | 120 | 0 |
| Mode M9 | |||
|---|---|---|---|
| Quadrant | BADHDUFLAG | Total packets | Discarded packets |
| A | 0 | 11 | 0 |
| B | 0 | 11 | 0 |
| C | 0 | 11 | 0 |
| D | 0 | 11 | 0 |
| Mode M0 | |||
|---|---|---|---|
| Quadrant | BADHDUFLAG | Total packets | Discarded packets |
| A | 0 | 12336 | 2 |
| B | 0 | 13215 | 1 |
| C | 0 | 12568 | 1 |
| D | 0 | 14991 | 1 |
| Quadrant | Total seconds | Saturated seconds | Saturation percentage |
|---|---|---|---|
| A | 5893 | 116 | 1.968437% |
| B | 5893 | 142 | 2.409639% |
| C | 5893 | 75 | 1.272696% |
| D | 5893 | 216 | 3.665366% |
Noise dominated data is calculated using 1-second bins in cleaned event files. If a bin has >2000 counts, and if more than 50% of those come from <1% of pixels, then it is considered to be noise-dominated and hence unusable.
| Quadrant | # 1 sec bins | Bins with >0 counts | Bins with >2000 counts | High rate bins dominated by noise | Noise dominated (total time) | Noise dominated (detector-on time) | Marked lightcurve |
|---|---|---|---|---|---|---|---|
| A | 6999 | 5896 | 0 | 0 | 0.00% | 0.00% | 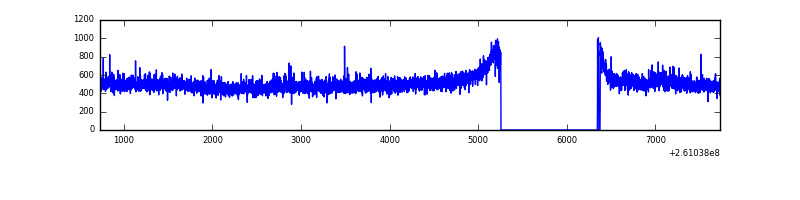 |
| B | 6999 | 5896 | 10 | 10 | 0.14% | 0.17% | 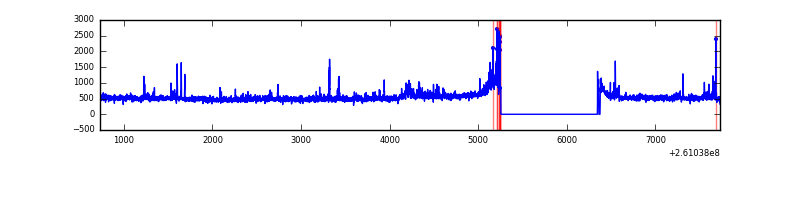 |
| C | 6999 | 5896 | 1 | 1 | 0.01% | 0.02% | 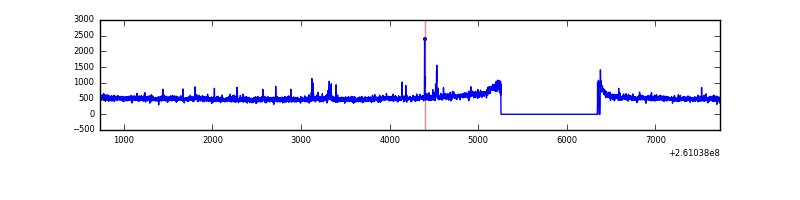 |
| D | 6999 | 5896 | 104 | 104 | 1.49% | 1.76% | 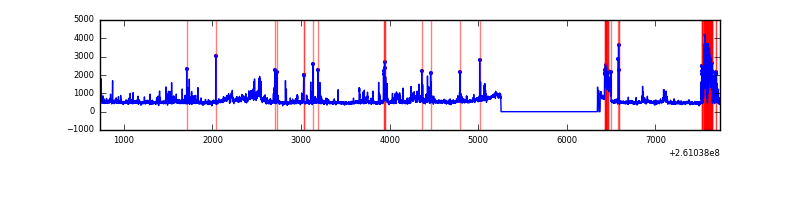 |
Top three noisy pixels from each quadrant. If the there are fewer than three noisy pixels in the level2.evt file, extra rows are filled as -1
| Pixel properties | Quadrant properties | ||||||
|---|---|---|---|---|---|---|---|
| Quadrant | DetID | PixID | Counts | Sigma | Mean | Median | Sigma |
| A | 1 | 162 | 17991 | 110.63 | 769 | 751 | 155.8 |
| A | 1 | 178 | 6926 | 39.63 | 769 | 751 | 155.8 |
| A | 0 | 226 | 6870 | 39.27 | 769 | 751 | 155.8 |
| B | 8 | 250 | 127546 | 880.29 | 766 | 753 | 144.0 |
| B | 0 | 219 | 92709 | 638.42 | 766 | 753 | 144.0 |
| B | 3 | 209 | 33297 | 225.94 | 766 | 753 | 144.0 |
| C | 3 | 233 | 171404 | 998.82 | 739 | 743 | 170.9 |
| C | 14 | 234 | 10524 | 57.24 | 739 | 743 | 170.9 |
| C | 12 | 4 | 6368 | 32.92 | 739 | 743 | 170.9 |
| D | 13 | 122 | 391788 | 2206.37 | 736 | 716 | 177.2 |
| D | 5 | 222 | 223733 | 1258.23 | 736 | 716 | 177.2 |
| D | 1 | 52 | 117721 | 660.13 | 736 | 716 | 177.2 |
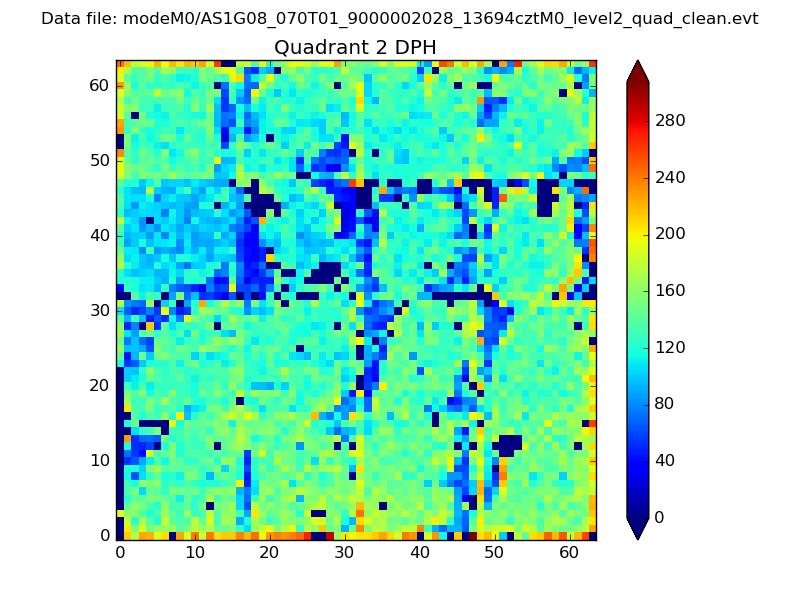
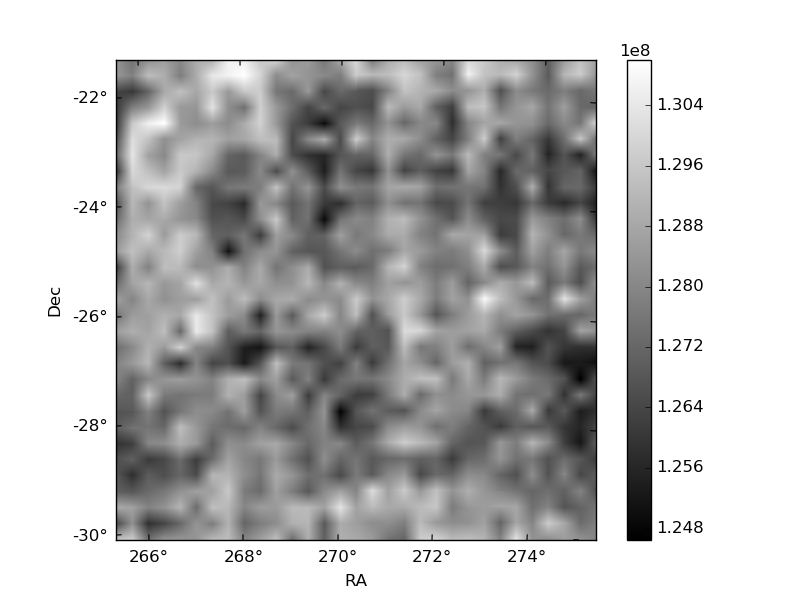
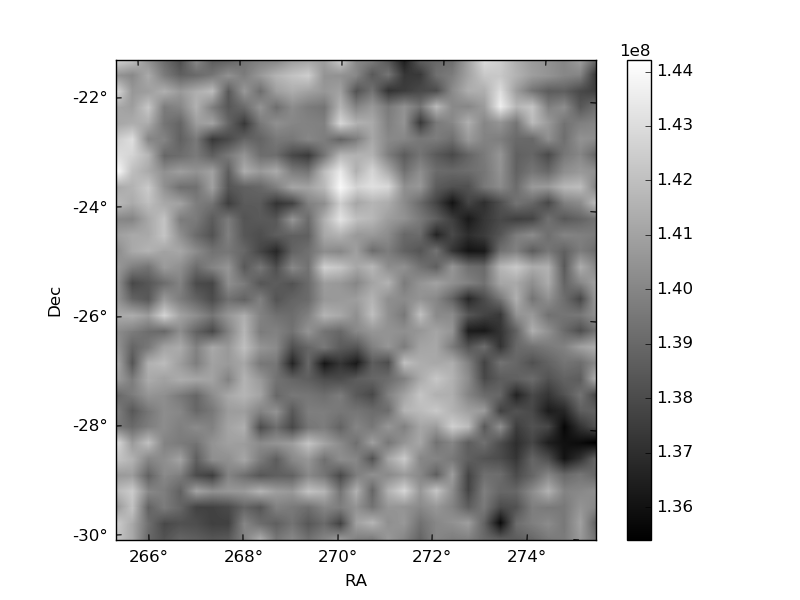
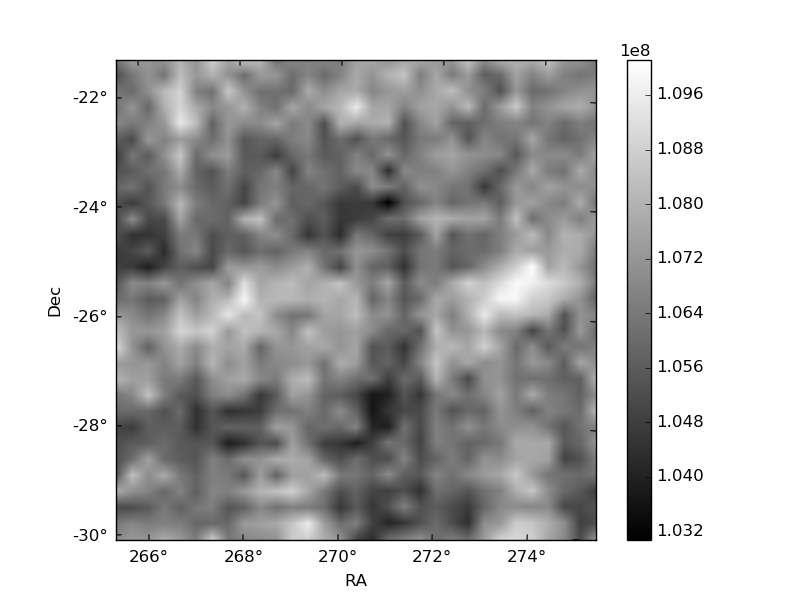
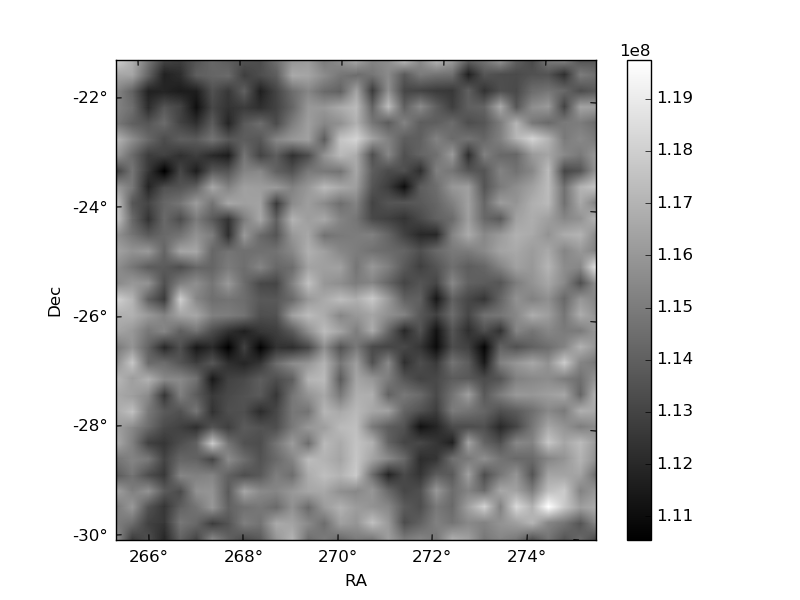
Histogram calculated using DETX and DETY for each event in the final _common_clean file
| Quadrant A | 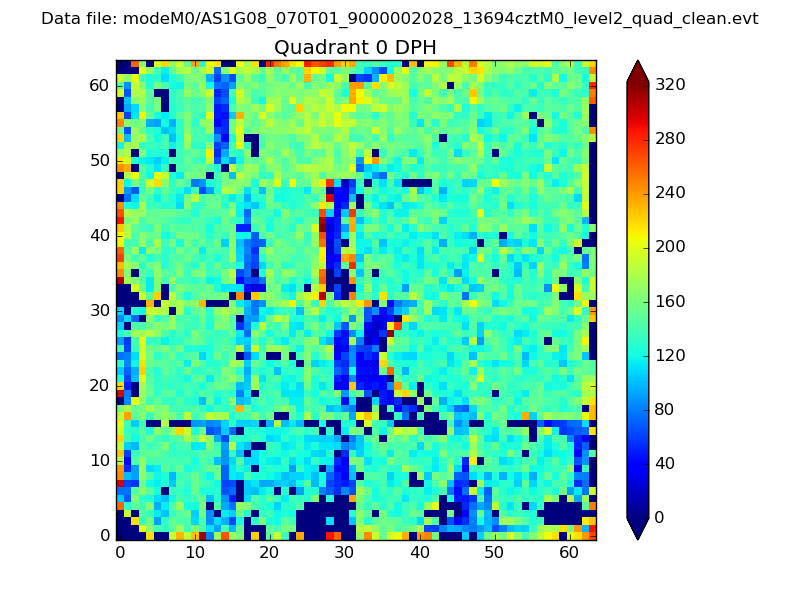 |
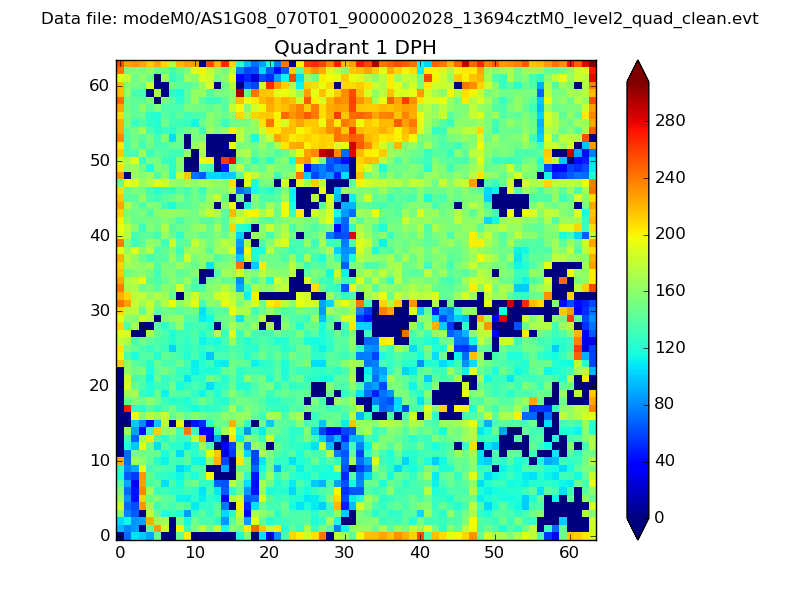 |
Quadrant B |
|---|---|---|---|
| Quadrant D | 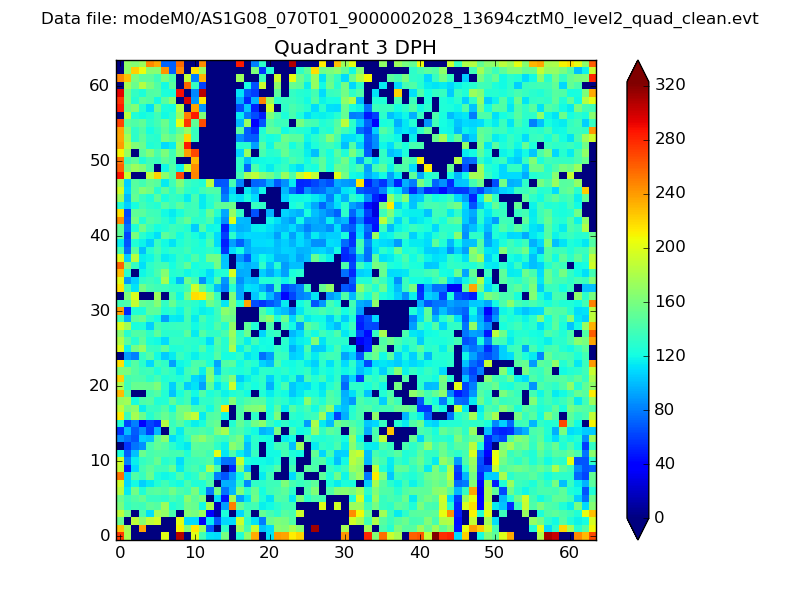 |
 |
Quadrant C |
| Plot type | Count rate plots | Images |
|---|---|---|
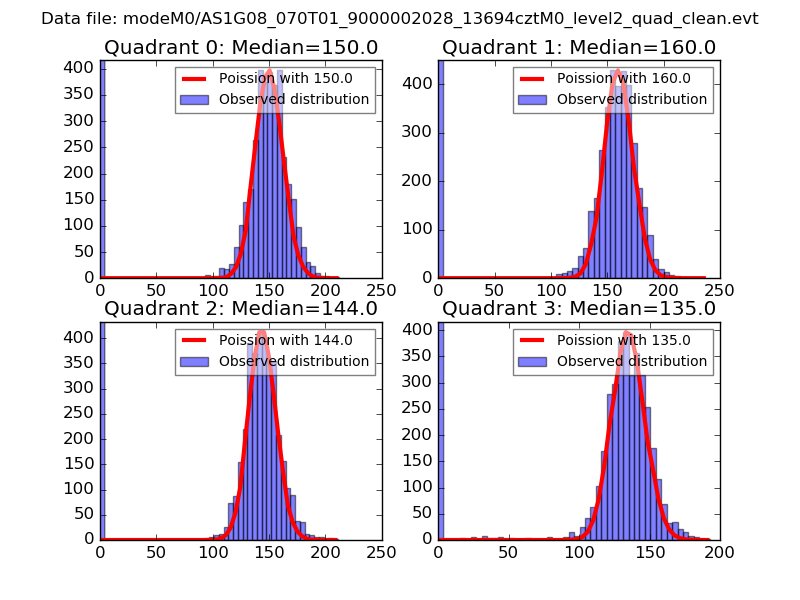
| Comparison with Poisson distribution Blue bars denote a histogram of data divided into 1 sec bins. Red curve is a Poisson curve with rate = median count rate of data. |
 |
 |
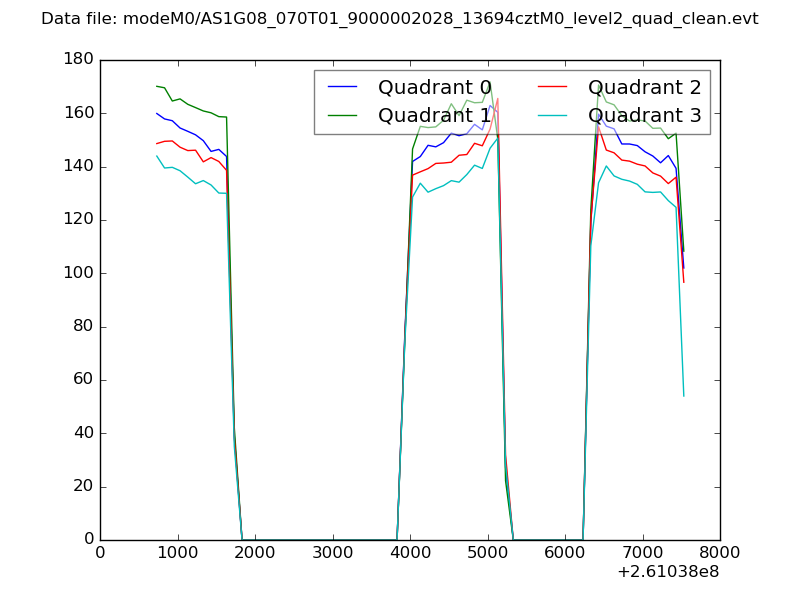
| Quadrant-wise count rates Data is divided into 100 sec bins |
 |
|
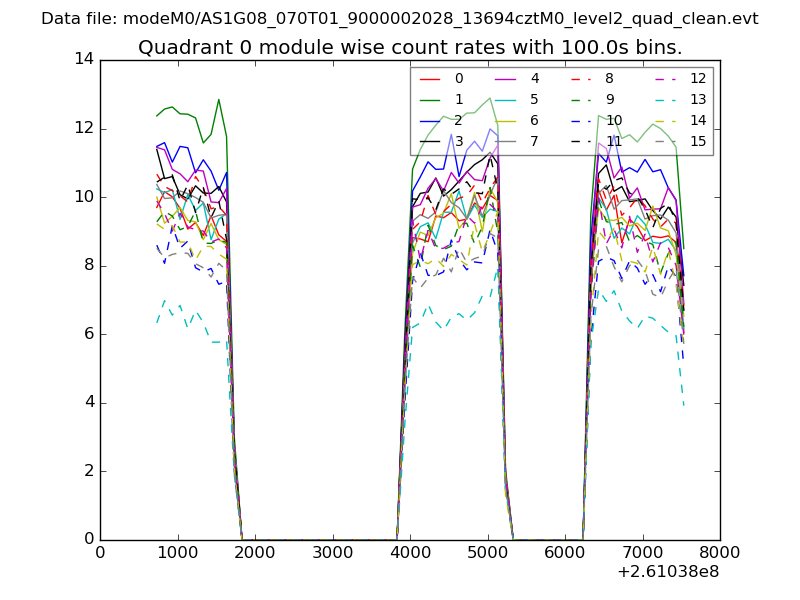
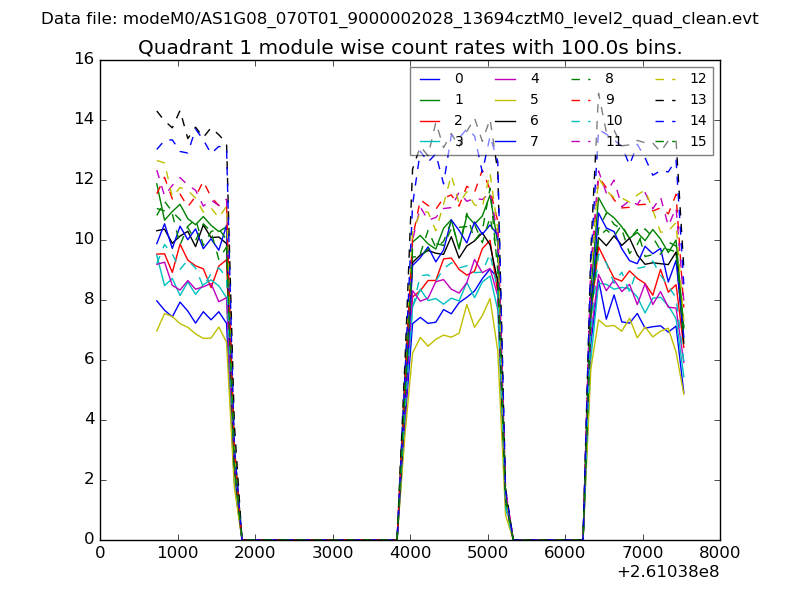
| Module-wise count rates for Quadrant A Data is divided into 100 sec bins |
 |
 |
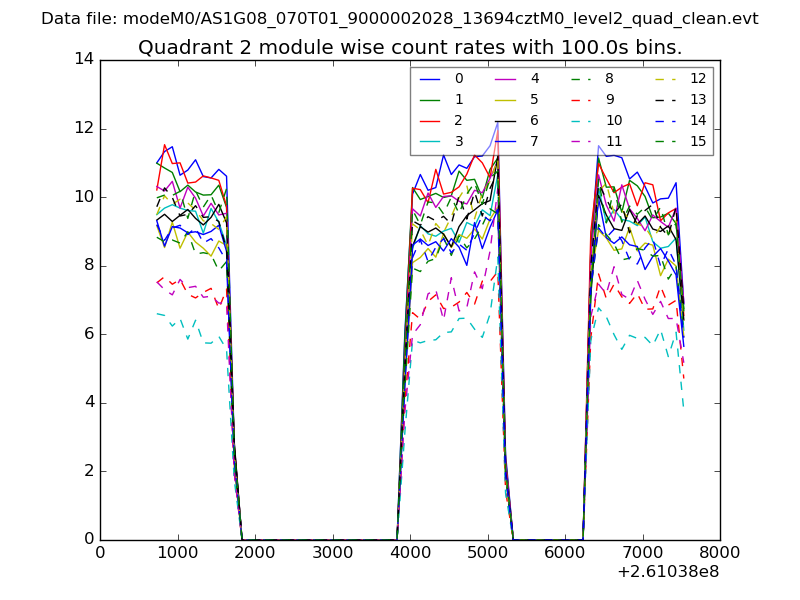
| Module-wise count rates for Quadrant B Data is divided into 100 sec bins |
 |
 |
| Module-wise count rates for Quadrant C Data is divided into 100 sec bins |
 |
 |
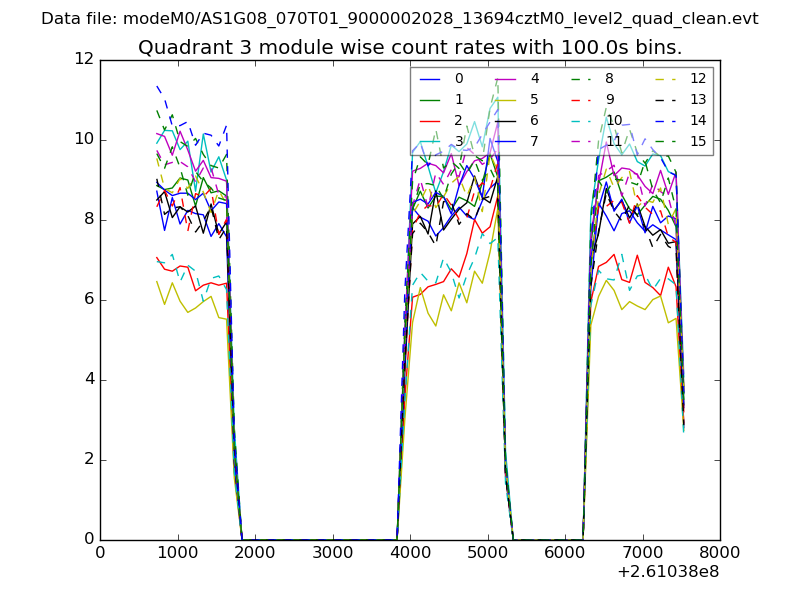
| Module-wise count rates for Quadrant D Data is divided into 100 sec bins |
 |
 |
| Parameter | Plot |
|---|---|
| CZT HV Monitor | 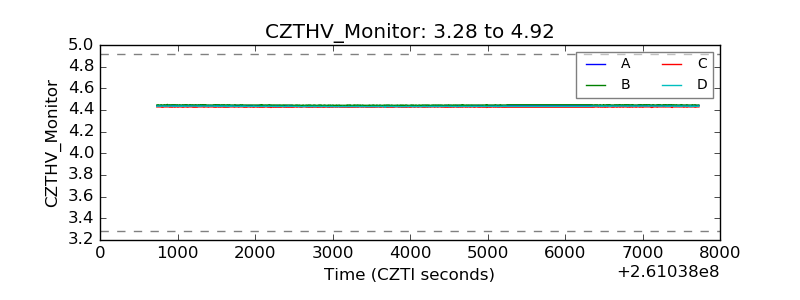 |
| D_VDD | 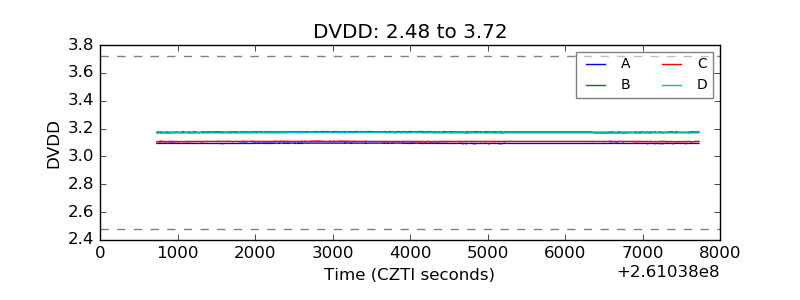 |
| Temperature 1 | 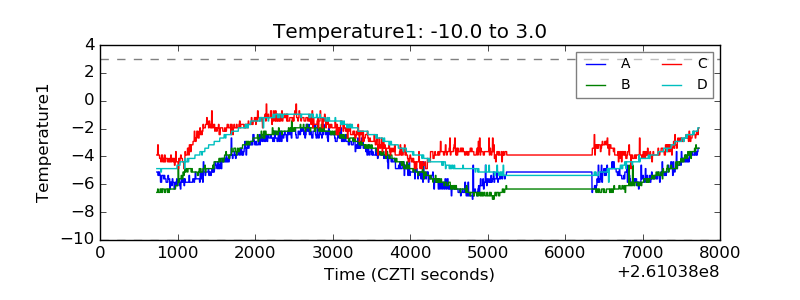 |
| Veto HV Monitor | 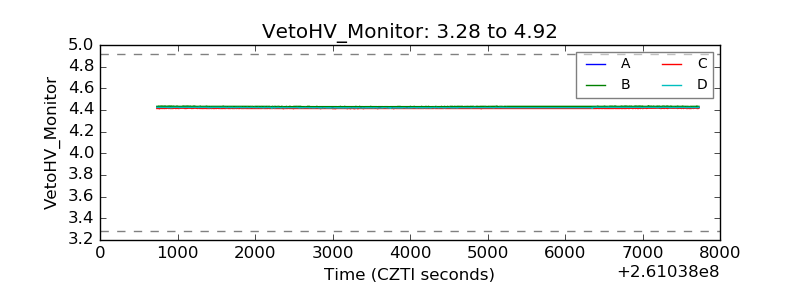 |
| Veto LLD | 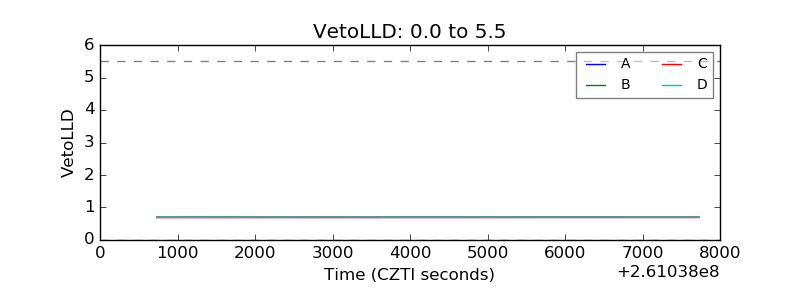 |
| Alpha Counter | 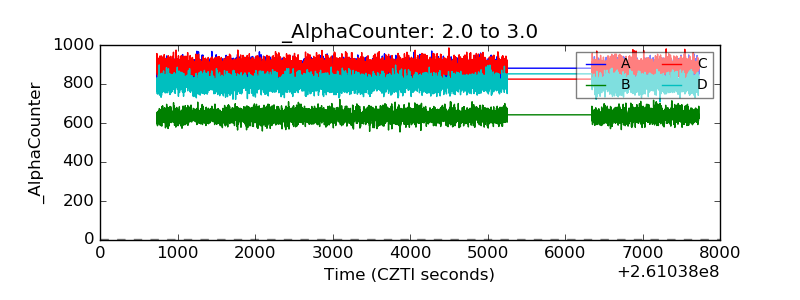 |
| _CPM_Rate | 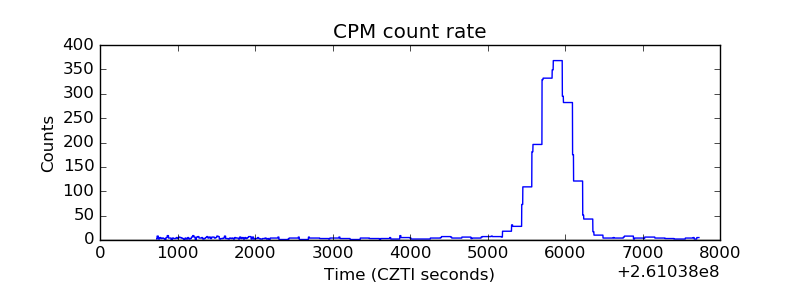 |
| CZT Counter | 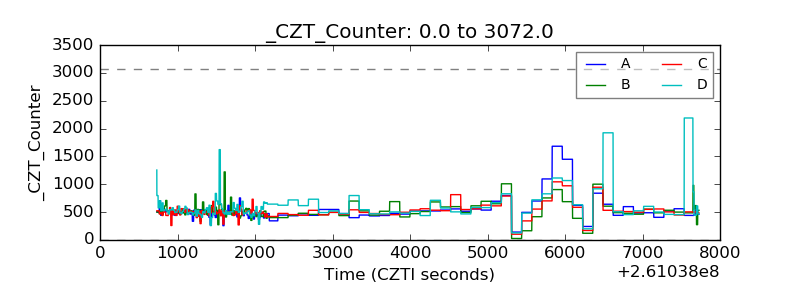 |
| +2.5 Volts monitor | 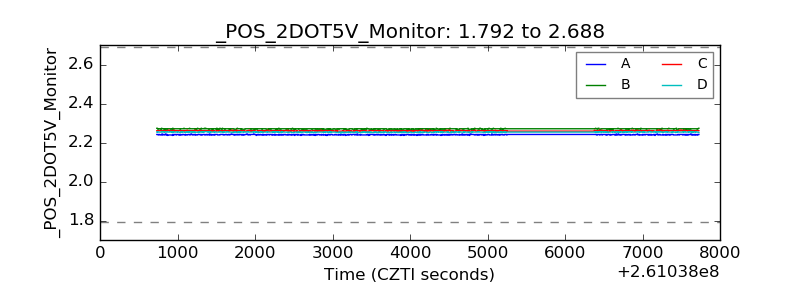 |
| +5 Volts monitor |  |
| _ROLL_ROT | 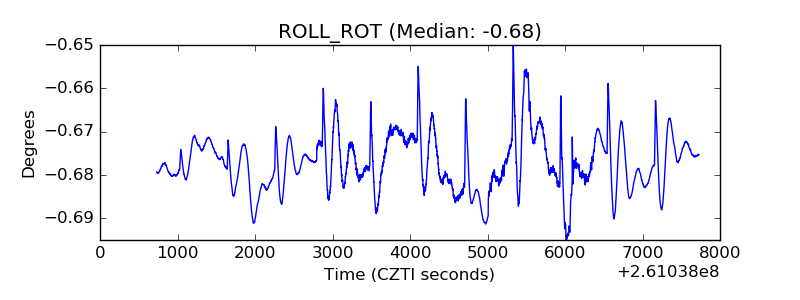 |
| _Roll_DEC | 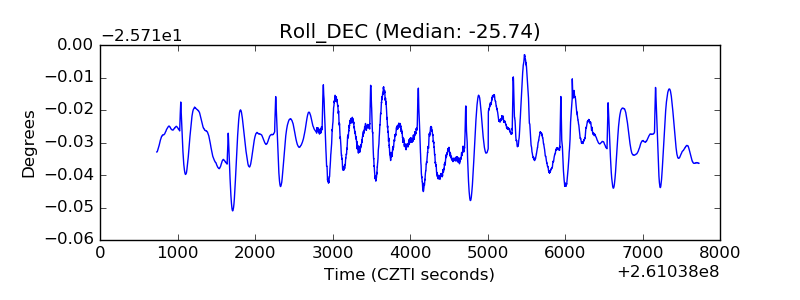 |
| _Roll_RA |  |
| Veto Counter | 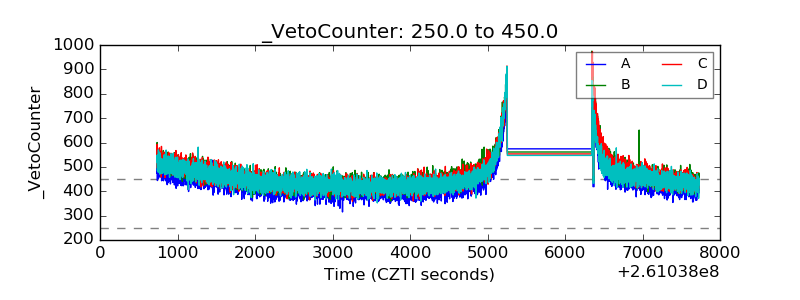 |