| Param | Original file | Final file |
|---|---|---|
| Filename | modeM0/AS1G08_070T01_9000002028_13695cztM0_level2.evt | modeM0/AS1G08_070T01_9000002028_13695cztM0_level2_quad_clean.evt |
| Size (bytes) | 501,612,480 | 83,119,680 |
| Size | 478.4 MB | 79.3 MB |
| Events in quadrant A | 3,226,356 | 523,339 |
| Events in quadrant B | 3,493,177 | 558,709 |
| Events in quadrant C | 3,214,334 | 503,201 |
| Events in quadrant D | 4,809,680 | 471,650 |
| Mode SS | |||
|---|---|---|---|
| Quadrant | BADHDUFLAG | Total packets | Discarded packets |
| A | 0 | 134 | 0 |
| B | 0 | 134 | 0 |
| C | 0 | 134 | 0 |
| D | 0 | 134 | 0 |
| Mode M9 | |||
|---|---|---|---|
| Quadrant | BADHDUFLAG | Total packets | Discarded packets |
| A | 0 | 8 | 0 |
| B | 0 | 8 | 0 |
| C | 0 | 8 | 0 |
| D | 0 | 8 | 0 |
| Mode M0 | |||
|---|---|---|---|
| Quadrant | BADHDUFLAG | Total packets | Discarded packets |
| A | 0 | 13632 | 2 |
| B | 0 | 14298 | 1 |
| C | 0 | 13535 | 1 |
| D | 0 | 18499 | 1 |
| Quadrant | Total seconds | Saturated seconds | Saturation percentage |
|---|---|---|---|
| A | 6597 | 129 | 1.955434% |
| B | 6597 | 170 | 2.576929% |
| C | 6597 | 109 | 1.652266% |
| D | 6597 | 464 | 7.033500% |
Noise dominated data is calculated using 1-second bins in cleaned event files. If a bin has >2000 counts, and if more than 50% of those come from <1% of pixels, then it is considered to be noise-dominated and hence unusable.
| Quadrant | # 1 sec bins | Bins with >0 counts | Bins with >2000 counts | High rate bins dominated by noise | Noise dominated (total time) | Noise dominated (detector-on time) | Marked lightcurve |
|---|---|---|---|---|---|---|---|
| A | 7368 | 6599 | 0 | 0 | 0.00% | 0.00% | 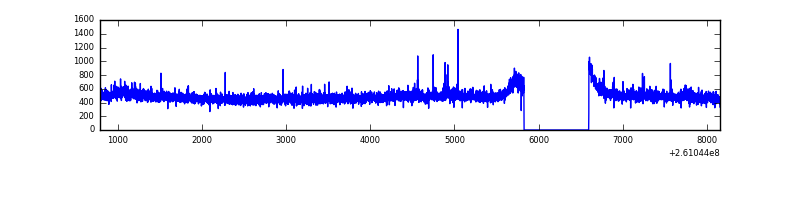 |
| B | 7368 | 6599 | 19 | 19 | 0.26% | 0.29% | 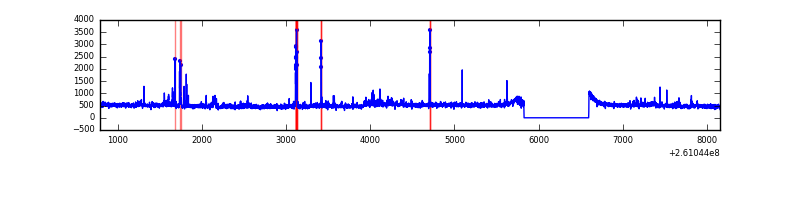 |
| C | 7368 | 6599 | 0 | 0 | 0.00% | 0.00% | 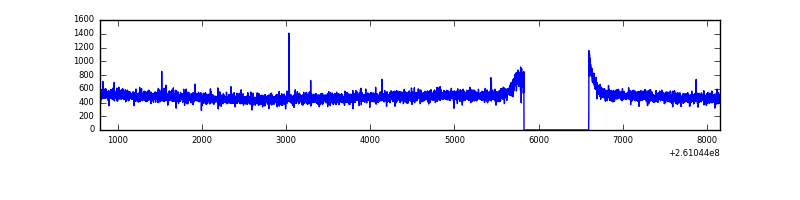 |
| D | 7368 | 6599 | 303 | 303 | 4.11% | 4.59% | 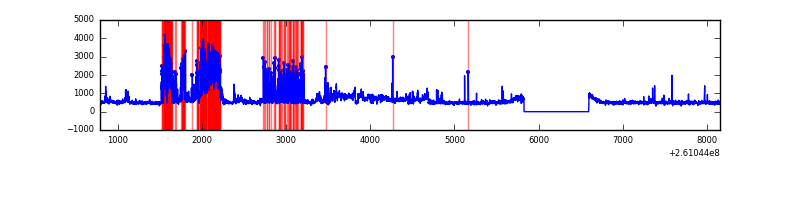 |
Top three noisy pixels from each quadrant. If the there are fewer than three noisy pixels in the level2.evt file, extra rows are filled as -1
| Pixel properties | Quadrant properties | ||||||
|---|---|---|---|---|---|---|---|
| Quadrant | DetID | PixID | Counts | Sigma | Mean | Median | Sigma |
| A | 1 | 162 | 29074 | 168.62 | 826 | 807 | 167.6 |
| A | 1 | 178 | 10957 | 60.55 | 826 | 807 | 167.6 |
| A | 1 | 161 | 9916 | 54.34 | 826 | 807 | 167.6 |
| B | 0 | 219 | 100075 | 631.0 | 828 | 810 | 157.3 |
| B | 4 | 142 | 51077 | 319.53 | 828 | 810 | 157.3 |
| B | 8 | 250 | 40775 | 254.05 | 828 | 810 | 157.3 |
| C | 3 | 233 | 105629 | 571.94 | 796 | 800 | 183.3 |
| C | 13 | 61 | 5850 | 27.55 | 796 | 800 | 183.3 |
| C | 14 | 234 | 5482 | 25.54 | 796 | 800 | 183.3 |
| D | 13 | 122 | 1496546 | 7958.21 | 776 | 754 | 188.0 |
| D | 8 | 195 | 145811 | 771.76 | 776 | 754 | 188.0 |
| D | 5 | 222 | 96509 | 509.45 | 776 | 754 | 188.0 |
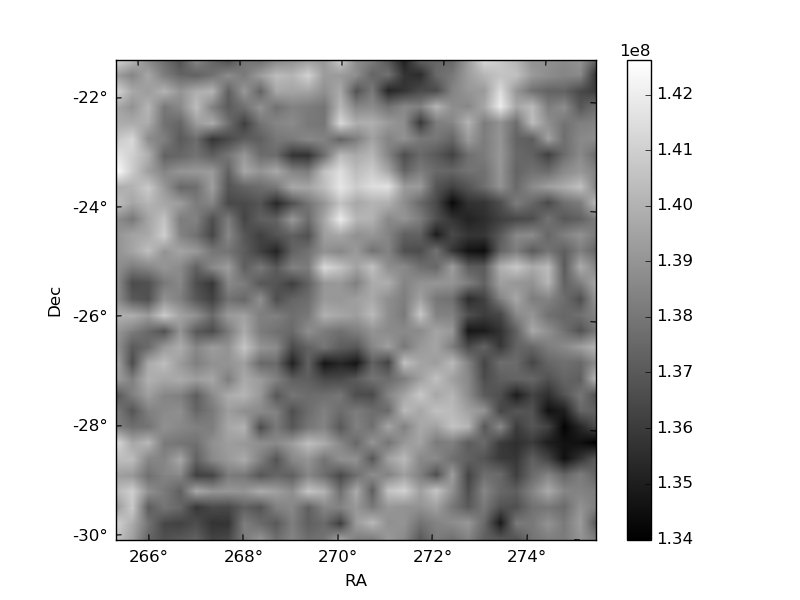
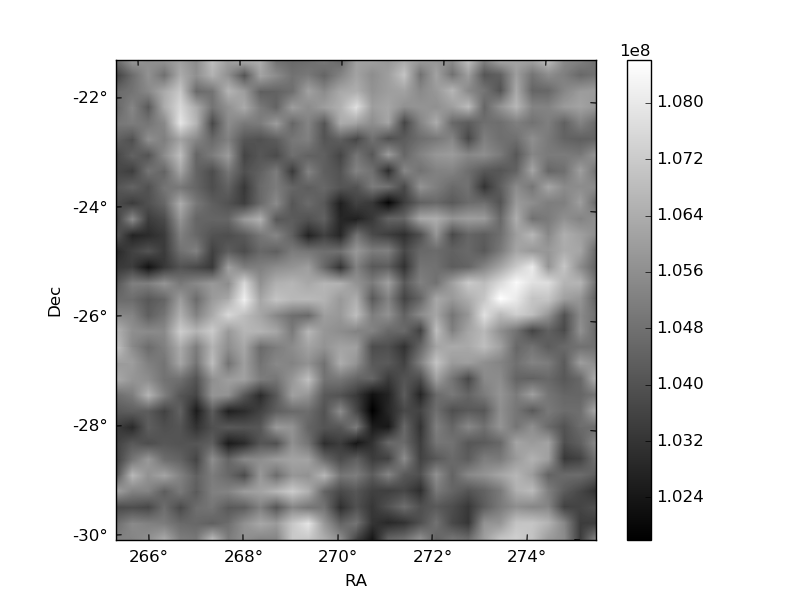
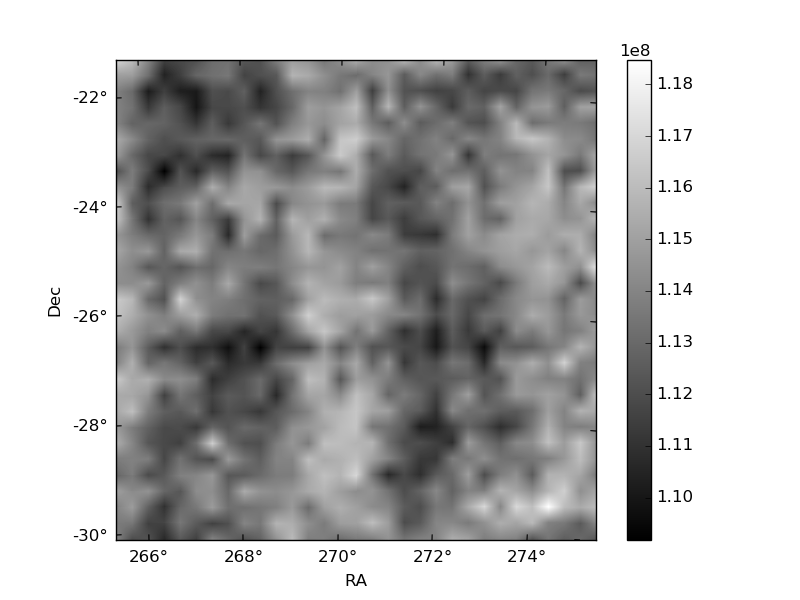
Histogram calculated using DETX and DETY for each event in the final _common_clean file
| Quadrant A | 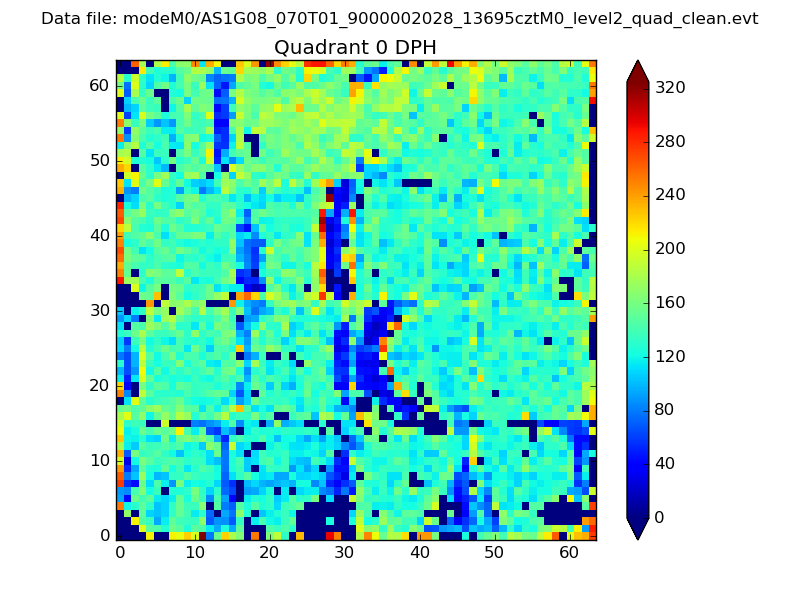 |
 |
Quadrant B |
|---|---|---|---|
| Quadrant D |  |
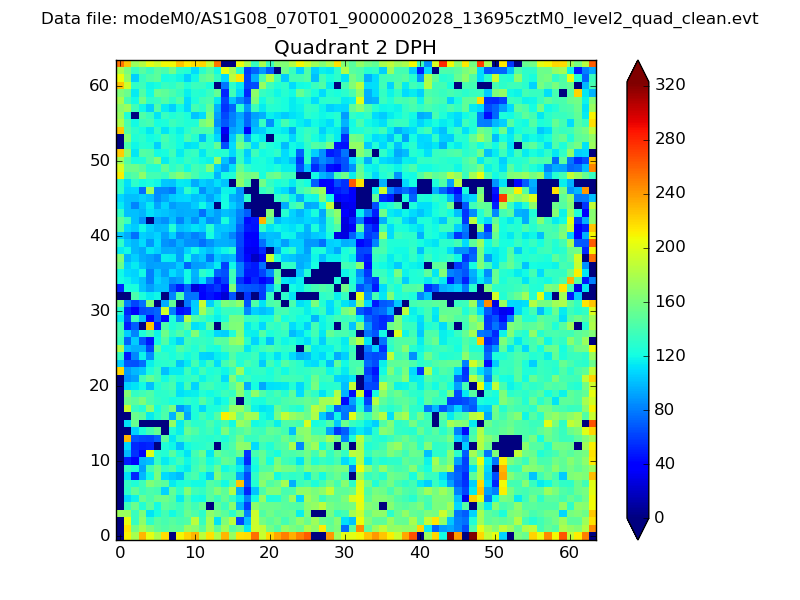 |
Quadrant C |
| Plot type | Count rate plots | Images |
|---|---|---|
| Comparison with Poisson distribution Blue bars denote a histogram of data divided into 1 sec bins. Red curve is a Poisson curve with rate = median count rate of data. |
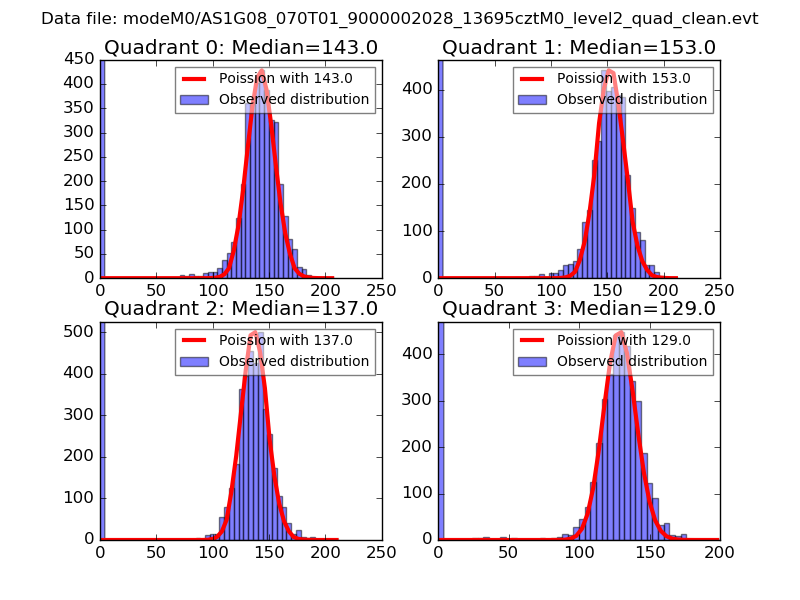 |
 |
| Quadrant-wise count rates Data is divided into 100 sec bins |
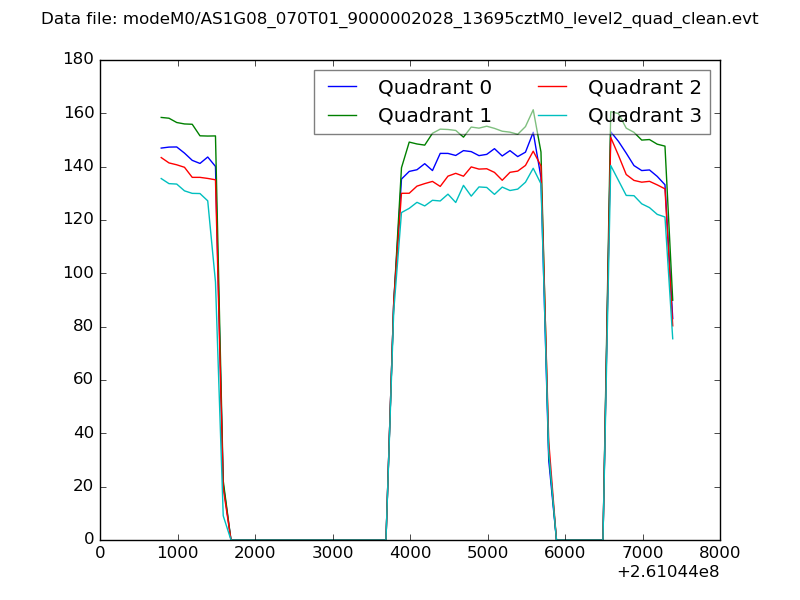 |
|
| Module-wise count rates for Quadrant A Data is divided into 100 sec bins |
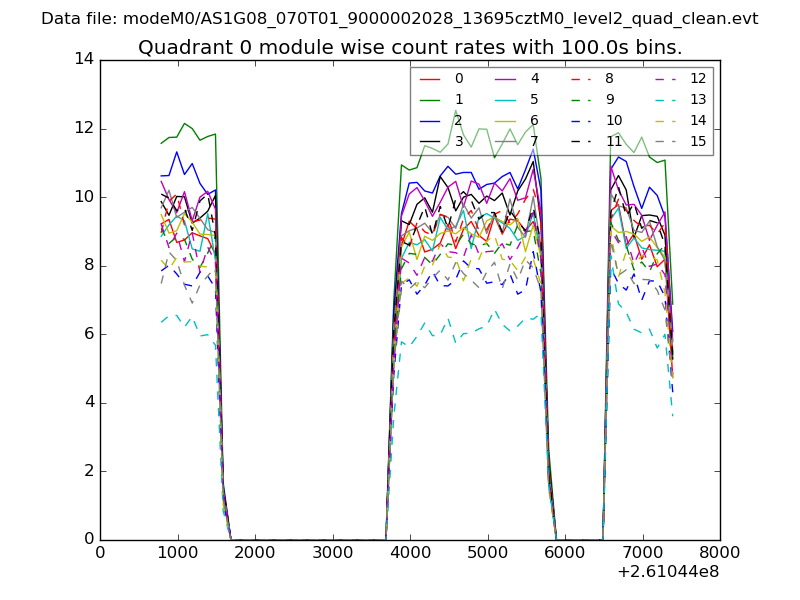 |
 |
| Module-wise count rates for Quadrant B Data is divided into 100 sec bins |
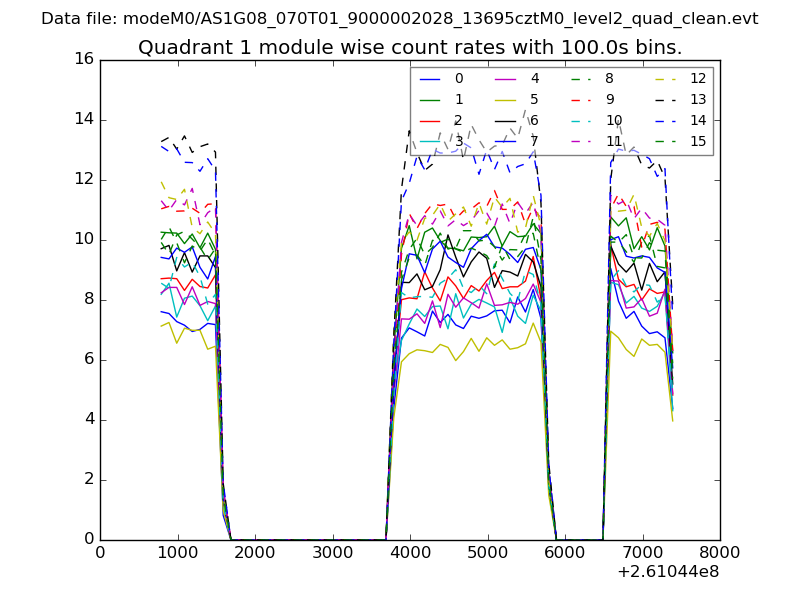 |
 |
| Module-wise count rates for Quadrant C Data is divided into 100 sec bins |
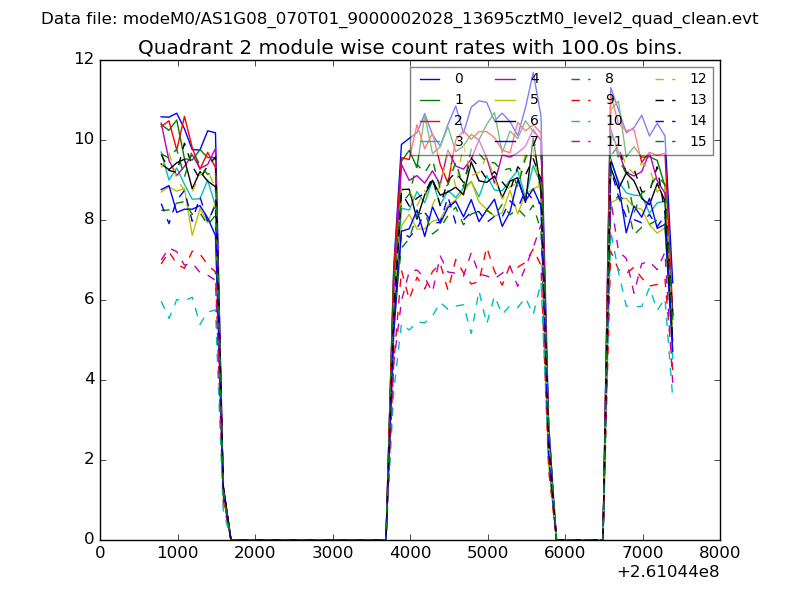 |
 |
| Module-wise count rates for Quadrant D Data is divided into 100 sec bins |
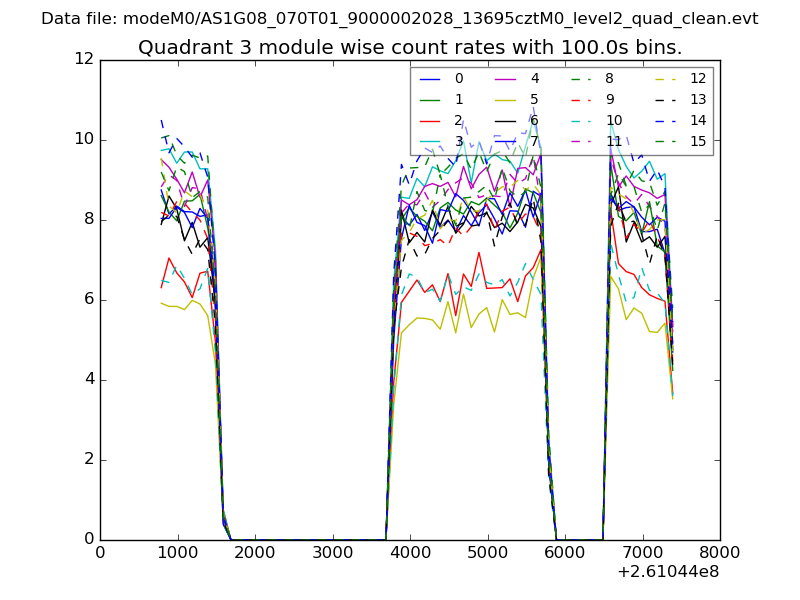 |
 |
| Parameter | Plot |
|---|---|
| CZT HV Monitor | 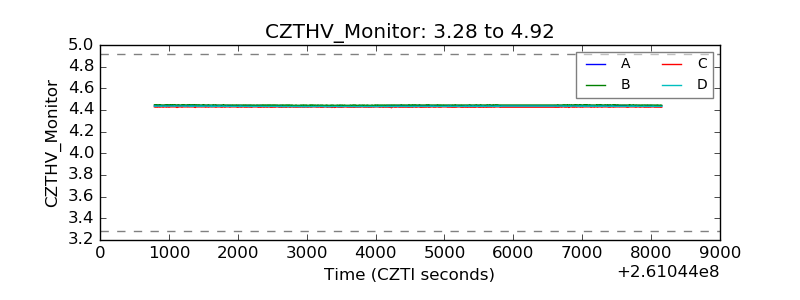 |
| D_VDD | 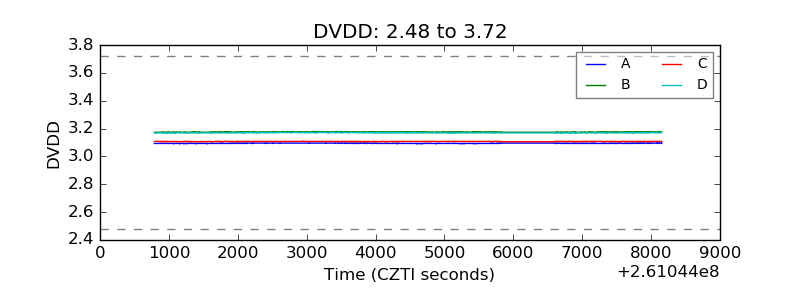 |
| Temperature 1 | 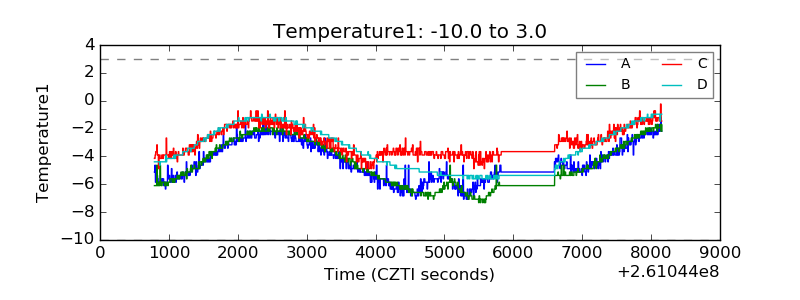 |
| Veto HV Monitor | 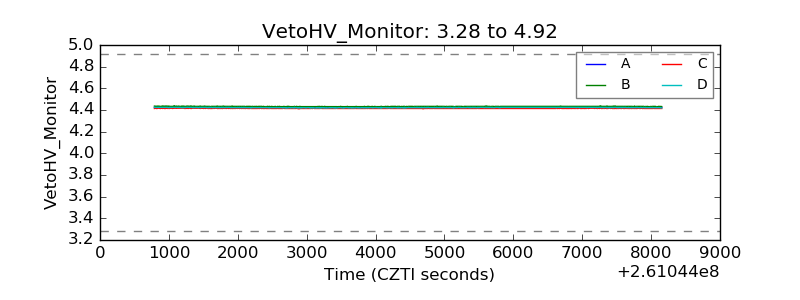 |
| Veto LLD | 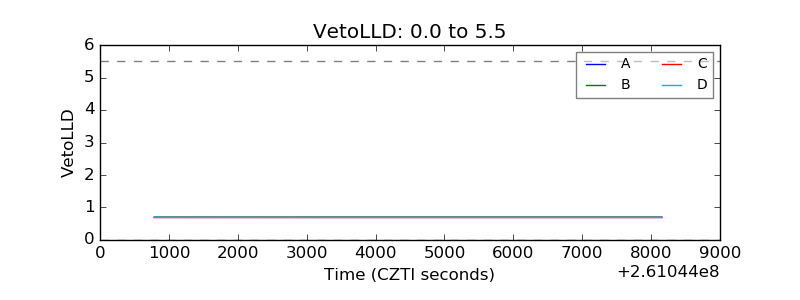 |
| Alpha Counter | 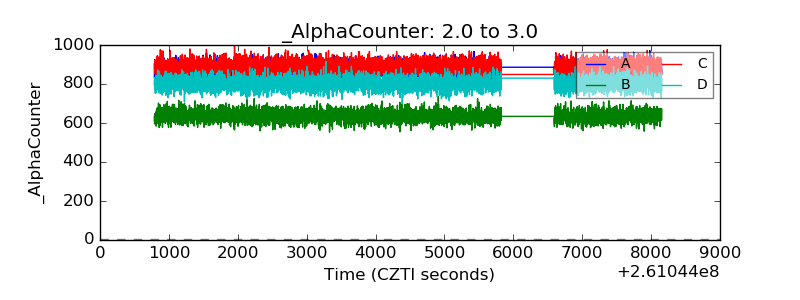 |
| _CPM_Rate | 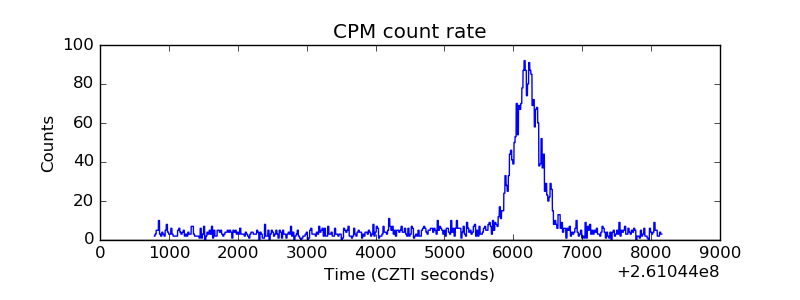 |
| CZT Counter | 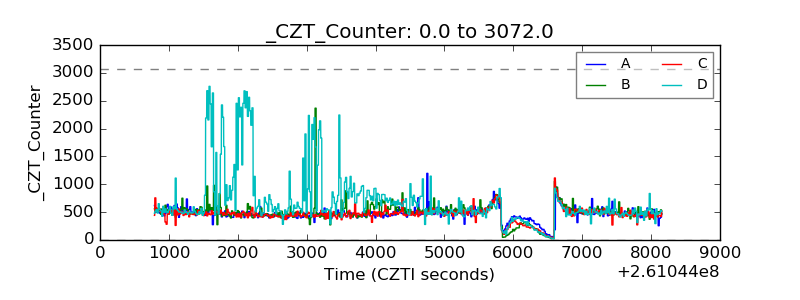 |
| +2.5 Volts monitor |  |
| +5 Volts monitor | 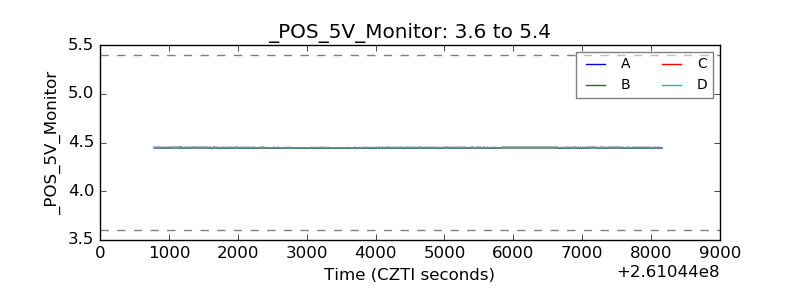 |
| _ROLL_ROT | 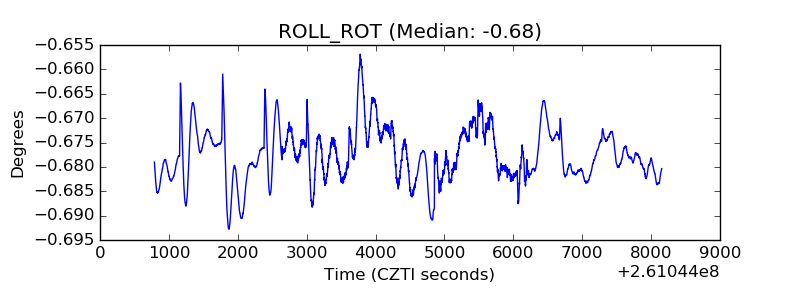 |
| _Roll_DEC | 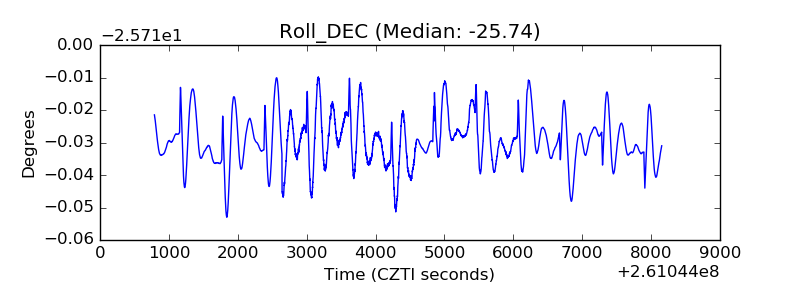 |
| _Roll_RA | 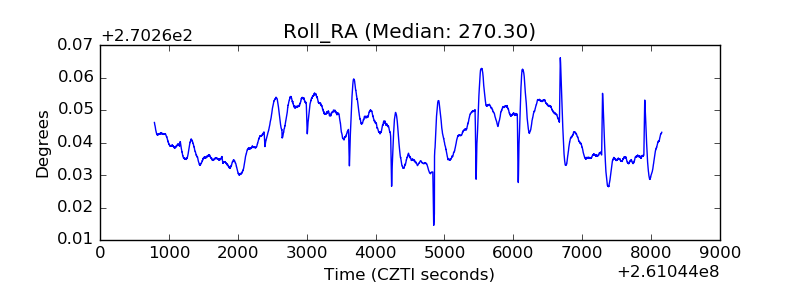 |
| Veto Counter | 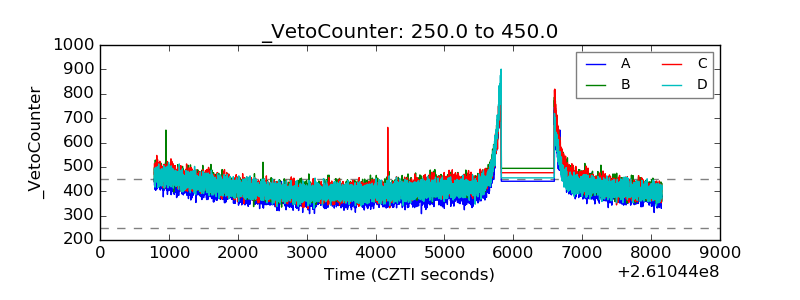 |