| Param | Original file | Final file |
|---|---|---|
| Filename | modeM0/AS1G08_070T01_9000002028_13696cztM0_level2.evt | modeM0/AS1G08_070T01_9000002028_13696cztM0_level2_quad_clean.evt |
| Size (bytes) | 522,959,040 | 86,140,800 |
| Size | 498.7 MB | 82.2 MB |
| Events in quadrant A | 3,582,748 | 532,203 |
| Events in quadrant B | 3,739,246 | 567,990 |
| Events in quadrant C | 3,551,832 | 514,870 |
| Events in quadrant D | 4,465,203 | 481,869 |
| Mode SS | |||
|---|---|---|---|
| Quadrant | BADHDUFLAG | Total packets | Discarded packets |
| A | 0 | 148 | 0 |
| B | 0 | 148 | 0 |
| C | 0 | 148 | 0 |
| D | 0 | 148 | 0 |
| Mode M9 | |||
|---|---|---|---|
| Quadrant | BADHDUFLAG | Total packets | Discarded packets |
| A | 0 | 3 | 0 |
| B | 0 | 3 | 0 |
| C | 0 | 3 | 0 |
| D | 0 | 3 | 0 |
| Mode M0 | |||
|---|---|---|---|
| Quadrant | BADHDUFLAG | Total packets | Discarded packets |
| A | 0 | 15301 | 2 |
| B | 0 | 15521 | 1 |
| C | 0 | 15248 | 1 |
| D | 0 | 17849 | 1 |
| Quadrant | Total seconds | Saturated seconds | Saturation percentage |
|---|---|---|---|
| A | 7347 | 166 | 2.259426% |
| B | 7347 | 185 | 2.518035% |
| C | 7347 | 121 | 1.646931% |
| D | 7347 | 237 | 3.225806% |
Noise dominated data is calculated using 1-second bins in cleaned event files. If a bin has >2000 counts, and if more than 50% of those come from <1% of pixels, then it is considered to be noise-dominated and hence unusable.
| Quadrant | # 1 sec bins | Bins with >0 counts | Bins with >2000 counts | High rate bins dominated by noise | Noise dominated (total time) | Noise dominated (detector-on time) | Marked lightcurve |
|---|---|---|---|---|---|---|---|
| A | 7663 | 7349 | 0 | 0 | 0.00% | 0.00% | 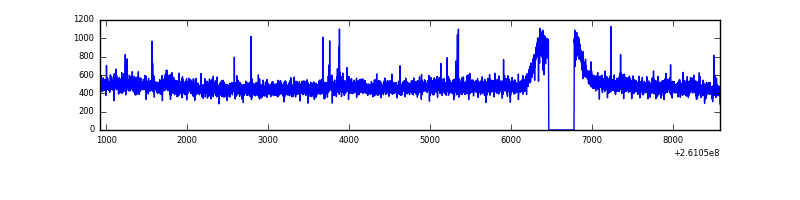 |
| B | 7663 | 7349 | 3 | 3 | 0.04% | 0.04% | 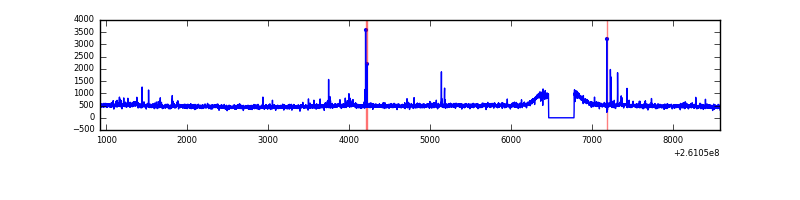 |
| C | 7663 | 7349 | 0 | 0 | 0.00% | 0.00% | 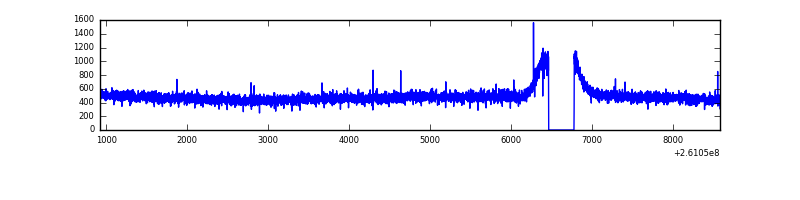 |
| D | 7663 | 7349 | 93 | 93 | 1.21% | 1.27% | 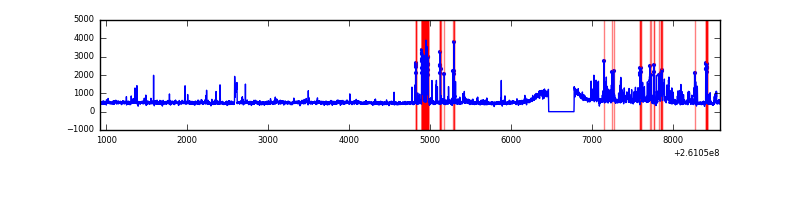 |
Top three noisy pixels from each quadrant. If the there are fewer than three noisy pixels in the level2.evt file, extra rows are filled as -1
| Pixel properties | Quadrant properties | ||||||
|---|---|---|---|---|---|---|---|
| Quadrant | DetID | PixID | Counts | Sigma | Mean | Median | Sigma |
| A | 1 | 162 | 19427 | 99.36 | 917 | 897 | 186.5 |
| A | 15 | 69 | 9739 | 47.41 | 917 | 897 | 186.5 |
| A | 0 | 226 | 8409 | 40.28 | 917 | 897 | 186.5 |
| B | 0 | 219 | 58880 | 329.9 | 923 | 904 | 175.7 |
| B | 4 | 80 | 30144 | 166.38 | 923 | 904 | 175.7 |
| B | 12 | 111 | 20413 | 111.01 | 923 | 904 | 175.7 |
| C | 3 | 233 | 92043 | 443.81 | 887 | 892 | 205.4 |
| C | 13 | 61 | 6495 | 27.28 | 887 | 892 | 205.4 |
| C | 14 | 234 | 3853 | 14.42 | 887 | 892 | 205.4 |
| D | 1 | 52 | 747737 | 3486.58 | 882 | 857 | 214.2 |
| D | 8 | 195 | 171929 | 798.6 | 882 | 857 | 214.2 |
| D | 13 | 122 | 81132 | 374.74 | 882 | 857 | 214.2 |
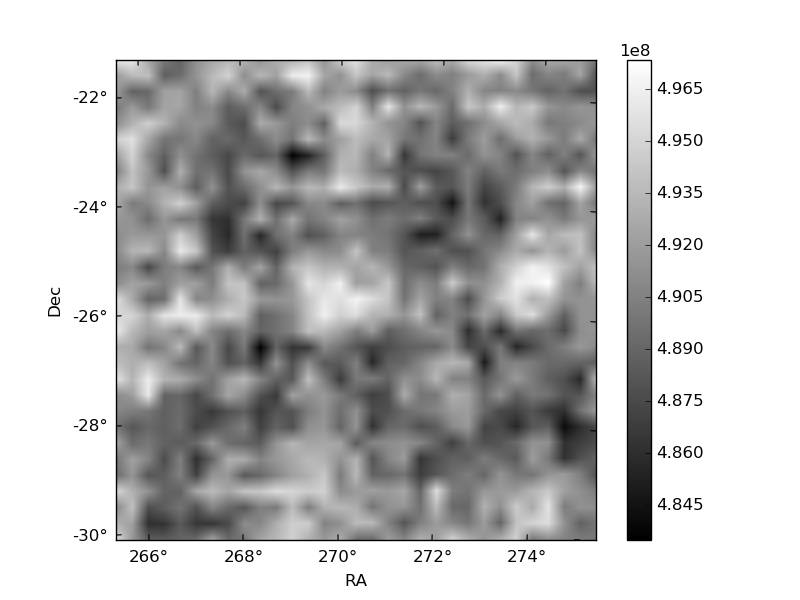
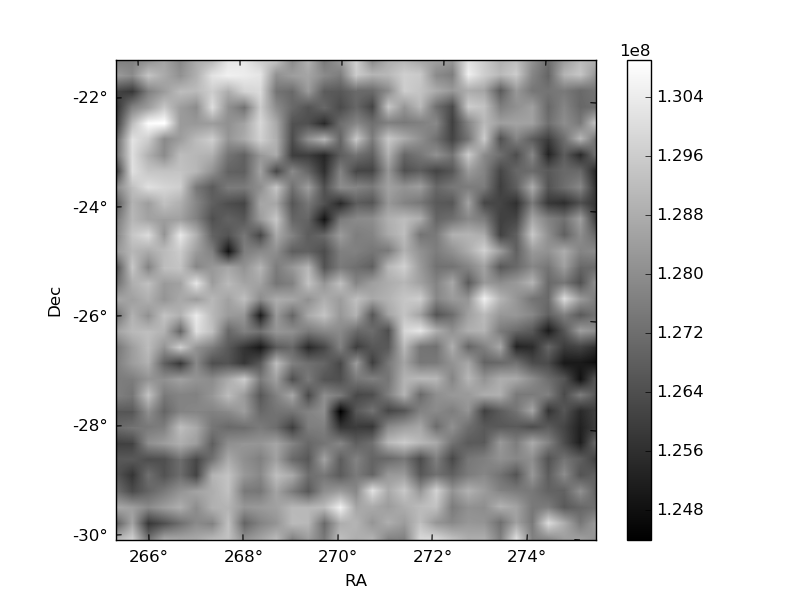
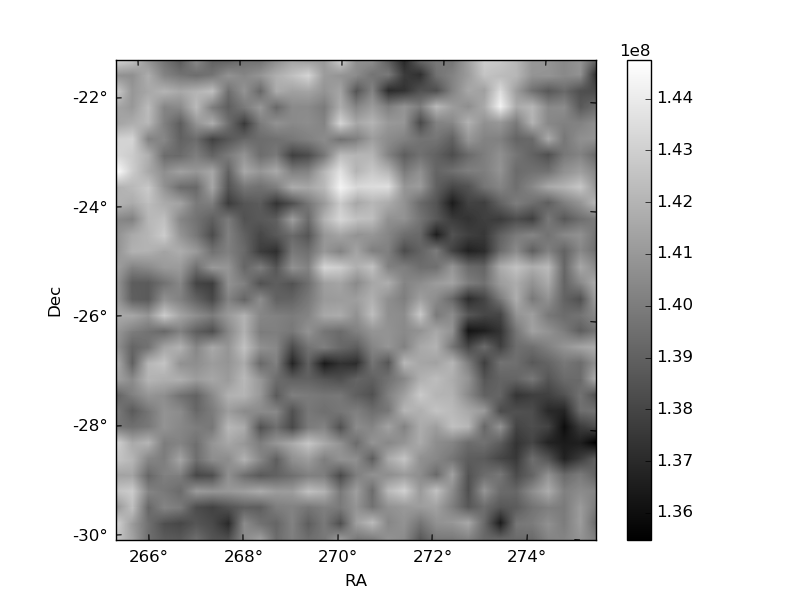
Histogram calculated using DETX and DETY for each event in the final _common_clean file
| Quadrant A | 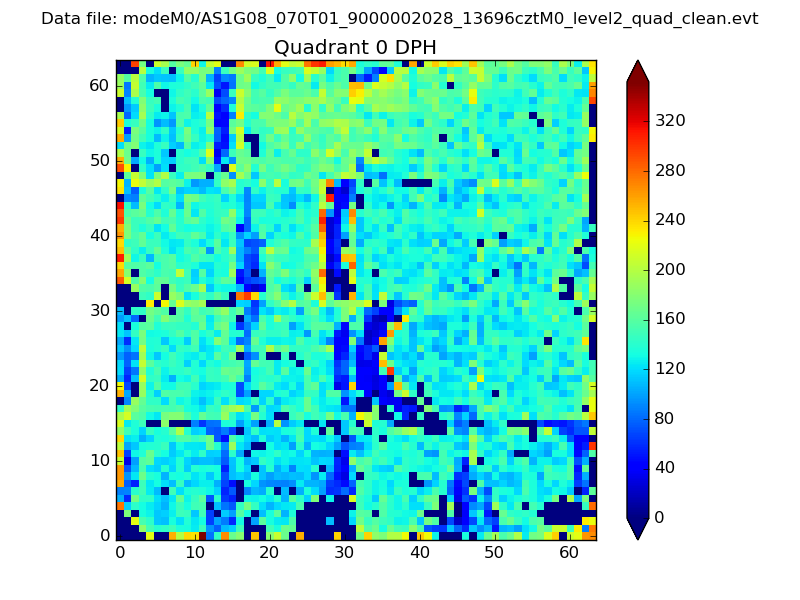 |
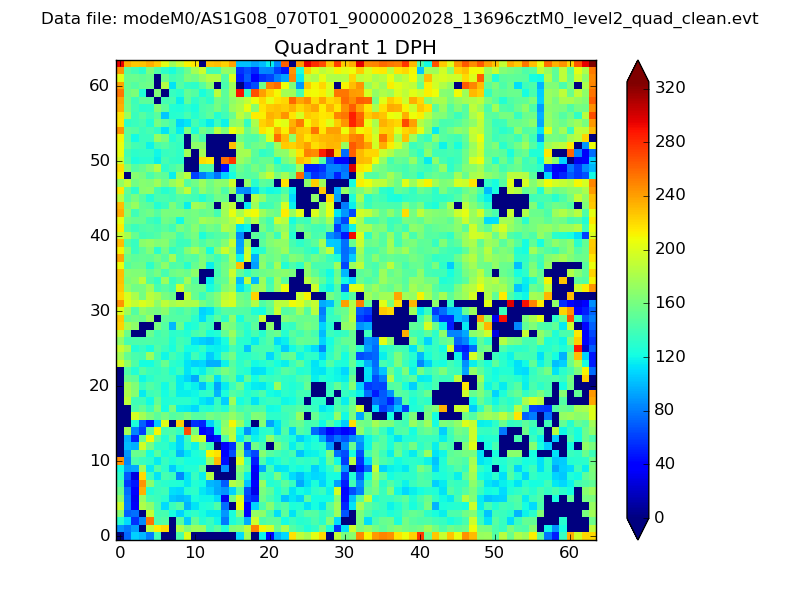 |
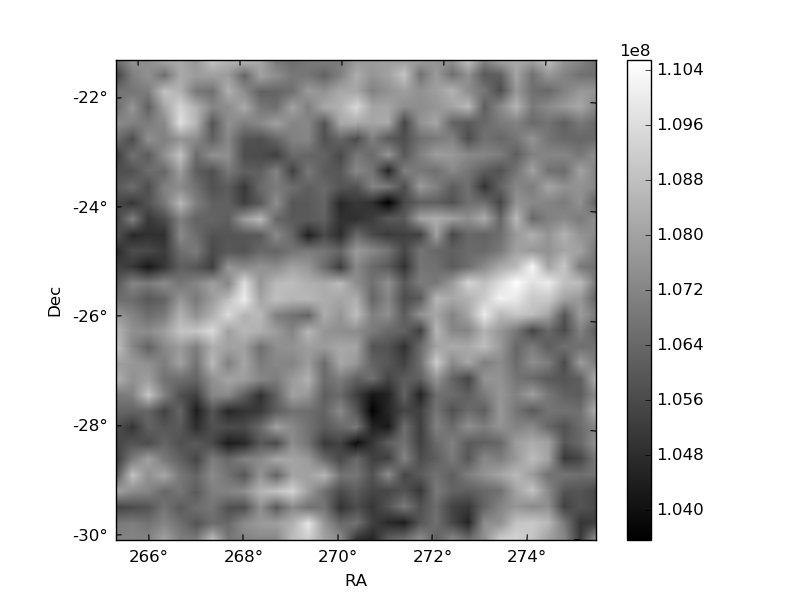
Quadrant B |
|---|---|---|---|
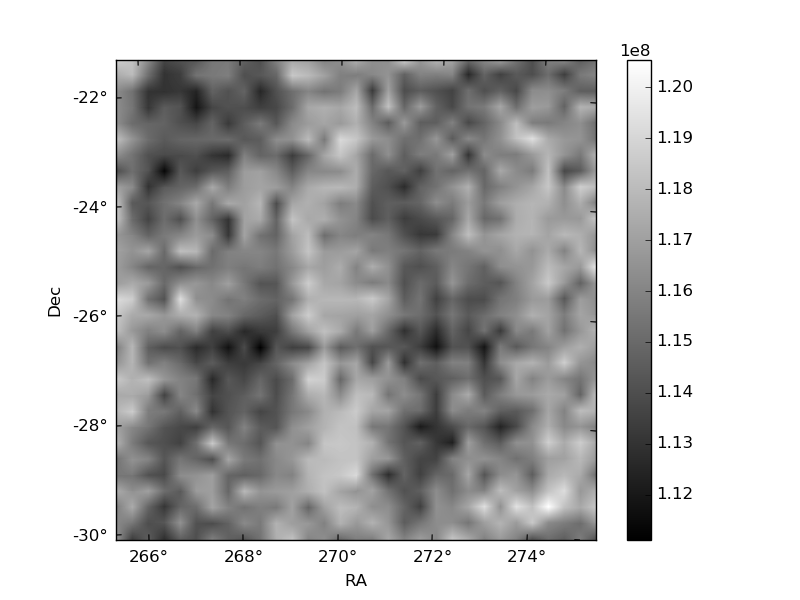
| Quadrant D | 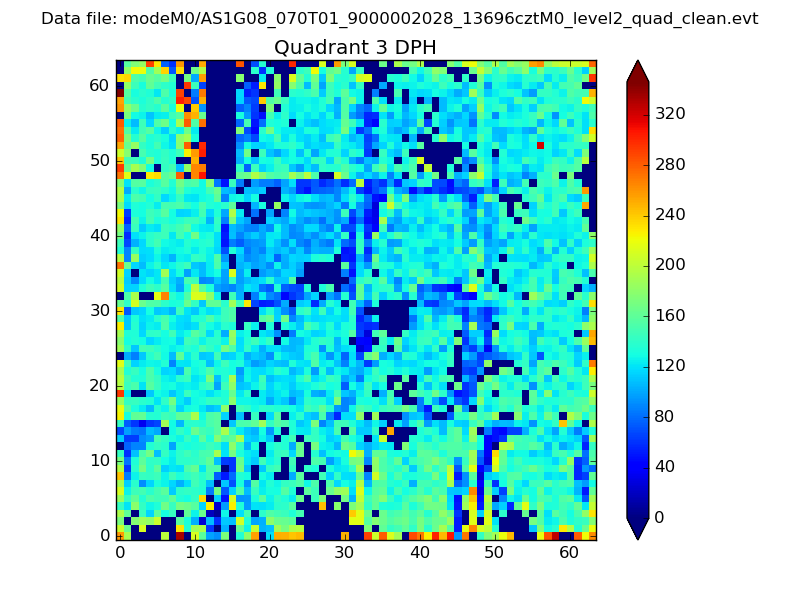 |
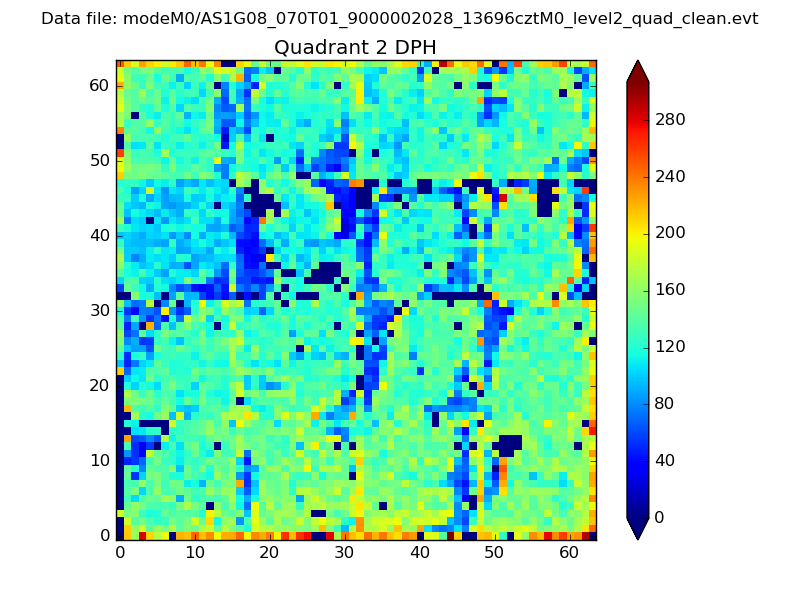 |
Quadrant C |
| Plot type | Count rate plots | Images |
|---|---|---|
| Comparison with Poisson distribution Blue bars denote a histogram of data divided into 1 sec bins. Red curve is a Poisson curve with rate = median count rate of data. |
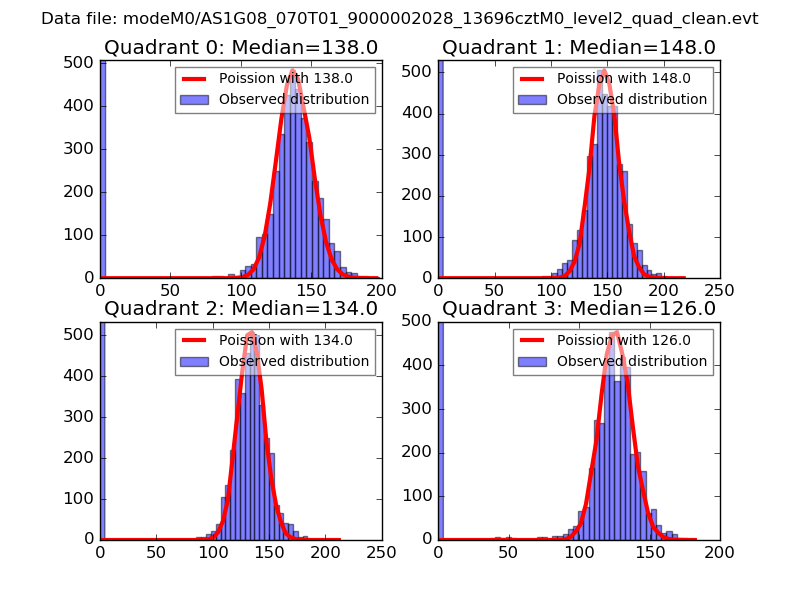 |
 |
| Quadrant-wise count rates Data is divided into 100 sec bins |
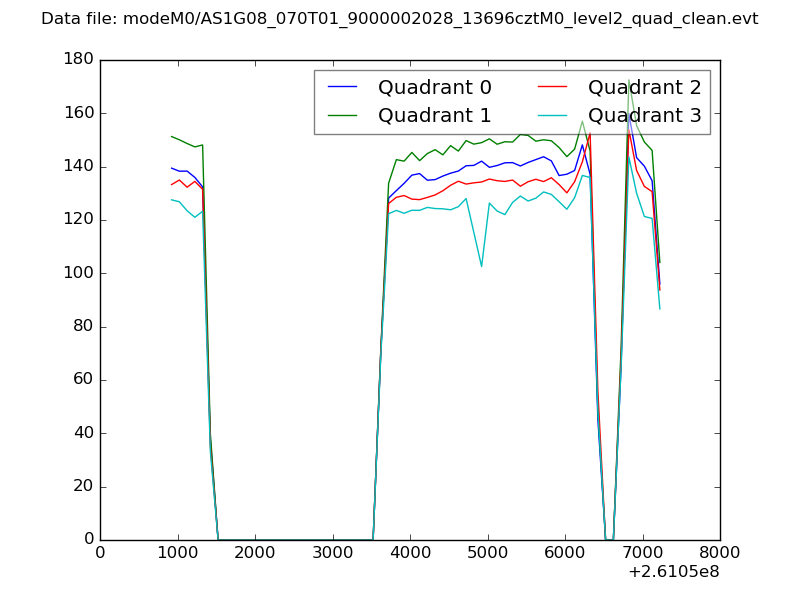 |
|
| Module-wise count rates for Quadrant A Data is divided into 100 sec bins |
 |
 |
| Module-wise count rates for Quadrant B Data is divided into 100 sec bins |
 |
 |
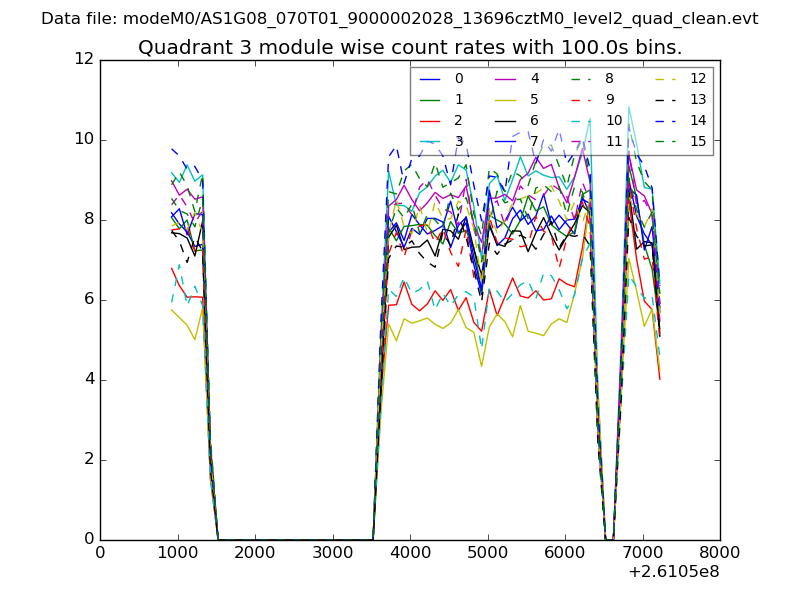
| Module-wise count rates for Quadrant C Data is divided into 100 sec bins |
 |
 |
| Module-wise count rates for Quadrant D Data is divided into 100 sec bins |
 |
 |
| Parameter | Plot |
|---|---|
| CZT HV Monitor | 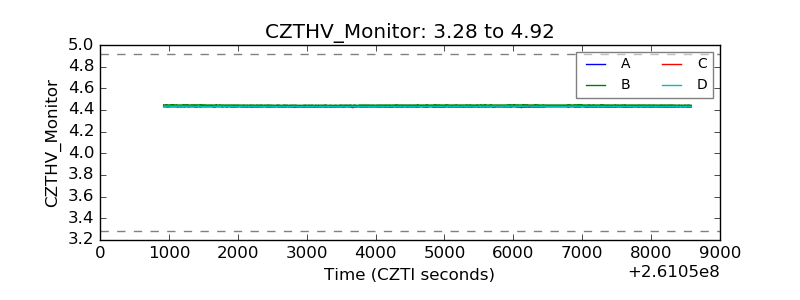 |
| D_VDD | 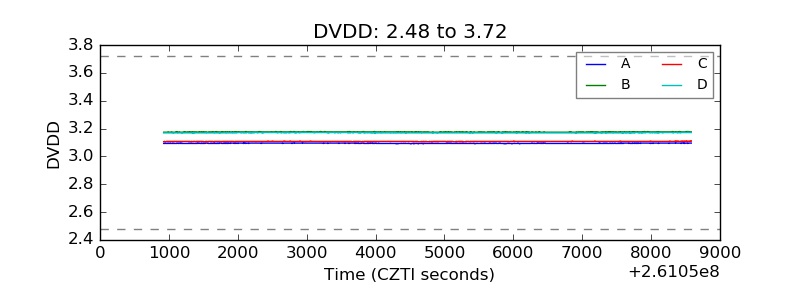 |
| Temperature 1 | 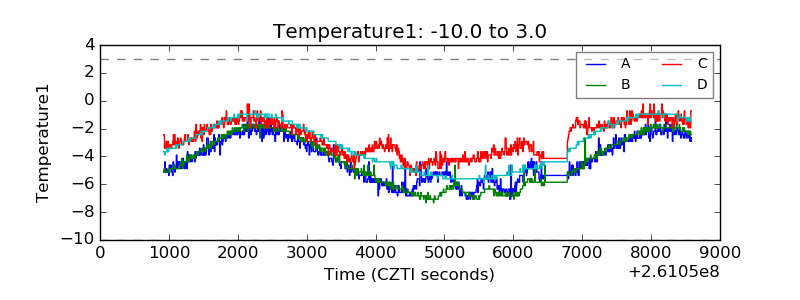 |
| Veto HV Monitor | 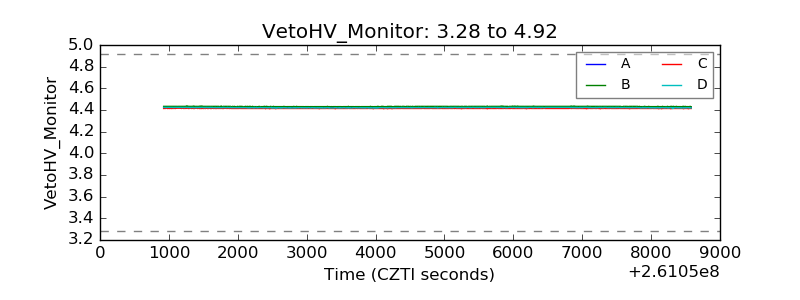 |
| Veto LLD | 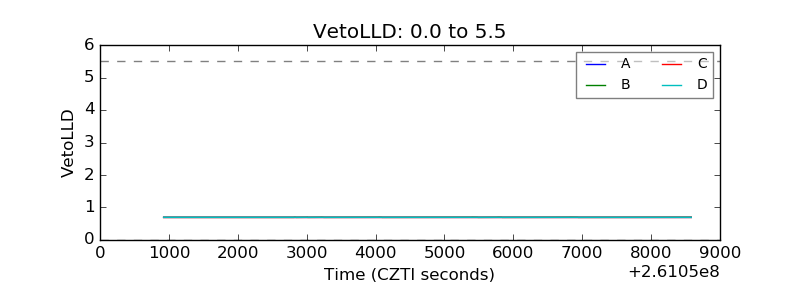 |
| Alpha Counter | 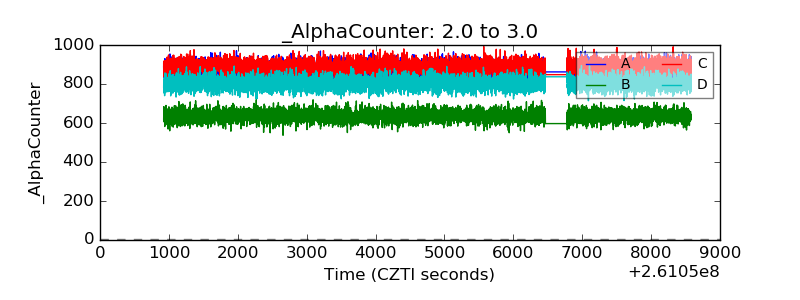 |
| _CPM_Rate | 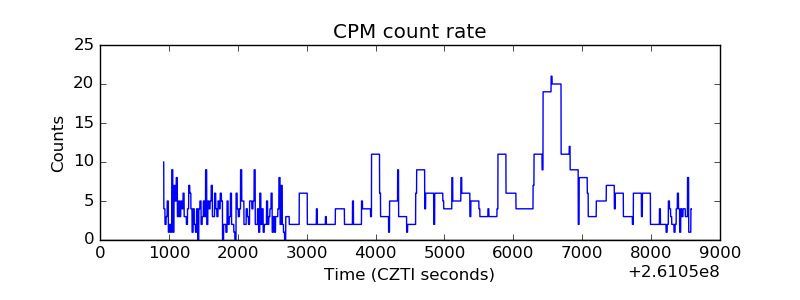 |
| CZT Counter | 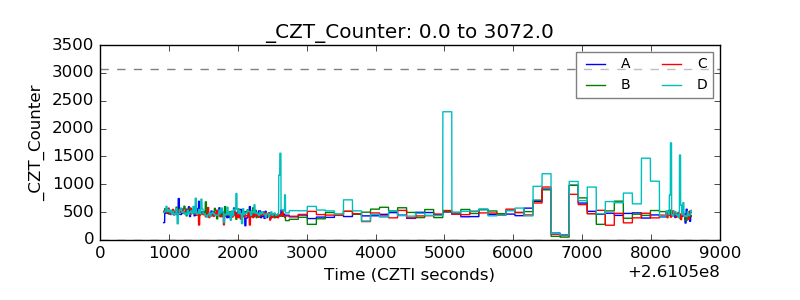 |
| +2.5 Volts monitor |  |
| +5 Volts monitor |  |
| _ROLL_ROT | 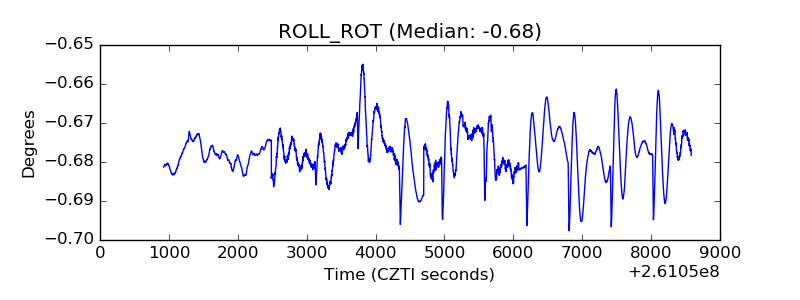 |
| _Roll_DEC | 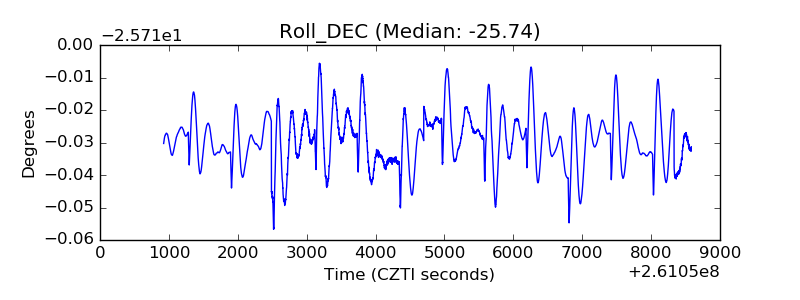 |
| _Roll_RA | 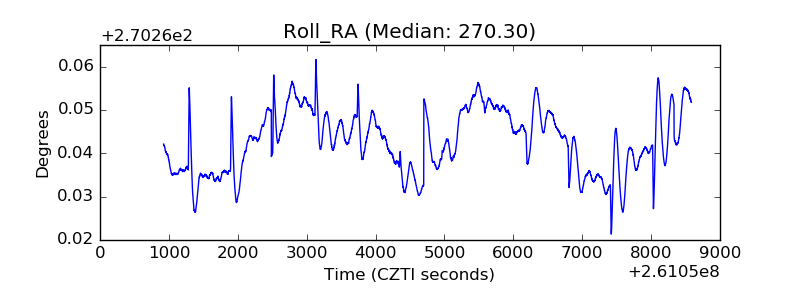 |
| Veto Counter |  |