| Param | Original file | Final file |
|---|---|---|
| Filename | modeM0/AS1G08_070T01_9000002028_13697cztM0_level2.evt | modeM0/AS1G08_070T01_9000002028_13697cztM0_level2_quad_clean.evt |
| Size (bytes) | 584,498,880 | 88,850,880 |
| Size | 557.4 MB | 84.7 MB |
| Events in quadrant A | 3,809,724 | 553,892 |
| Events in quadrant B | 3,975,272 | 578,902 |
| Events in quadrant C | 3,807,214 | 521,812 |
| Events in quadrant D | 5,587,725 | 500,748 |
| Mode SS | |||
|---|---|---|---|
| Quadrant | BADHDUFLAG | Total packets | Discarded packets |
| A | 0 | 154 | 0 |
| B | 0 | 154 | 0 |
| C | 0 | 154 | 0 |
| D | 0 | 154 | 0 |
| Mode M0 | |||
|---|---|---|---|
| Quadrant | BADHDUFLAG | Total packets | Discarded packets |
| A | 0 | 16218 | 2 |
| B | 0 | 16502 | 1 |
| C | 0 | 16199 | 1 |
| D | 0 | 21814 | 1 |
| Quadrant | Total seconds | Saturated seconds | Saturation percentage |
|---|---|---|---|
| A | 7689 | 264 | 3.433476% |
| B | 7689 | 294 | 3.823644% |
| C | 7689 | 193 | 2.510079% |
| D | 7689 | 451 | 5.865522% |
Noise dominated data is calculated using 1-second bins in cleaned event files. If a bin has >2000 counts, and if more than 50% of those come from <1% of pixels, then it is considered to be noise-dominated and hence unusable.
| Quadrant | # 1 sec bins | Bins with >0 counts | Bins with >2000 counts | High rate bins dominated by noise | Noise dominated (total time) | Noise dominated (detector-on time) | Marked lightcurve |
|---|---|---|---|---|---|---|---|
| A | 7705 | 7691 | 0 | 0 | 0.00% | 0.00% | 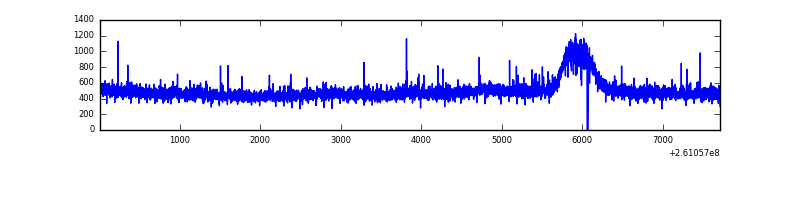 |
| B | 7705 | 7691 | 7 | 7 | 0.09% | 0.09% | 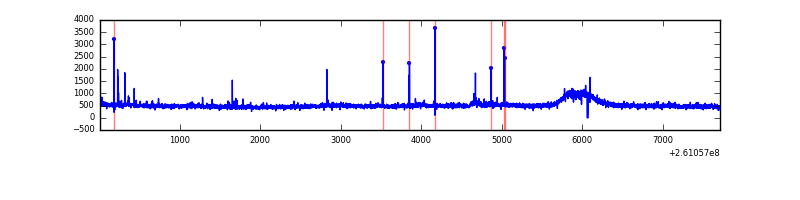 |
| C | 7705 | 7691 | 0 | 0 | 0.00% | 0.00% | 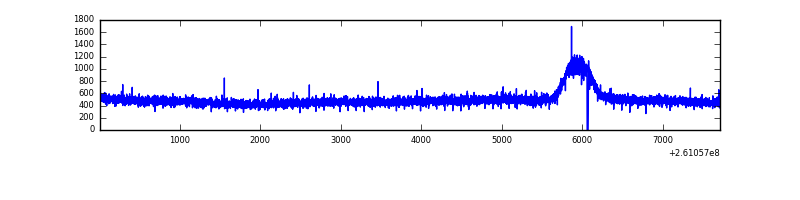 |
| D | 7705 | 7691 | 126 | 126 | 1.64% | 1.64% | 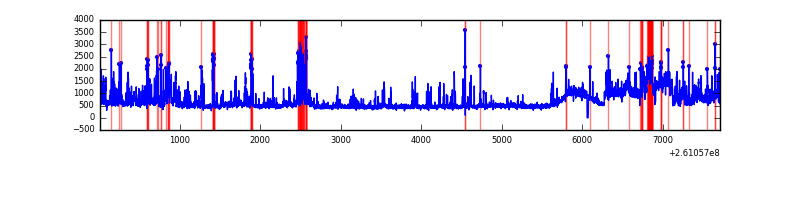 |
Top three noisy pixels from each quadrant. If the there are fewer than three noisy pixels in the level2.evt file, extra rows are filled as -1
| Pixel properties | Quadrant properties | ||||||
|---|---|---|---|---|---|---|---|
| Quadrant | DetID | PixID | Counts | Sigma | Mean | Median | Sigma |
| A | 1 | 162 | 20139 | 95.0 | 981 | 960 | 201.9 |
| A | 0 | 226 | 8886 | 39.26 | 981 | 960 | 201.9 |
| A | 12 | 194 | 7573 | 32.76 | 981 | 960 | 201.9 |
| B | 0 | 219 | 59419 | 308.72 | 981 | 960 | 189.4 |
| B | 4 | 80 | 37802 | 194.56 | 981 | 960 | 189.4 |
| B | 0 | 214 | 32721 | 167.73 | 981 | 960 | 189.4 |
| C | 3 | 233 | 118460 | 529.29 | 944 | 948 | 222.0 |
| C | 13 | 61 | 6908 | 26.84 | 944 | 948 | 222.0 |
| C | 8 | 128 | 4246 | 14.85 | 944 | 948 | 222.0 |
| D | 1 | 52 | 936672 | 4049.72 | 940 | 914 | 231.1 |
| D | 13 | 122 | 837083 | 3618.72 | 940 | 914 | 231.1 |
| D | 8 | 195 | 94711 | 405.93 | 940 | 914 | 231.1 |
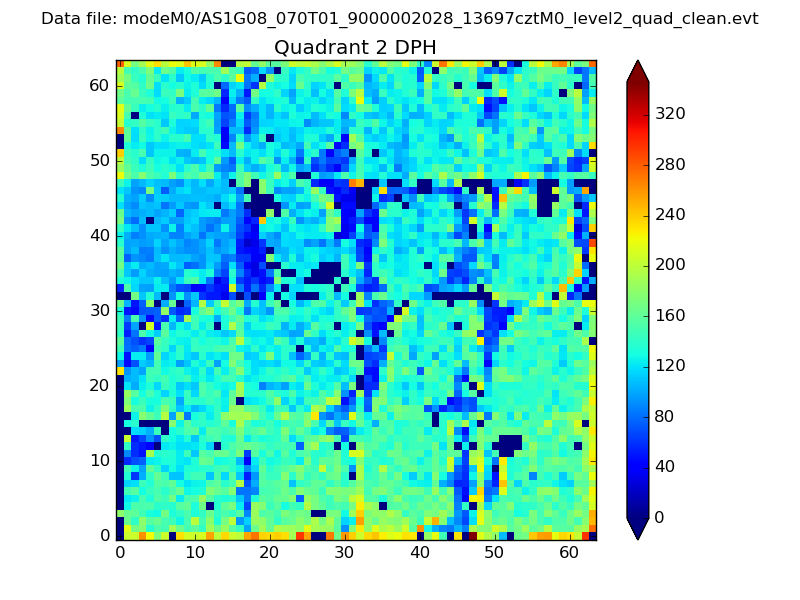
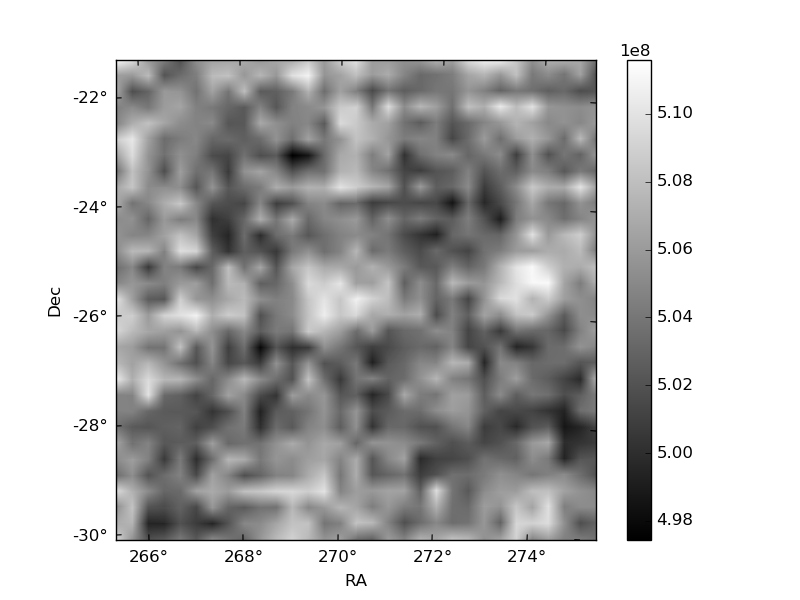
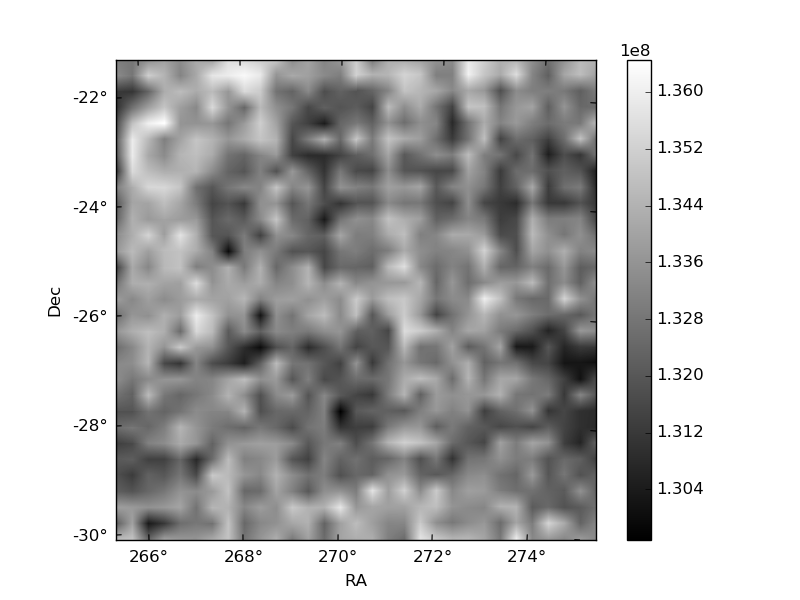
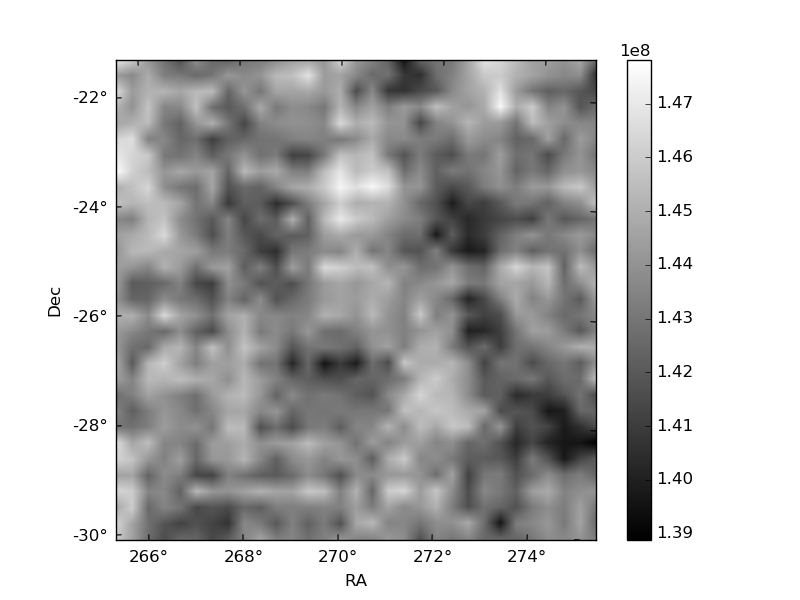
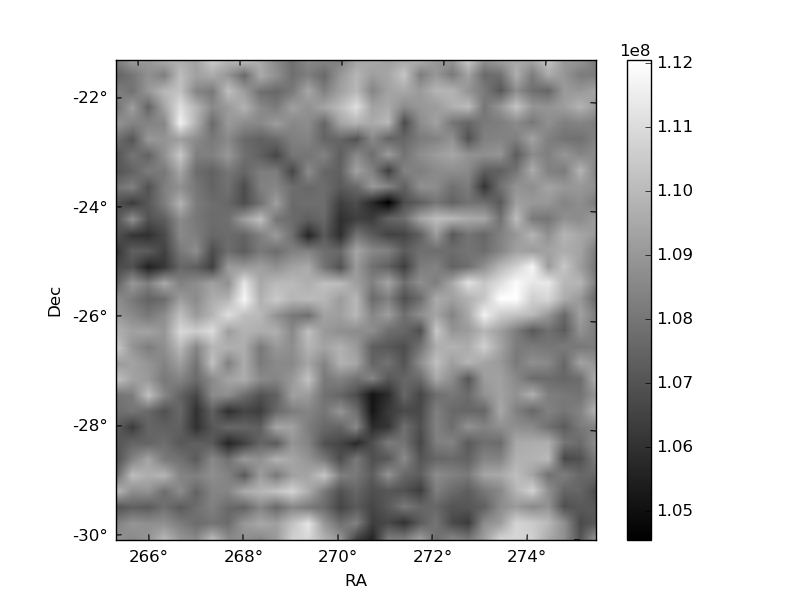
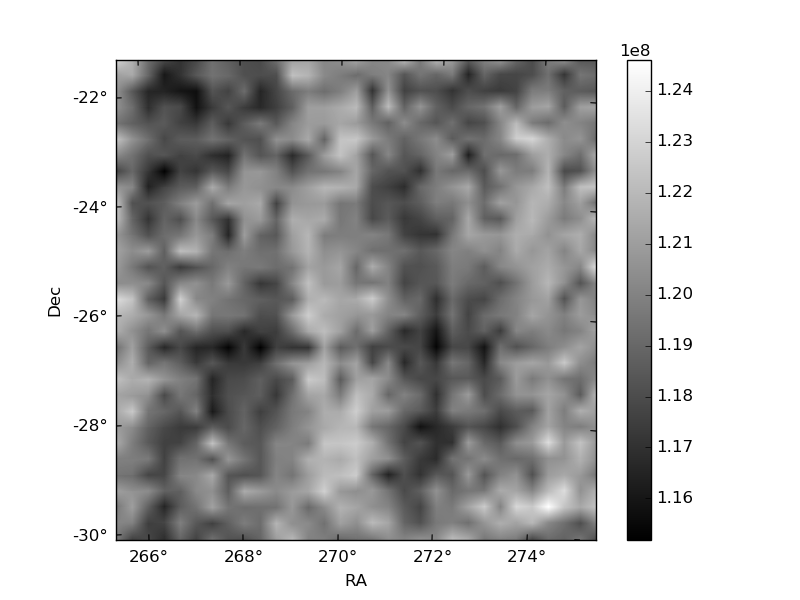
Histogram calculated using DETX and DETY for each event in the final _common_clean file
| Quadrant A | 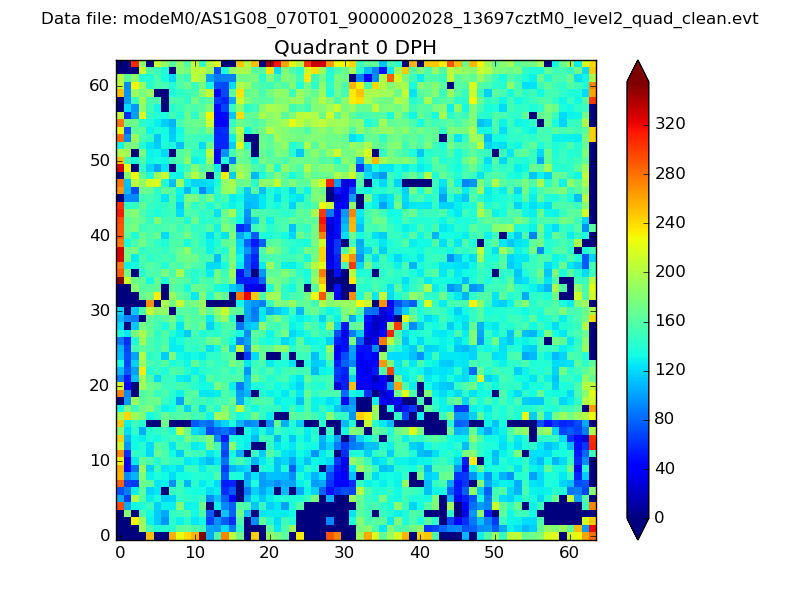 |
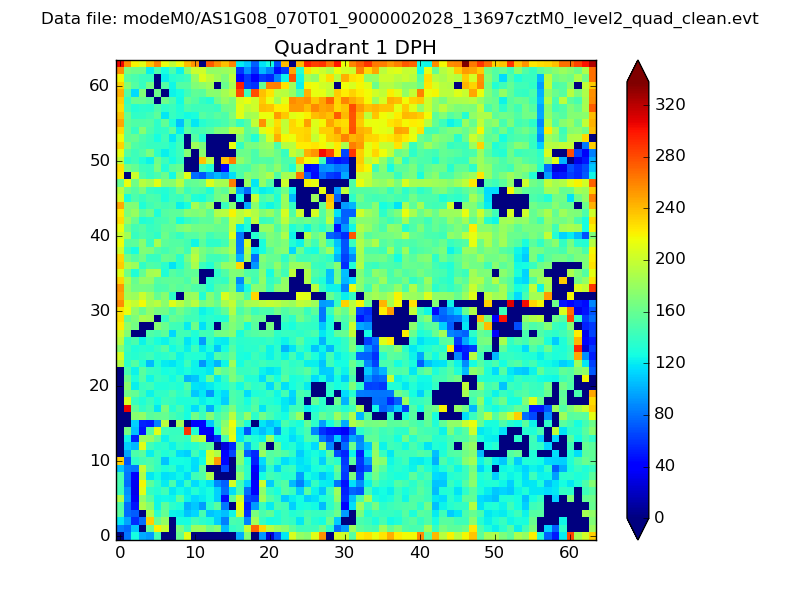 |
Quadrant B |
|---|---|---|---|
| Quadrant D | 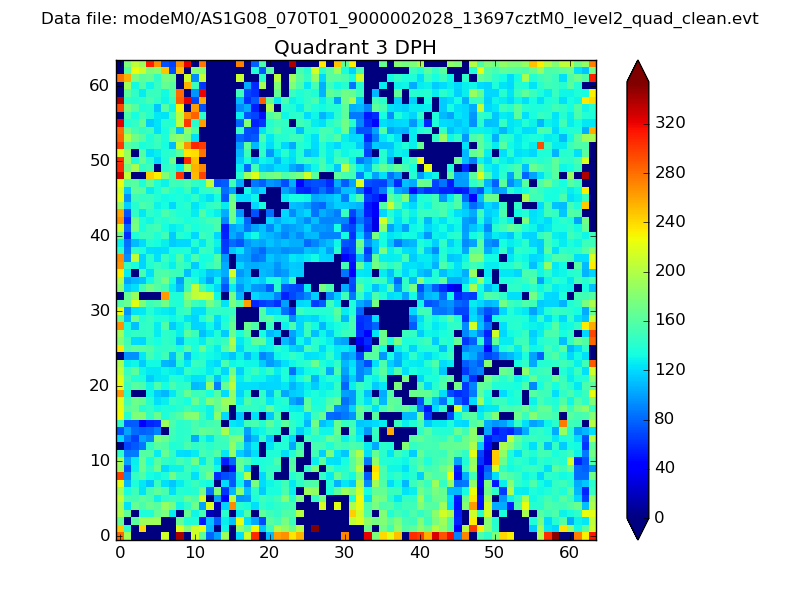 |
 |
Quadrant C |
| Plot type | Count rate plots | Images |
|---|---|---|
| Comparison with Poisson distribution Blue bars denote a histogram of data divided into 1 sec bins. Red curve is a Poisson curve with rate = median count rate of data. |
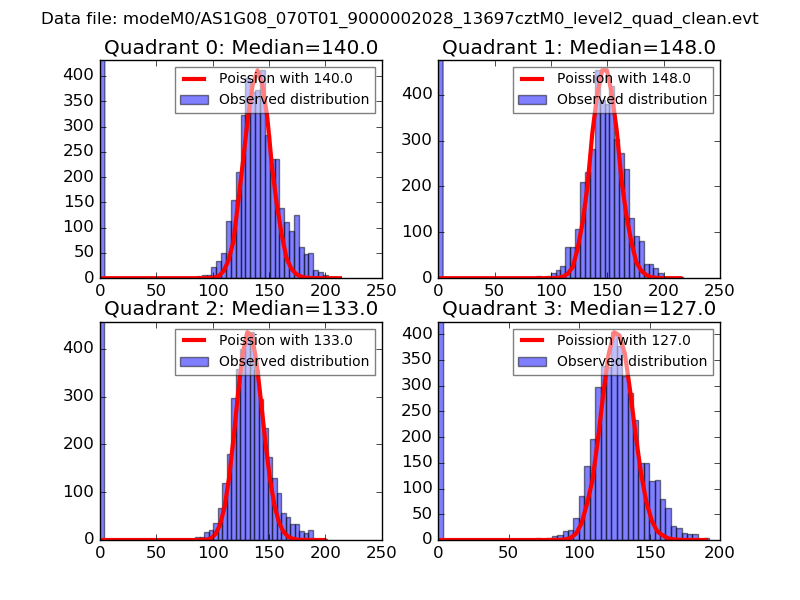 |
 |
| Quadrant-wise count rates Data is divided into 100 sec bins |
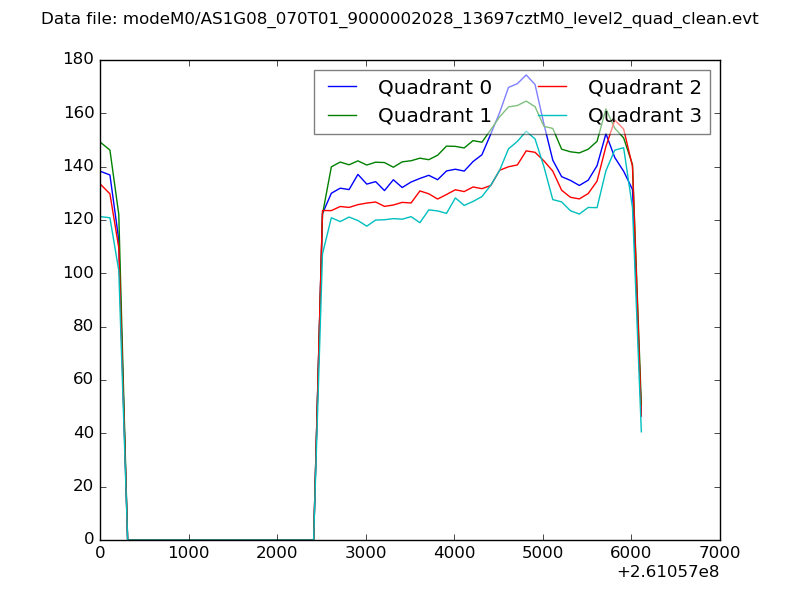 |
|
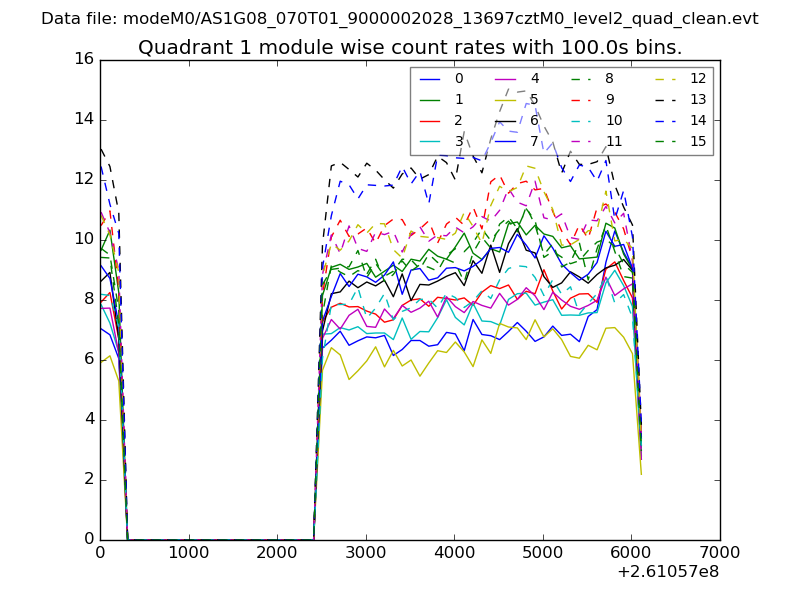
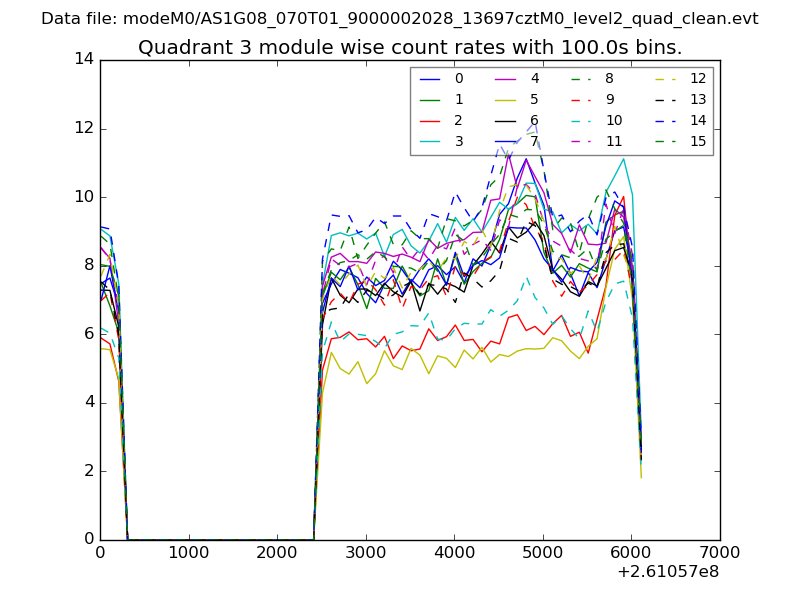
| Module-wise count rates for Quadrant A Data is divided into 100 sec bins |
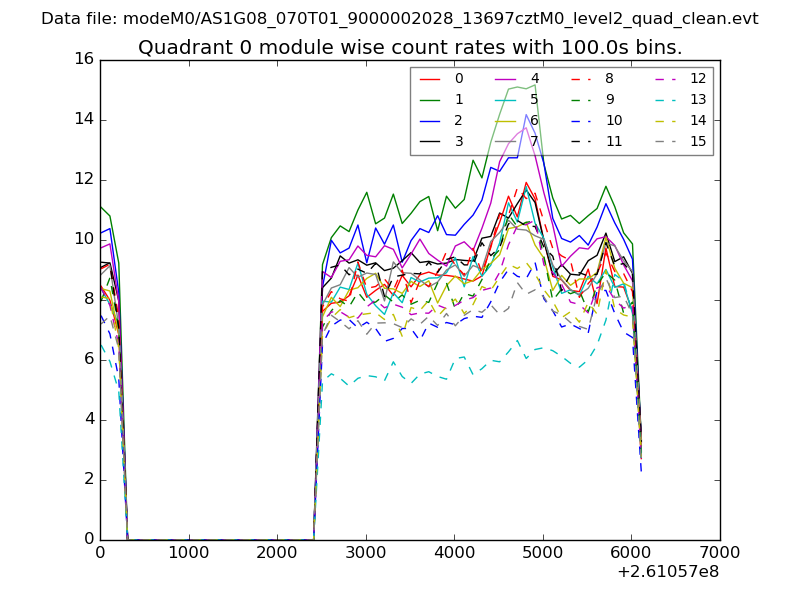 |
 |
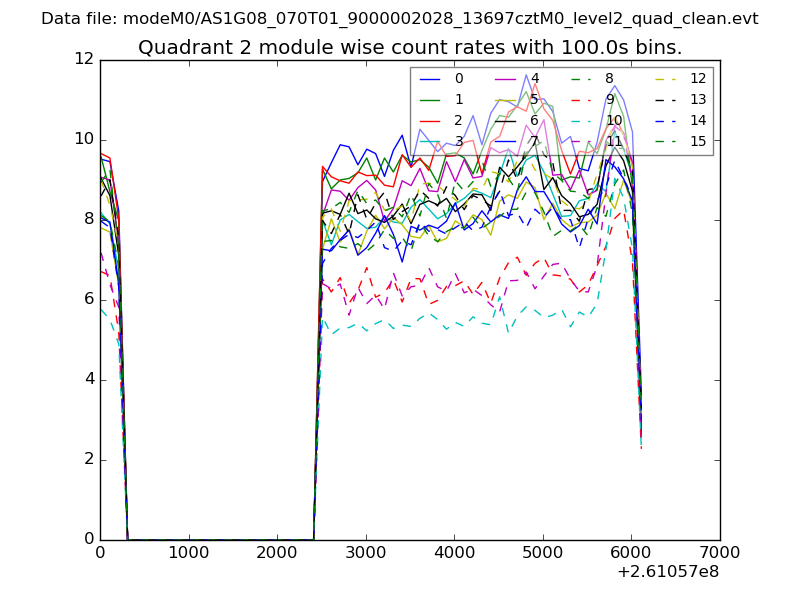
| Module-wise count rates for Quadrant B Data is divided into 100 sec bins |
 |
 |
| Module-wise count rates for Quadrant C Data is divided into 100 sec bins |
 |
 |
| Module-wise count rates for Quadrant D Data is divided into 100 sec bins |
 |
 |
| Parameter | Plot |
|---|---|
| CZT HV Monitor | 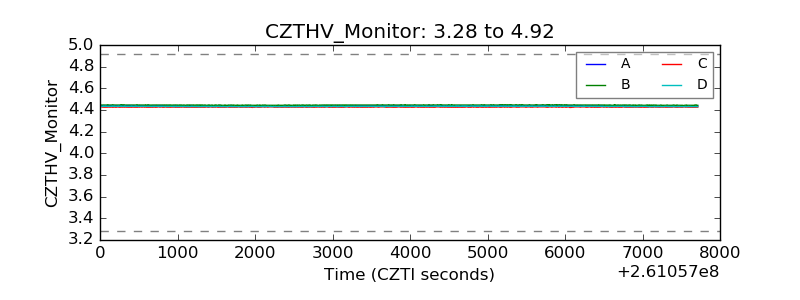 |
| D_VDD | 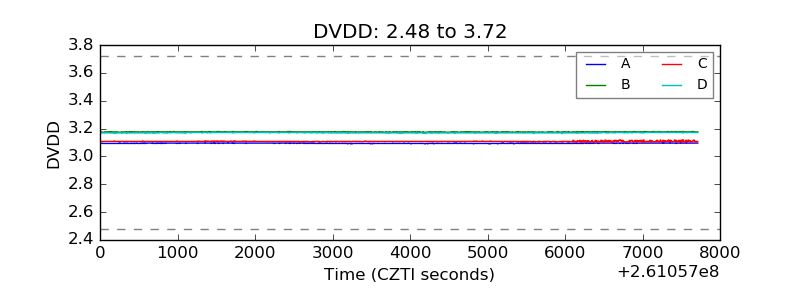 |
| Temperature 1 |  |
| Veto HV Monitor | 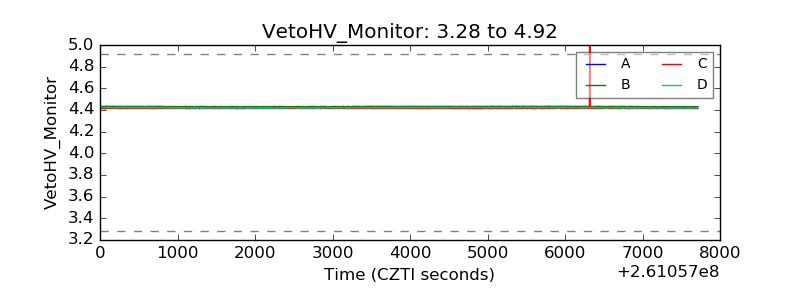 |
| Veto LLD | 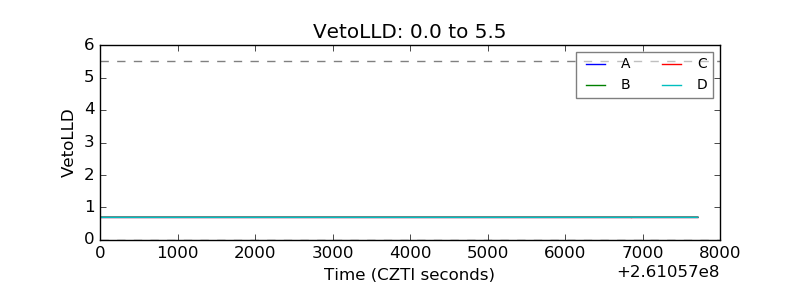 |
| Alpha Counter |  |
| _CPM_Rate | 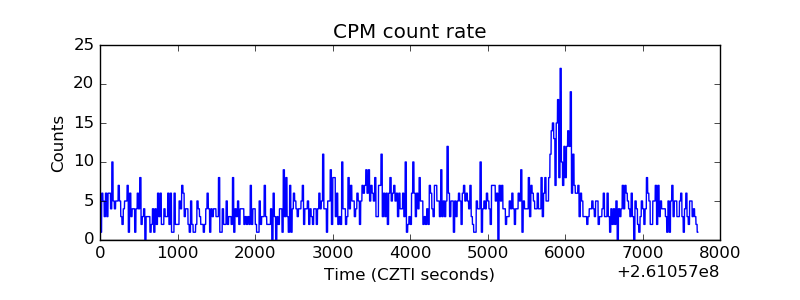 |
| CZT Counter | 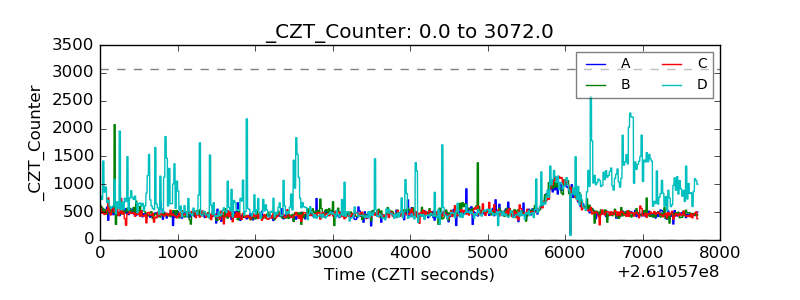 |
| +2.5 Volts monitor |  |
| +5 Volts monitor |  |
| _ROLL_ROT | 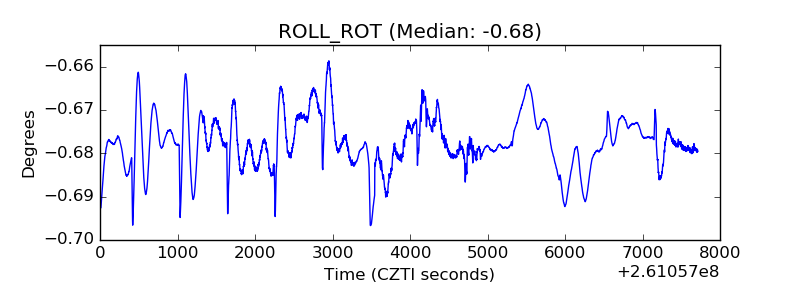 |
| _Roll_DEC | 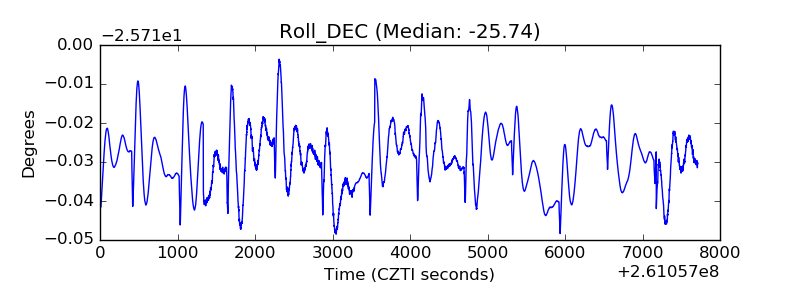 |
| _Roll_RA | 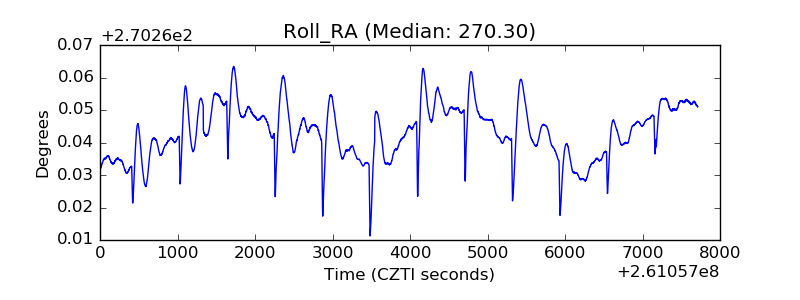 |
| Veto Counter | 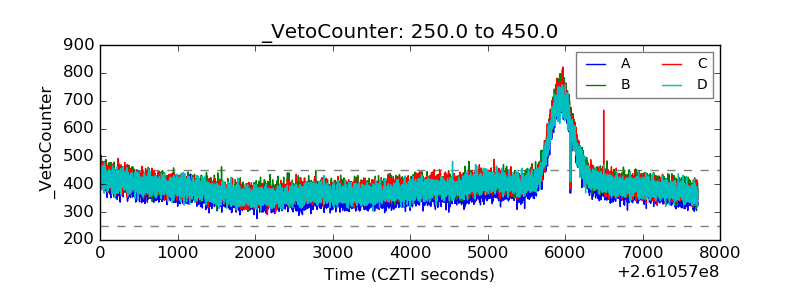 |