| Param | Original file | Final file |
|---|---|---|
| Filename | modeM0/AS1G08_070T01_9000002028_13698cztM0_level2.evt | modeM0/AS1G08_070T01_9000002028_13698cztM0_level2_quad_clean.evt |
| Size (bytes) | 262,396,800 | 23,685,120 |
| Size | 250.2 MB | 22.6 MB |
| Events in quadrant A | 1,558,868 | 124,588 |
| Events in quadrant B | 1,594,526 | 132,490 |
| Events in quadrant C | 1,561,017 | 121,794 |
| Events in quadrant D | 3,015,992 | 112,686 |
| Mode SS | |||
|---|---|---|---|
| Quadrant | BADHDUFLAG | Total packets | Discarded packets |
| A | 0 | 64 | 0 |
| B | 0 | 64 | 0 |
| C | 0 | 64 | 0 |
| D | 0 | 64 | 0 |
| Mode M0 | |||
|---|---|---|---|
| Quadrant | BADHDUFLAG | Total packets | Discarded packets |
| A | 0 | 6684 | 1 |
| B | 0 | 6746 | 1 |
| C | 0 | 6689 | 1 |
| D | 0 | 11157 | 1 |
| Quadrant | Total seconds | Saturated seconds | Saturation percentage |
|---|---|---|---|
| A | 3159 | 109 | 3.450459% |
| B | 3159 | 119 | 3.767015% |
| C | 3159 | 77 | 2.437480% |
| D | 3159 | 293 | 9.275087% |
Noise dominated data is calculated using 1-second bins in cleaned event files. If a bin has >2000 counts, and if more than 50% of those come from <1% of pixels, then it is considered to be noise-dominated and hence unusable.
| Quadrant | # 1 sec bins | Bins with >0 counts | Bins with >2000 counts | High rate bins dominated by noise | Noise dominated (total time) | Noise dominated (detector-on time) | Marked lightcurve |
|---|---|---|---|---|---|---|---|
| A | 3175 | 3161 | 0 | 0 | 0.00% | 0.00% | 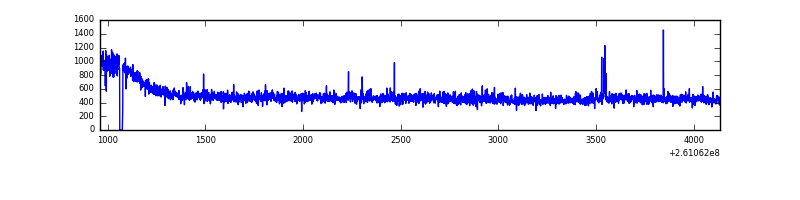 |
| B | 3175 | 3161 | 0 | 0 | 0.00% | 0.00% | 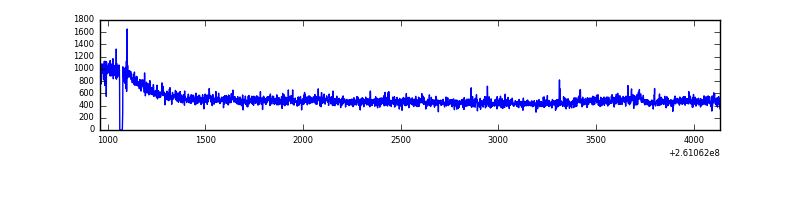 |
| C | 3175 | 3161 | 0 | 0 | 0.00% | 0.00% | 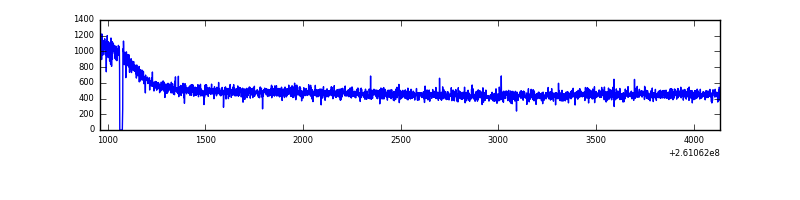 |
| D | 3175 | 3161 | 87 | 87 | 2.74% | 2.75% | 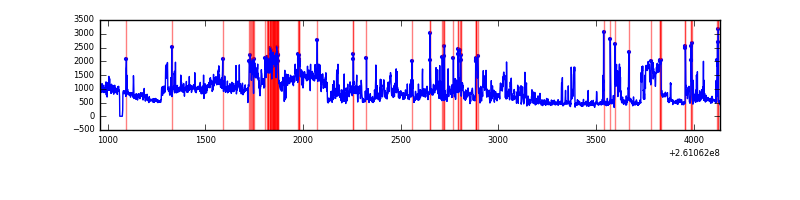 |
Top three noisy pixels from each quadrant. If the there are fewer than three noisy pixels in the level2.evt file, extra rows are filled as -1
| Pixel properties | Quadrant properties | ||||||
|---|---|---|---|---|---|---|---|
| Quadrant | DetID | PixID | Counts | Sigma | Mean | Median | Sigma |
| A | 1 | 162 | 8457 | 95.58 | 399 | 389 | 84.4 |
| A | 15 | 69 | 8453 | 95.53 | 399 | 389 | 84.4 |
| A | 0 | 226 | 3648 | 38.61 | 399 | 389 | 84.4 |
| B | 0 | 219 | 20296 | 249.98 | 398 | 388 | 79.6 |
| B | 0 | 214 | 10143 | 122.49 | 398 | 388 | 79.6 |
| B | 12 | 111 | 8958 | 107.61 | 398 | 388 | 79.6 |
| C | 3 | 233 | 54780 | 596.56 | 383 | 384 | 91.2 |
| C | 8 | 128 | 6155 | 63.29 | 383 | 384 | 91.2 |
| C | 8 | 112 | 3154 | 30.38 | 383 | 384 | 91.2 |
| D | 13 | 122 | 1069219 | 11359.6 | 377 | 366 | 94.1 |
| D | 1 | 52 | 238869 | 2534.77 | 377 | 366 | 94.1 |
| D | 10 | 157 | 118833 | 1259.04 | 377 | 366 | 94.1 |
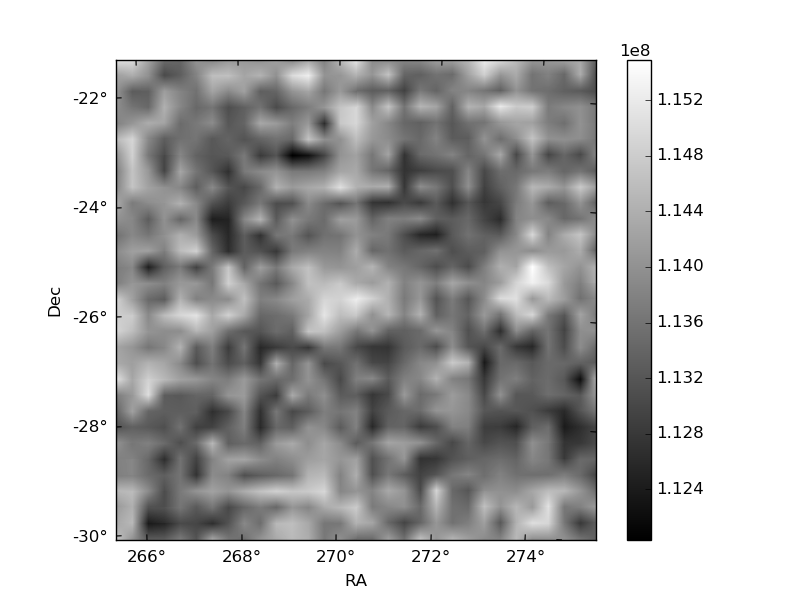
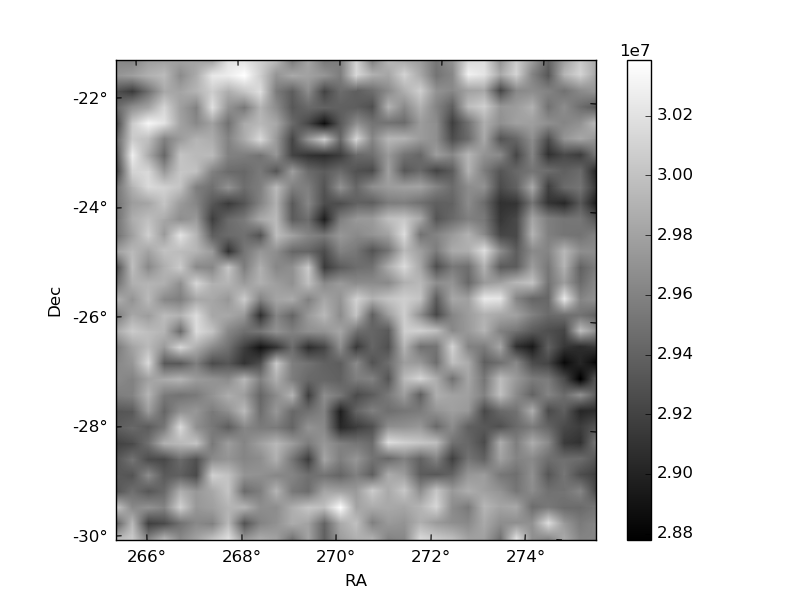
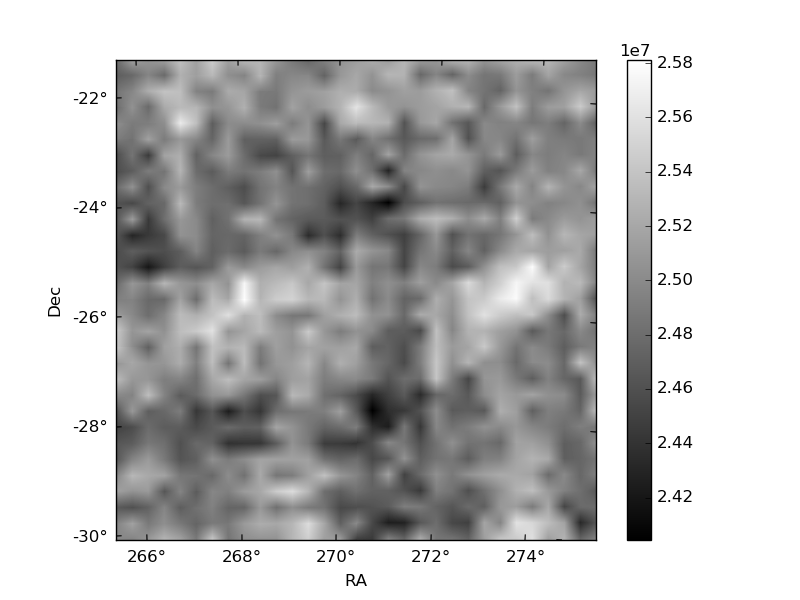
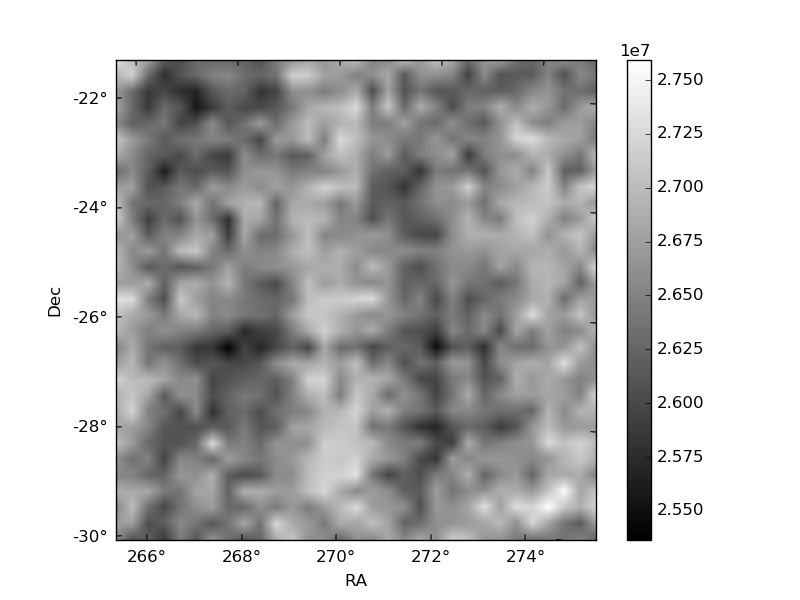
Histogram calculated using DETX and DETY for each event in the final _common_clean file
| Quadrant A | 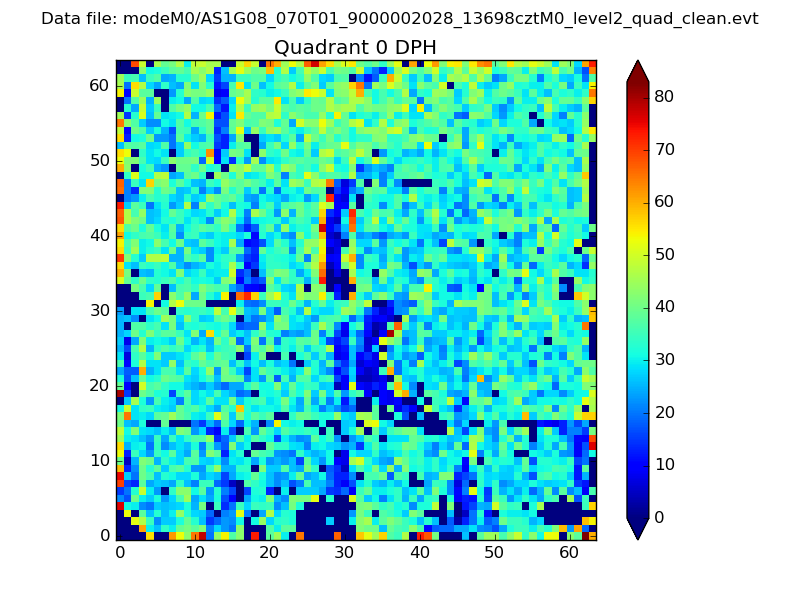 |
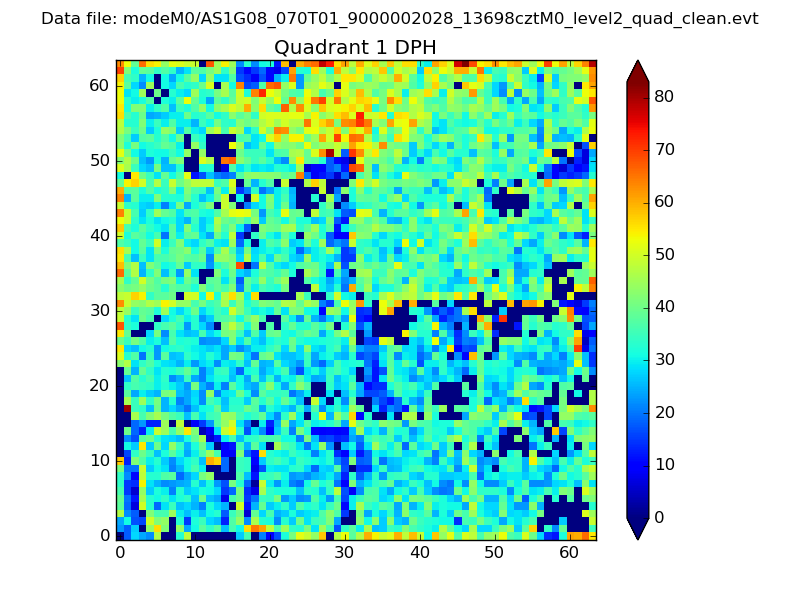 |
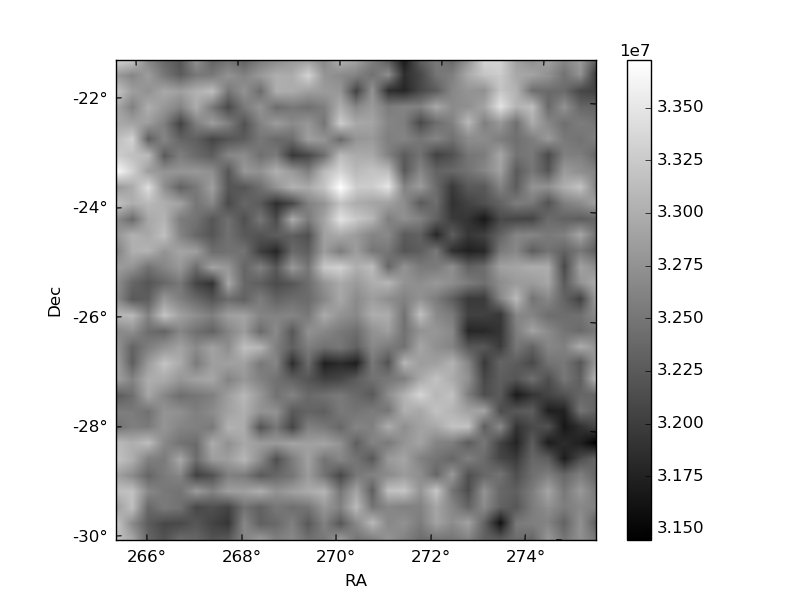
Quadrant B |
|---|---|---|---|
| Quadrant D | 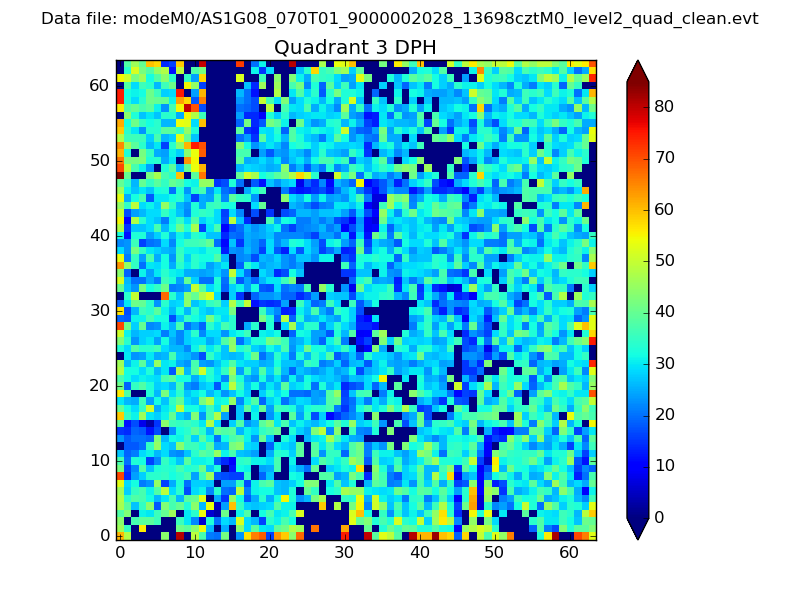 |
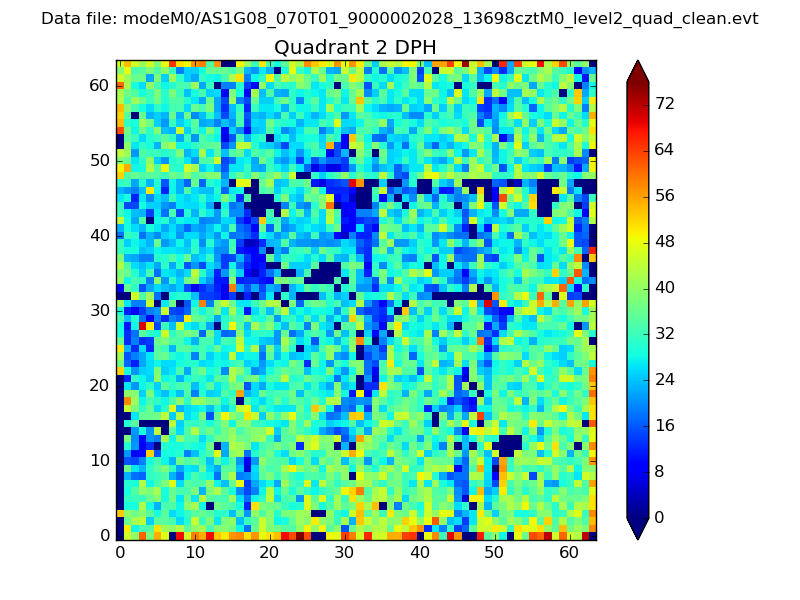 |
Quadrant C |
| Plot type | Count rate plots | Images |
|---|---|---|
| Comparison with Poisson distribution Blue bars denote a histogram of data divided into 1 sec bins. Red curve is a Poisson curve with rate = median count rate of data. |
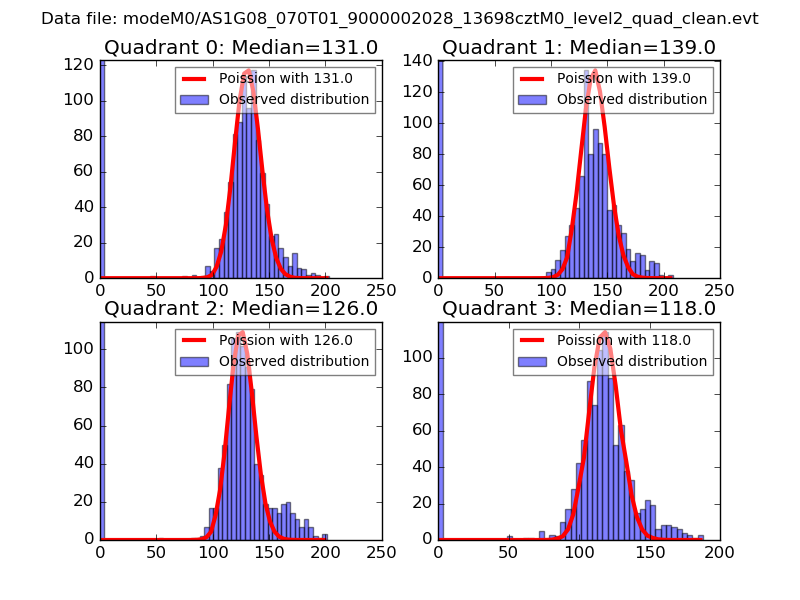 |
 |
| Quadrant-wise count rates Data is divided into 100 sec bins |
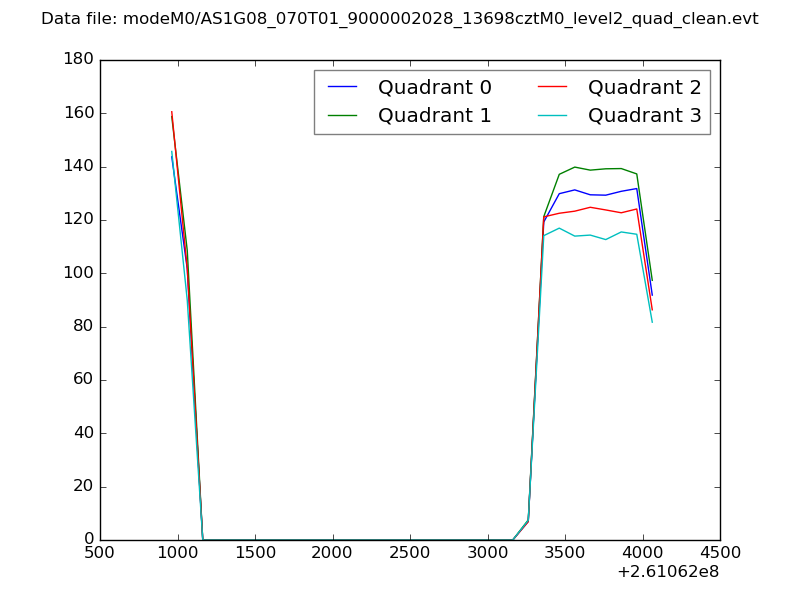 |
|
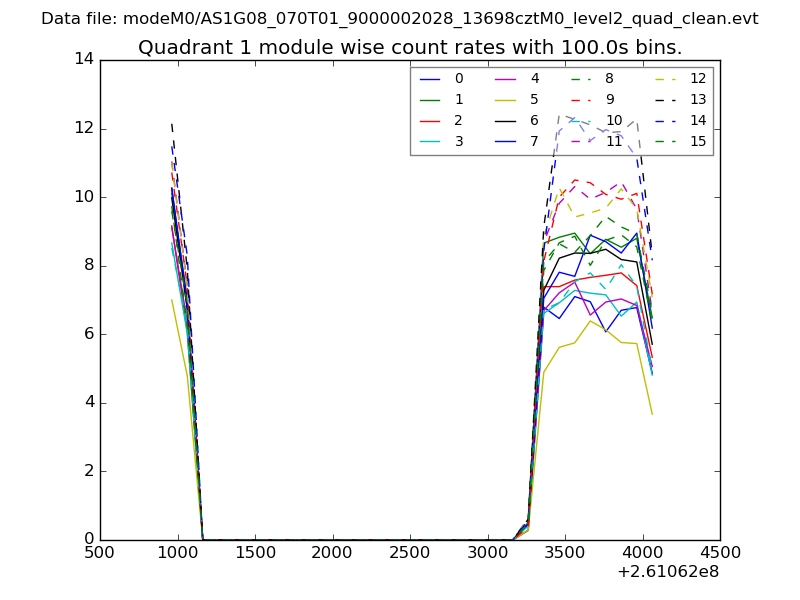
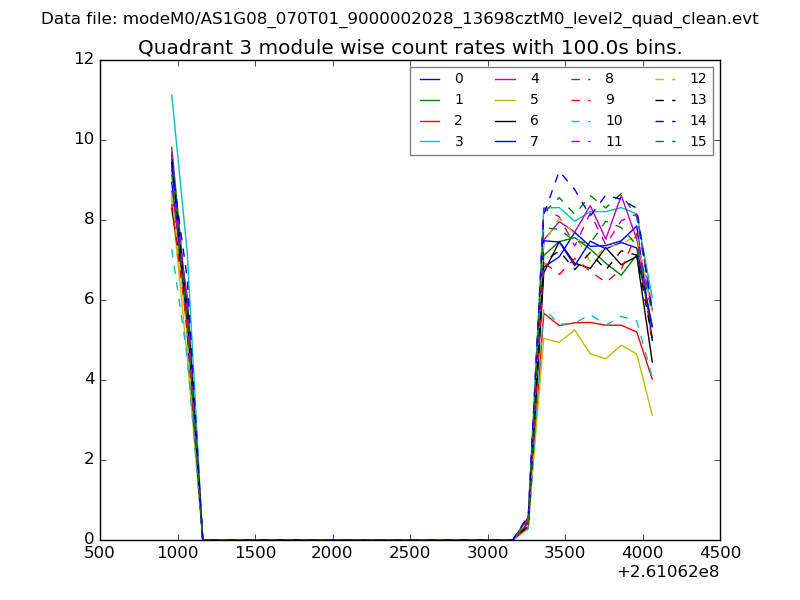
| Module-wise count rates for Quadrant A Data is divided into 100 sec bins |
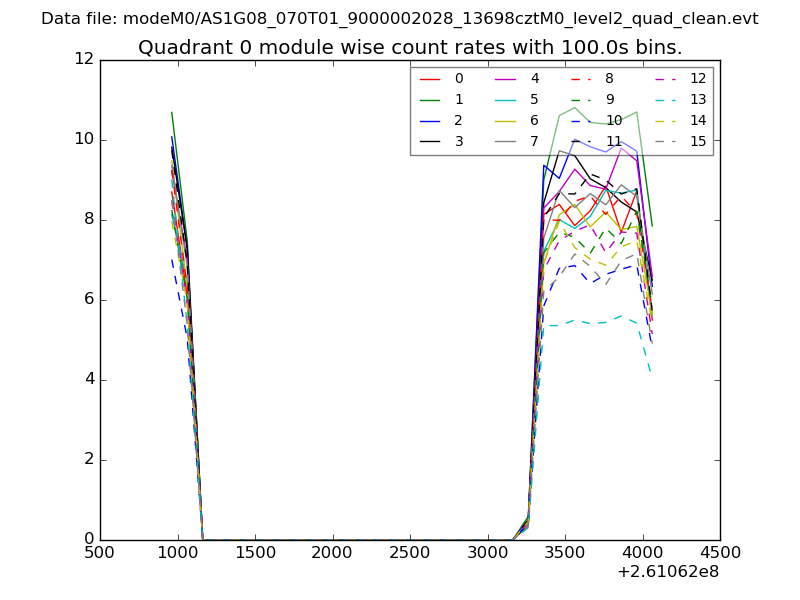 |
 |
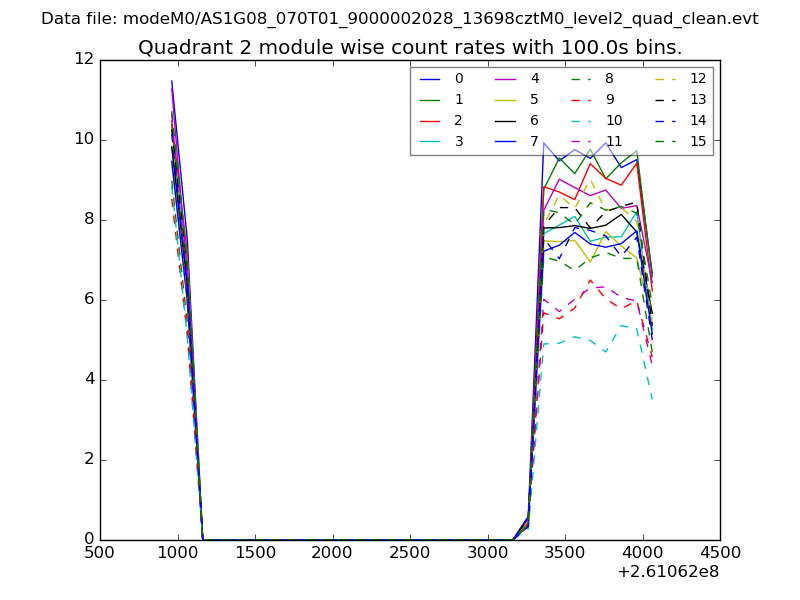
| Module-wise count rates for Quadrant B Data is divided into 100 sec bins |
 |
 |
| Module-wise count rates for Quadrant C Data is divided into 100 sec bins |
 |
 |
| Module-wise count rates for Quadrant D Data is divided into 100 sec bins |
 |
 |
| Parameter | Plot |
|---|---|
| CZT HV Monitor | 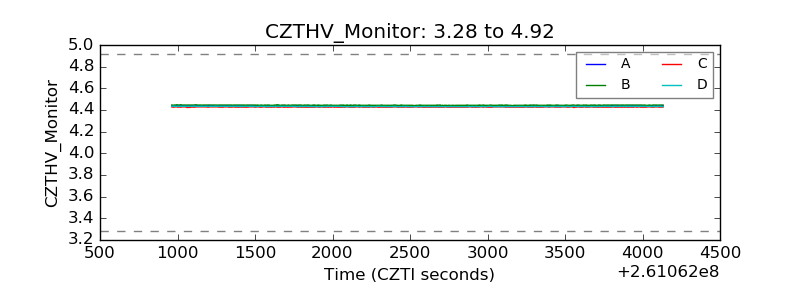 |
| D_VDD | 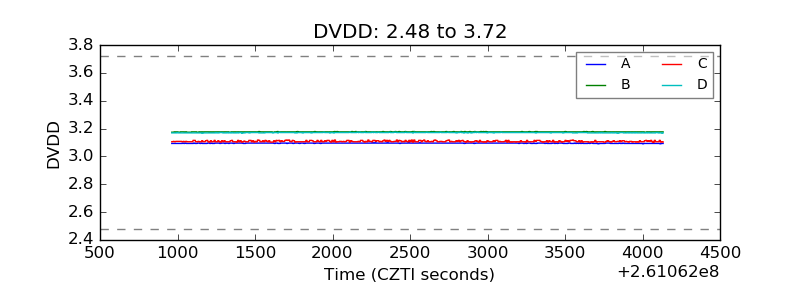 |
| Temperature 1 | 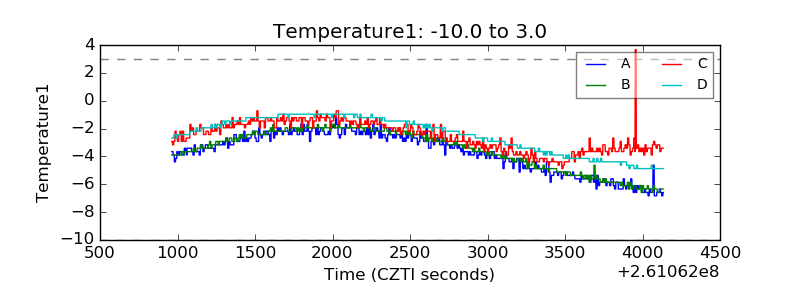 |
| Veto HV Monitor | 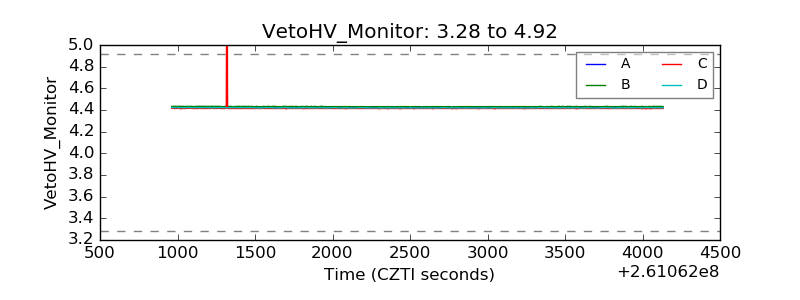 |
| Veto LLD |  |
| Alpha Counter | 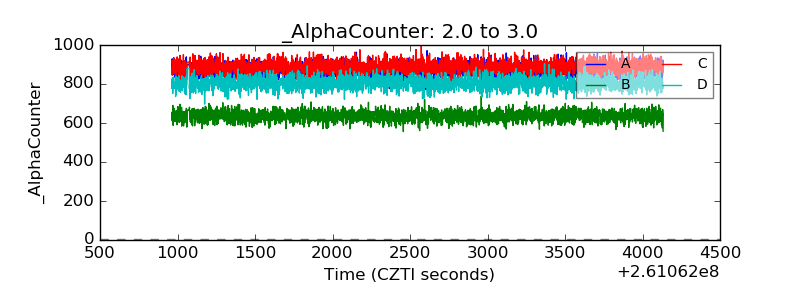 |
| _CPM_Rate | 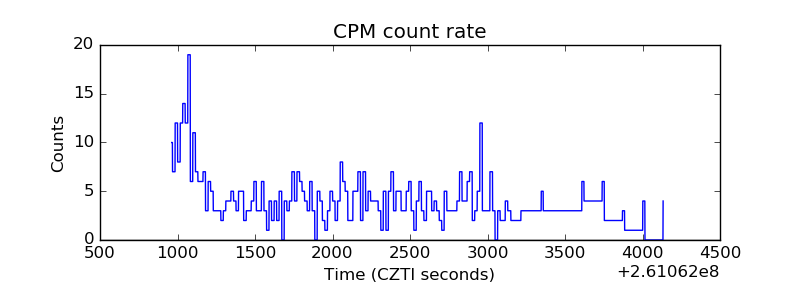 |
| CZT Counter | 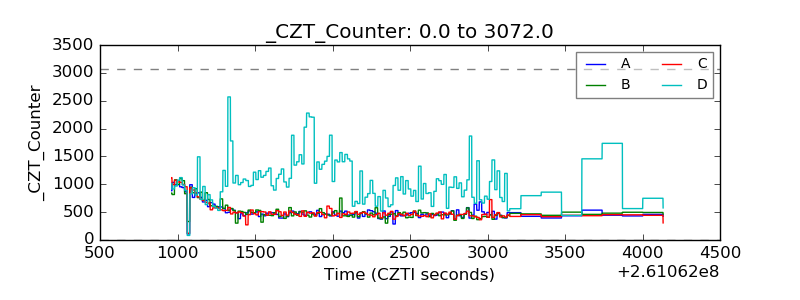 |
| +2.5 Volts monitor |  |
| +5 Volts monitor | 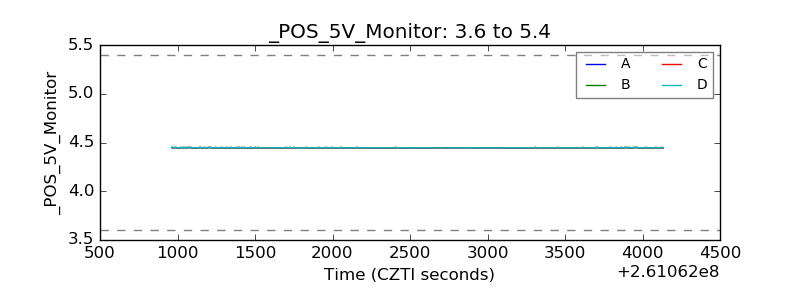 |
| _ROLL_ROT | 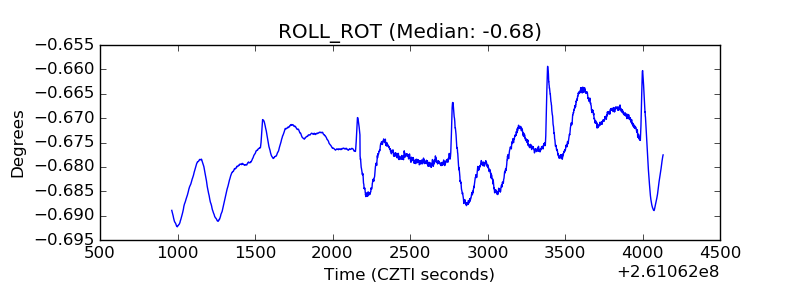 |
| _Roll_DEC | 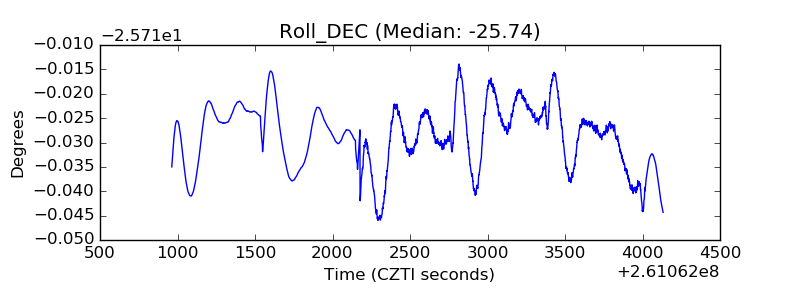 |
| _Roll_RA | 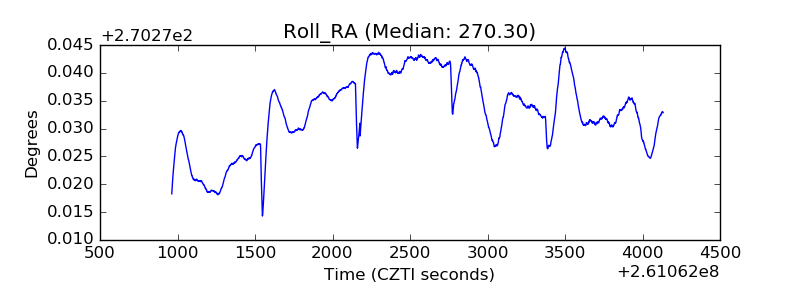 |
| Veto Counter | 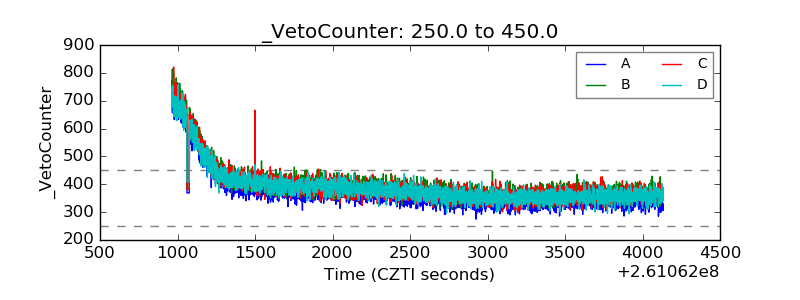 |