| Param | Original file | Final file |
|---|---|---|
| Filename | modeM0/AS1T02_039T01_9000002026cztM0_level2.fits | modeM0/AS1T02_039T01_9000002026cztM0_level2_quad_clean.evt |
| Size (bytes) | 181,474,560 | 148,389,120 |
| Size | 173.1 MB | 141.5 MB |
| Events in quadrant A | 1,160,152 | 851,626 |
| Events in quadrant B | 1,116,176 | 911,656 |
| Events in quadrant C | 1,123,332 | 870,076 |
| Events in quadrant D | 960,570 | 724,120 |
| Mode SS | |||
|---|---|---|---|
| Quadrant | BADHDUFLAG | Total packets | Discarded packets |
| A | 0 | 336 | 0 |
| B | 0 | 336 | 0 |
| C | 0 | 336 | 0 |
| D | 0 | 336 | 0 |
| Mode M0 | |||
|---|---|---|---|
| Quadrant | BADHDUFLAG | Total packets | Discarded packets |
| A | 0 | 42178 | 0 |
| B | 0 | 43750 | 0 |
| C | 0 | 36825 | 0 |
| D | 0 | 50372 | 0 |
| Mode M9 | |||
|---|---|---|---|
| Quadrant | BADHDUFLAG | Total packets | Discarded packets |
| A | 0 | 52 | 0 |
| B | 0 | 52 | 0 |
| C | 0 | 52 | 0 |
| D | 0 | 52 | 0 |
| Quadrant | Total seconds | Saturated seconds | Saturation percentage |
|---|---|---|---|
| A | 16464 | 962 | 5.843052% |
| B | 16464 | 865 | 5.253887% |
| C | 16464 | 251 | 1.524538% |
| D | 16464 | 1122 | 6.814869% |
Noise dominated data is calculated using 1-second bins in cleaned event files. If a bin has >2000 counts, and if more than 50% of those come from <1% of pixels, then it is considered to be noise-dominated and hence unusable.
| Quadrant | # 1 sec bins | Bins with >0 counts | Bins with >2000 counts | High rate bins dominated by noise | Noise dominated (total time) | Noise dominated (detector-on time) | Marked lightcurve |
|---|---|---|---|---|---|---|---|
| A | 21564 | 16452 | 0 | 0 | 0.00% | 0.00% | 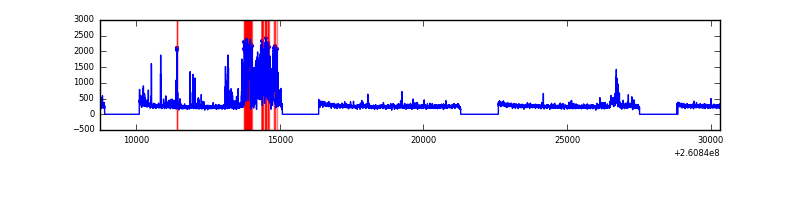 |
| B | 21564 | 16463 | 0 | 0 | 0.00% | 0.00% | 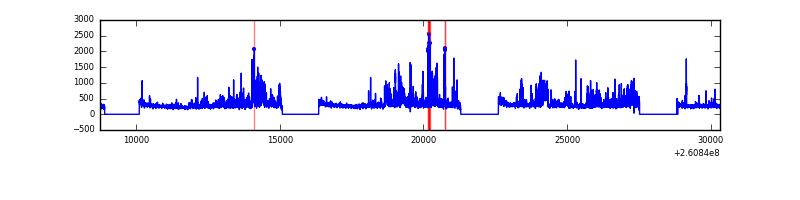 |
| C | 21564 | 16464 | 0 | 0 | 0.00% | 0.00% | 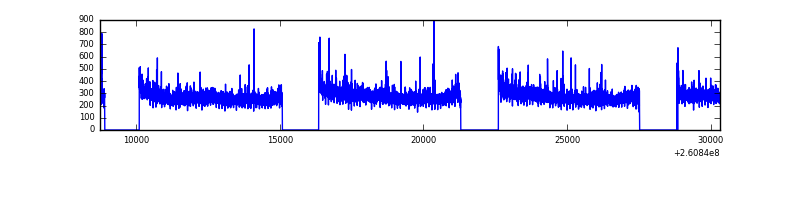 |
| D | 21564 | 16464 | 0 | 0 | 0.00% | 0.00% | 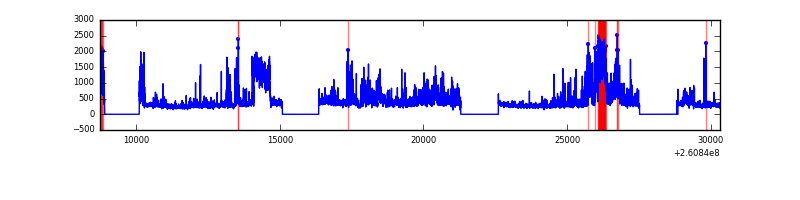 |
Top three noisy pixels from each quadrant. If the there are fewer than three noisy pixels in the level2.evt file, extra rows are filled as -1
| Pixel properties | Quadrant properties | ||||||
|---|---|---|---|---|---|---|---|
| Quadrant | DetID | PixID | Counts | Sigma | Mean | Median | Sigma |
| A | 14 | 188 | 1188 | 12.24 | 301 | 285 | 73.7 |
| A | 0 | 29 | 1127 | 11.42 | 301 | 285 | 73.7 |
| A | 14 | 204 | 1007 | 9.79 | 301 | 285 | 73.7 |
| B | 2 | 9 | 906 | 10.37 | 295 | 283 | 60.1 |
| B | 5 | 128 | 768 | 8.07 | 295 | 283 | 60.1 |
| B | 5 | 225 | 751 | 7.79 | 295 | 283 | 60.1 |
| C | 1 | 81 | 912 | 8.13 | 296 | 279 | 77.8 |
| C | 1 | 80 | 884 | 7.77 | 296 | 279 | 77.8 |
| C | 12 | 250 | 795 | 6.63 | 296 | 279 | 77.8 |
| D | 6 | 231 | 721 | 6.43 | 273 | 250 | 73.3 |
| D | 3 | 14 | 710 | 6.28 | 273 | 250 | 73.3 |
| D | 6 | 83 | 701 | 6.16 | 273 | 250 | 73.3 |
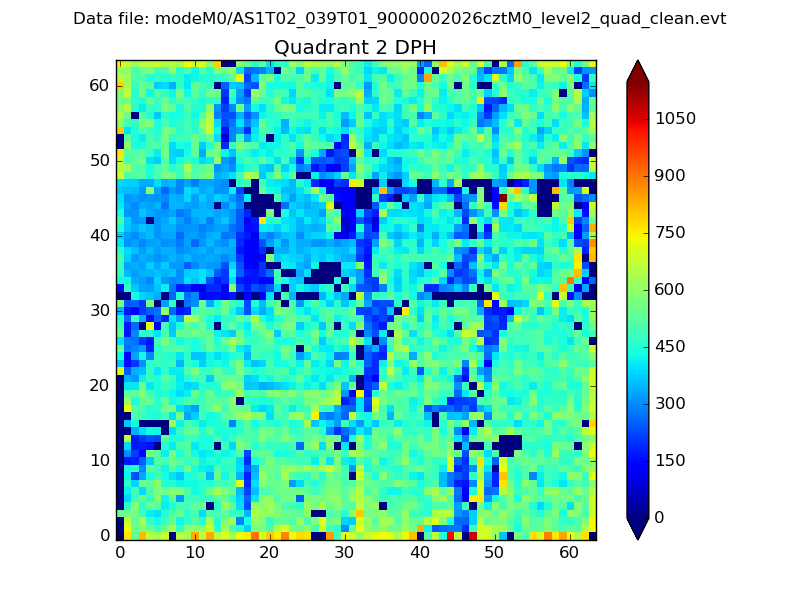
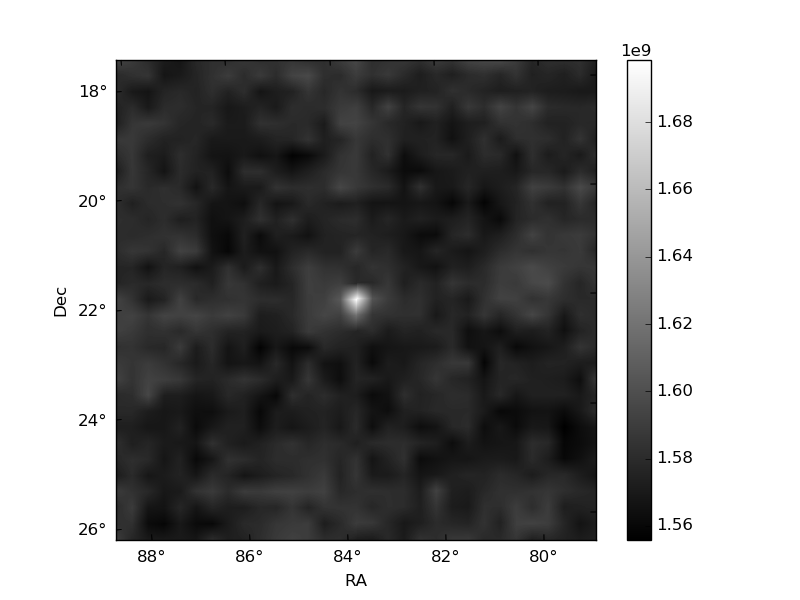
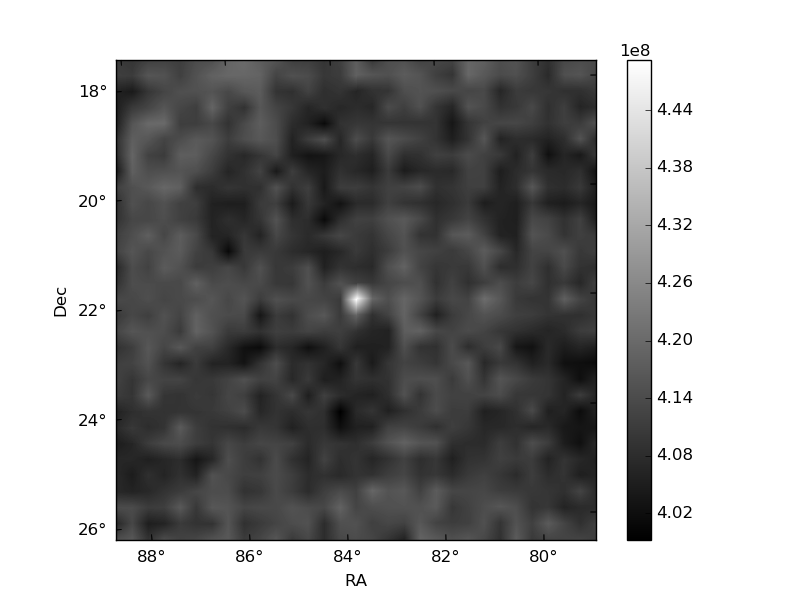
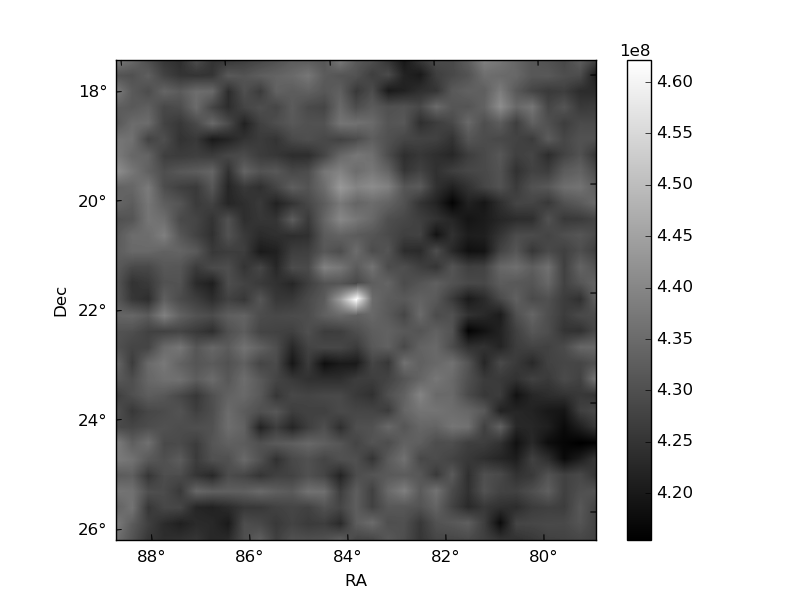
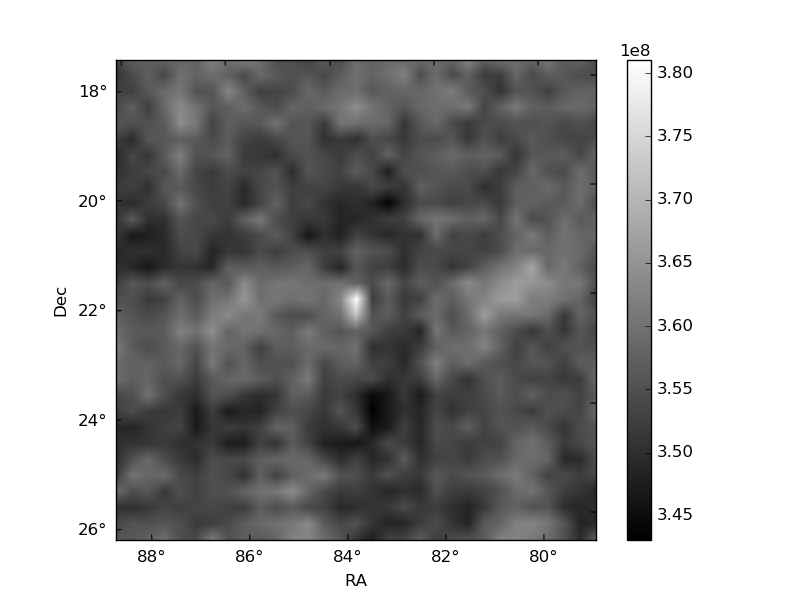
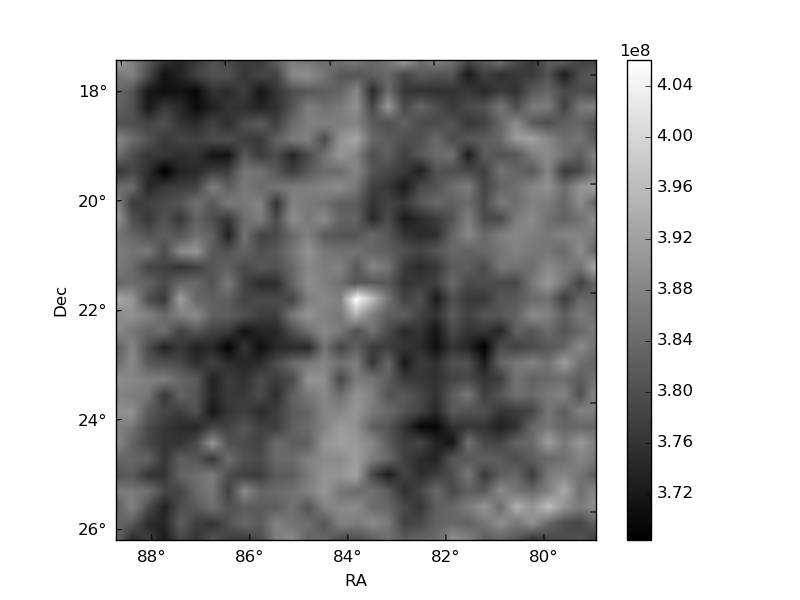
Histogram calculated using DETX and DETY for each event in the final _common_clean file
| Quadrant A | 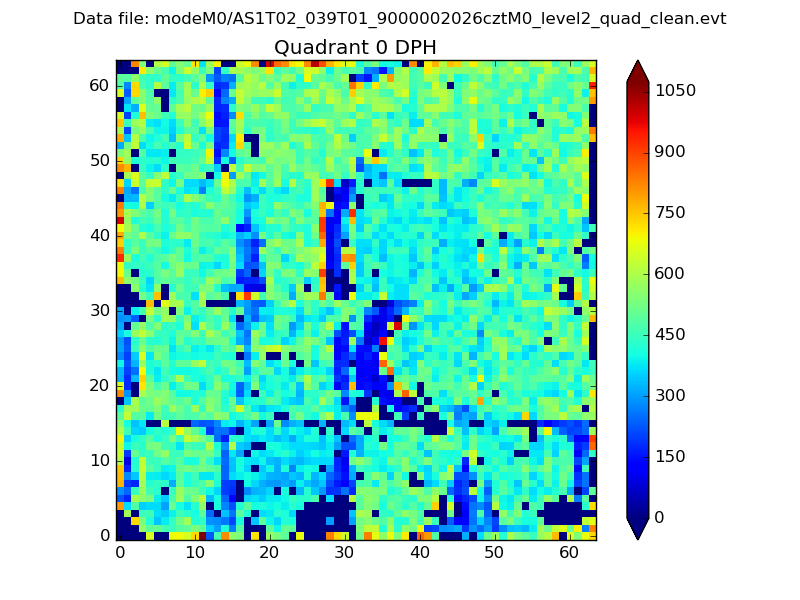 |
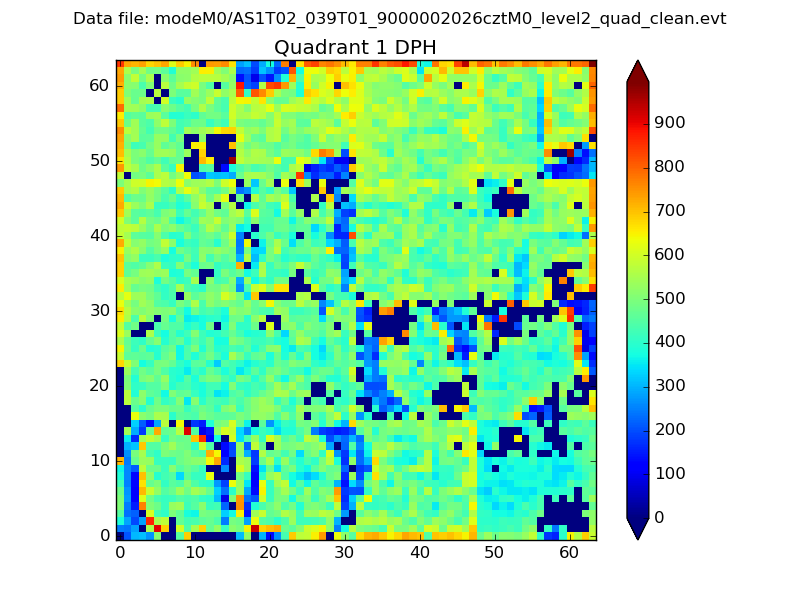 |
Quadrant B |
|---|---|---|---|
| Quadrant D | 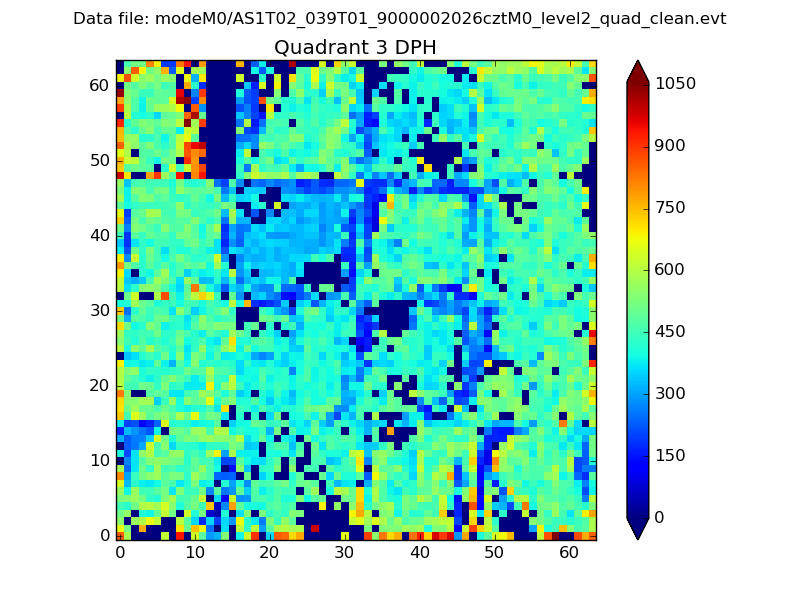 |
 |
Quadrant C |
| Plot type | Count rate plots | Images |
|---|---|---|
| Comparison with Poisson distribution Blue bars denote a histogram of data divided into 1 sec bins. Red curve is a Poisson curve with rate = median count rate of data. |
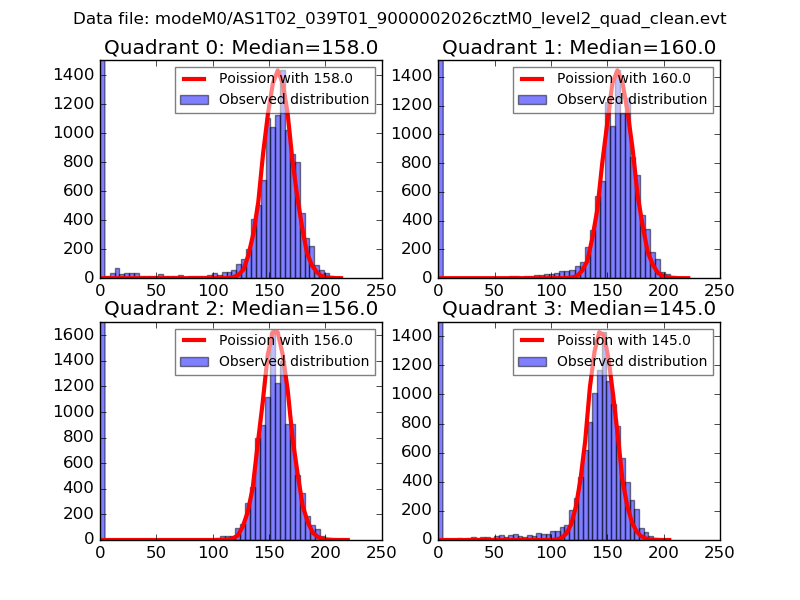 |
 |
| Quadrant-wise count rates Data is divided into 100 sec bins |
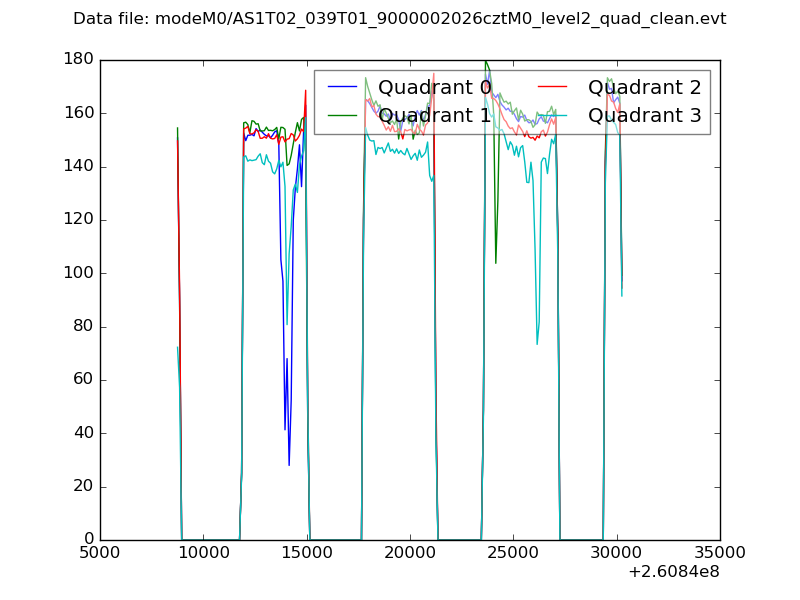 |
|
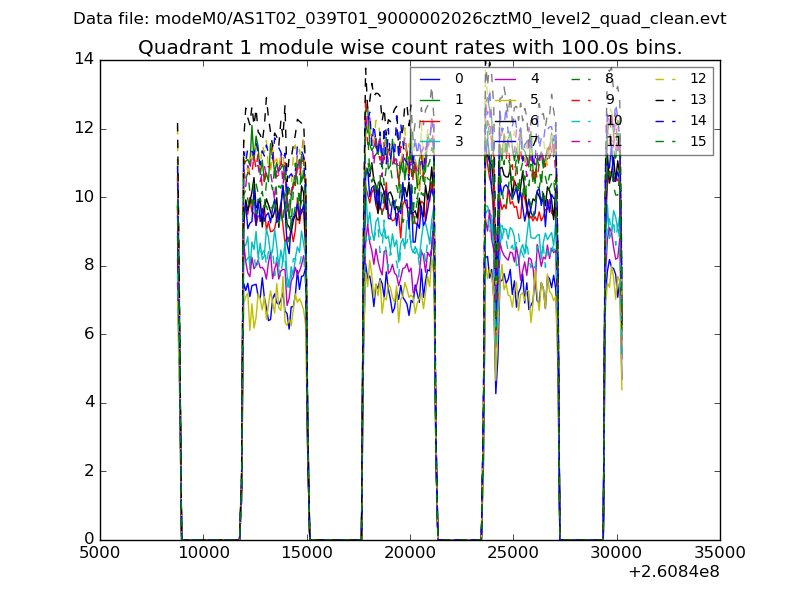
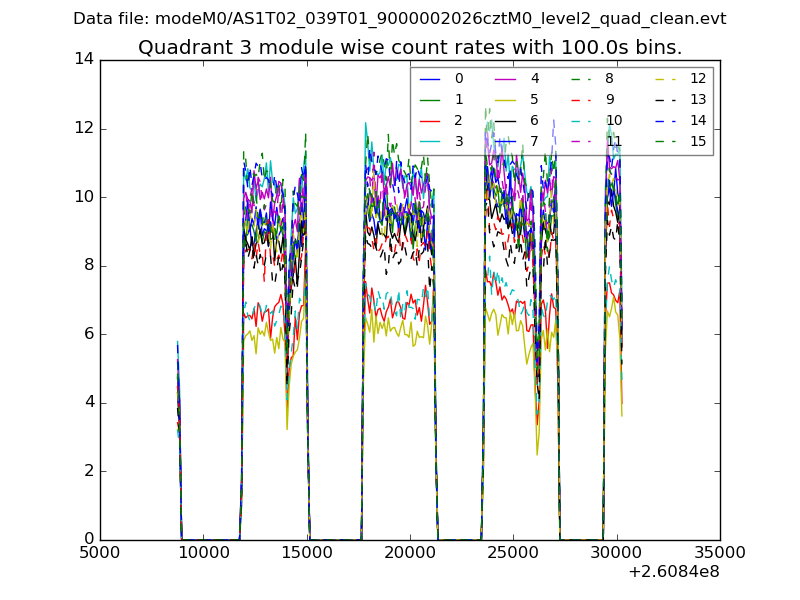
| Module-wise count rates for Quadrant A Data is divided into 100 sec bins |
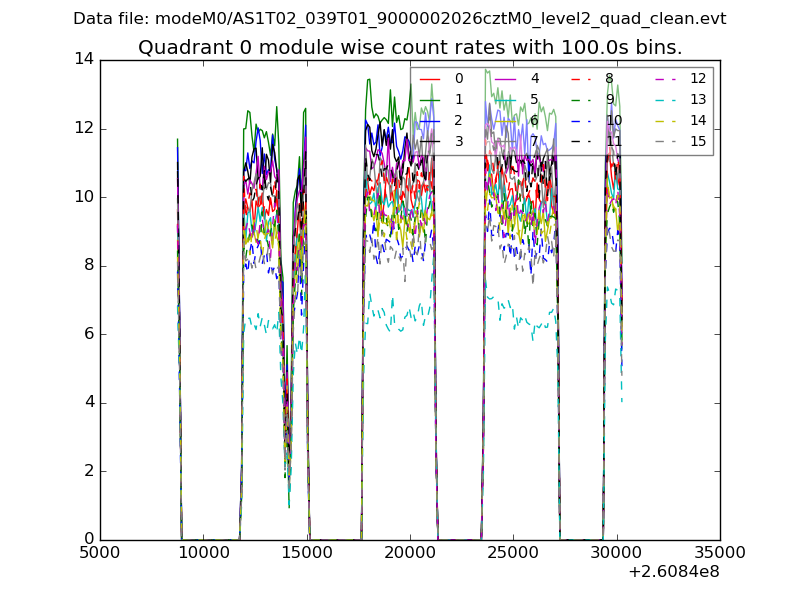 |
 |
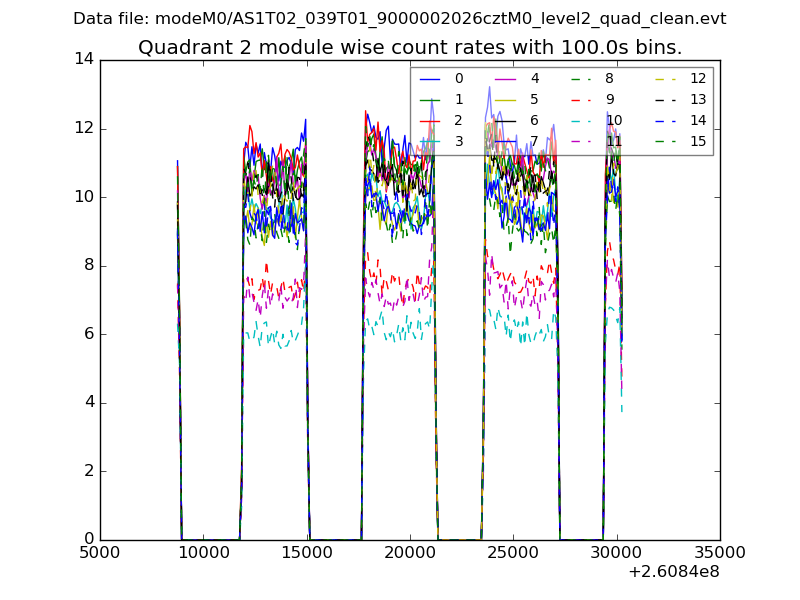
| Module-wise count rates for Quadrant B Data is divided into 100 sec bins |
 |
 |
| Module-wise count rates for Quadrant C Data is divided into 100 sec bins |
 |
 |
| Module-wise count rates for Quadrant D Data is divided into 100 sec bins |
 |
 |
| Parameter | Plot |
|---|---|
| CZT HV Monitor | 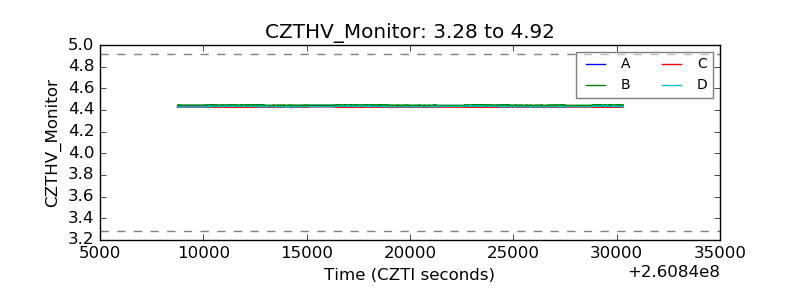 |
| D_VDD | 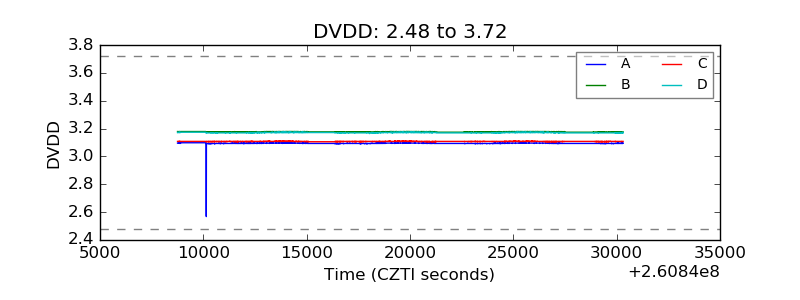 |
| Temperature 1 | 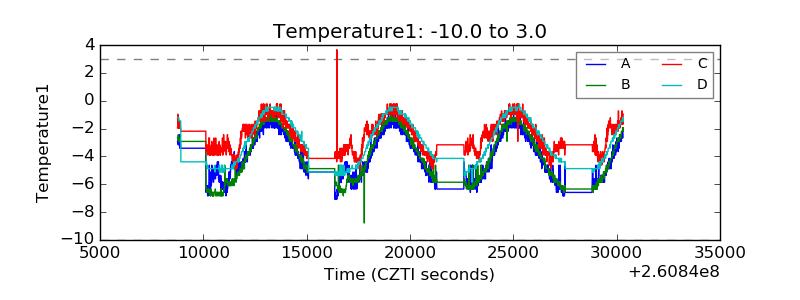 |
| Veto HV Monitor | 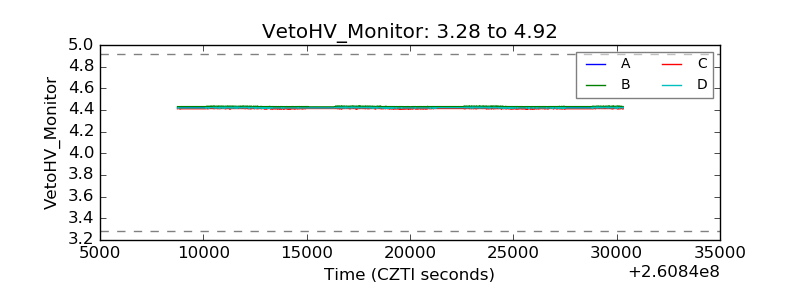 |
| Veto LLD | 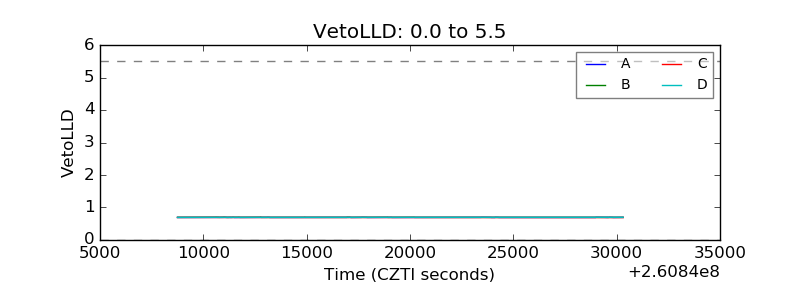 |
| Alpha Counter | 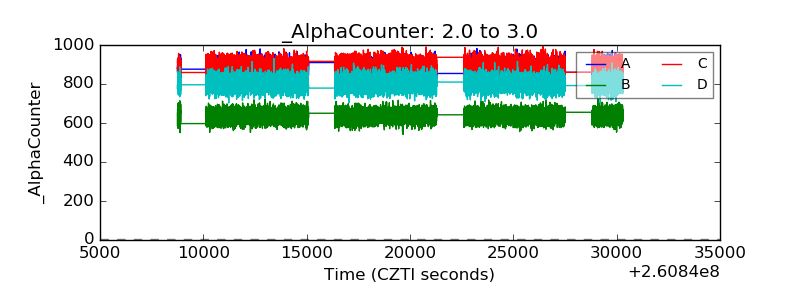 |
| _CPM_Rate | 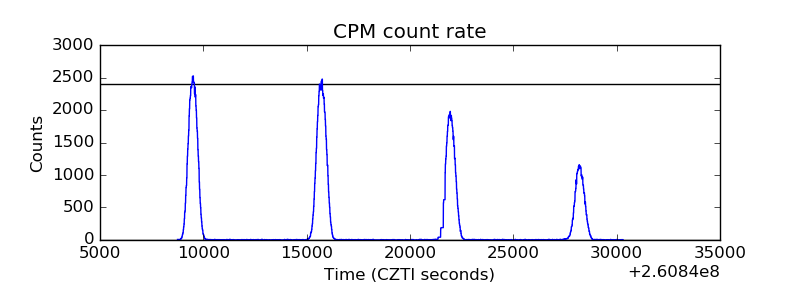 |
| CZT Counter | 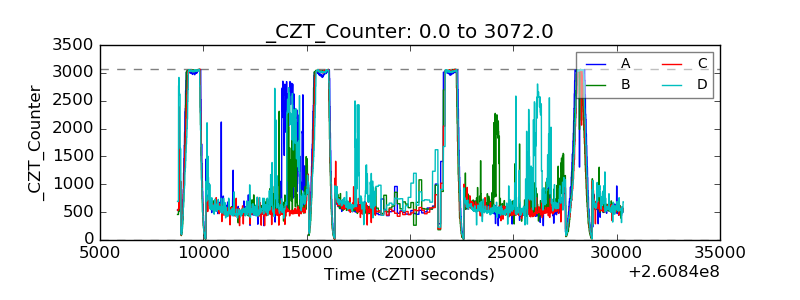 |
| +2.5 Volts monitor |  |
| +5 Volts monitor | 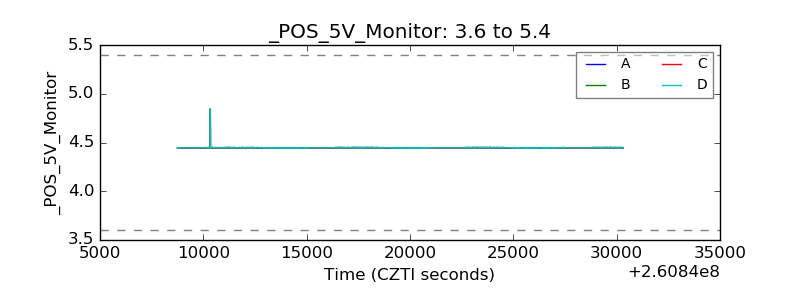 |
| _ROLL_ROT | 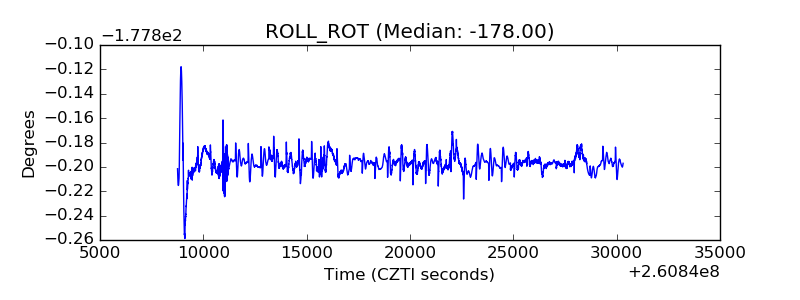 |
| _Roll_DEC | 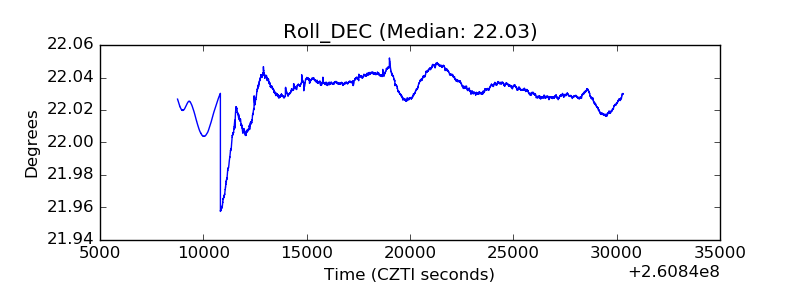 |
| _Roll_RA | 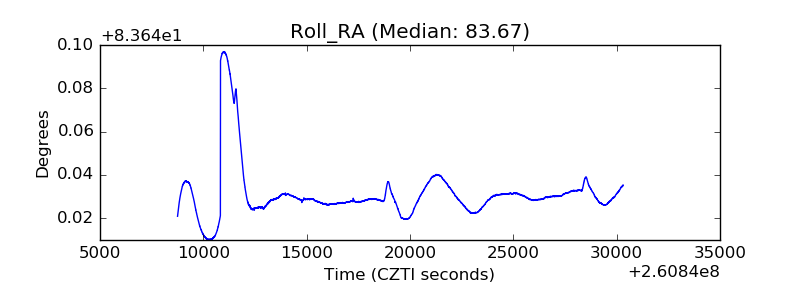 |
| Veto Counter | 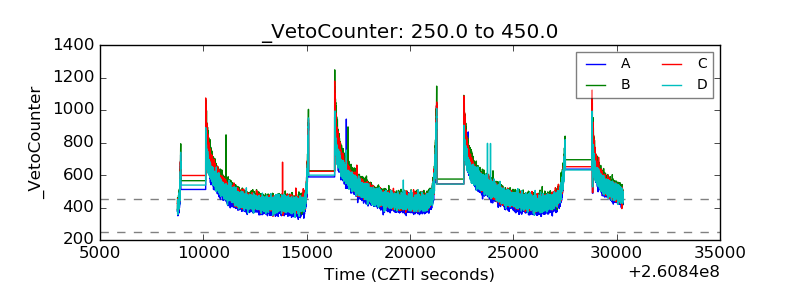 |