| Param | Original file | Final file |
|---|---|---|
| Filename | modeM0/AS1T02_039T01_9000002026_13661cztM0_level2.evt | modeM0/AS1T02_039T01_9000002026_13661cztM0_level2_quad_clean.evt |
| Size (bytes) | 137,623,680 | 6,719,040 |
| Size | 131.2 MB | 6.4 MB |
| Events in quadrant A | 982,882 | 24,201 |
| Events in quadrant B | 929,722 | 24,545 |
| Events in quadrant C | 930,014 | 24,539 |
| Events in quadrant D | 1,215,989 | 13,237 |
| Mode SS | |||
|---|---|---|---|
| Quadrant | BADHDUFLAG | Total packets | Discarded packets |
| A | 0 | 34 | 0 |
| B | 0 | 34 | 0 |
| C | 0 | 34 | 0 |
| D | 0 | 34 | 0 |
| Mode M0 | |||
|---|---|---|---|
| Quadrant | BADHDUFLAG | Total packets | Discarded packets |
| A | 0 | 3892 | 2 |
| B | 0 | 3742 | 1 |
| C | 0 | 3758 | 1 |
| D | 0 | 4566 | 1 |
| Mode M9 | |||
|---|---|---|---|
| Quadrant | BADHDUFLAG | Total packets | Discarded packets |
| A | 0 | 12 | 0 |
| B | 0 | 12 | 0 |
| C | 0 | 12 | 0 |
| D | 0 | 12 | 0 |
| Quadrant | Total seconds | Saturated seconds | Saturation percentage |
|---|---|---|---|
| A | 1569 | 50 | 3.186743% |
| B | 1569 | 45 | 2.868069% |
| C | 1569 | 25 | 1.593372% |
| D | 1569 | 154 | 9.815169% |
Noise dominated data is calculated using 1-second bins in cleaned event files. If a bin has >2000 counts, and if more than 50% of those come from <1% of pixels, then it is considered to be noise-dominated and hence unusable.
| Quadrant | # 1 sec bins | Bins with >0 counts | Bins with >2000 counts | High rate bins dominated by noise | Noise dominated (total time) | Noise dominated (detector-on time) | Marked lightcurve |
|---|---|---|---|---|---|---|---|
| A | 2775 | 1571 | 10 | 10 | 0.36% | 0.64% | 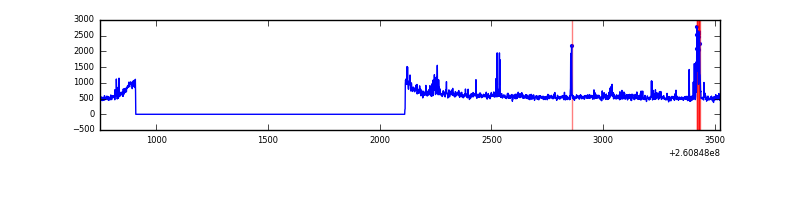 |
| B | 2775 | 1571 | 0 | 0 | 0.00% | 0.00% | 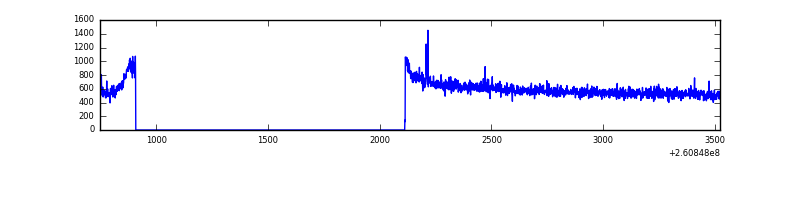 |
| C | 2775 | 1571 | 1 | 1 | 0.04% | 0.06% | 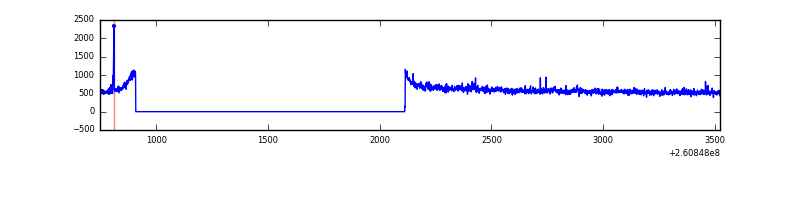 |
| D | 2775 | 1571 | 104 | 104 | 3.75% | 6.62% | 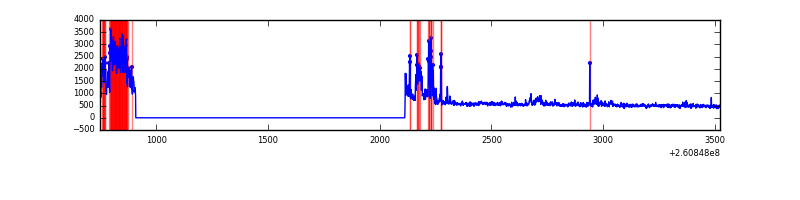 |
Top three noisy pixels from each quadrant. If the there are fewer than three noisy pixels in the level2.evt file, extra rows are filled as -1
| Pixel properties | Quadrant properties | ||||||
|---|---|---|---|---|---|---|---|
| Quadrant | DetID | PixID | Counts | Sigma | Mean | Median | Sigma |
| A | 9 | 143 | 83219 | 1730.99 | 231 | 228 | 47.9 |
| A | 15 | 69 | 5547 | 110.94 | 231 | 228 | 47.9 |
| A | 1 | 162 | 3130 | 60.53 | 231 | 228 | 47.9 |
| B | 12 | 111 | 5011 | 103.87 | 236 | 231 | 46.0 |
| B | 0 | 219 | 4409 | 90.79 | 236 | 231 | 46.0 |
| B | 11 | 111 | 4049 | 82.96 | 236 | 231 | 46.0 |
| C | 3 | 233 | 50404 | 947.98 | 223 | 225 | 52.9 |
| C | 0 | 207 | 6377 | 116.22 | 223 | 225 | 52.9 |
| C | 13 | 61 | 1706 | 27.98 | 223 | 225 | 52.9 |
| D | 13 | 122 | 195226 | 3739.35 | 209 | 202 | 52.2 |
| D | 13 | 104 | 123150 | 2357.38 | 209 | 202 | 52.2 |
| D | 5 | 222 | 51245 | 978.69 | 209 | 202 | 52.2 |
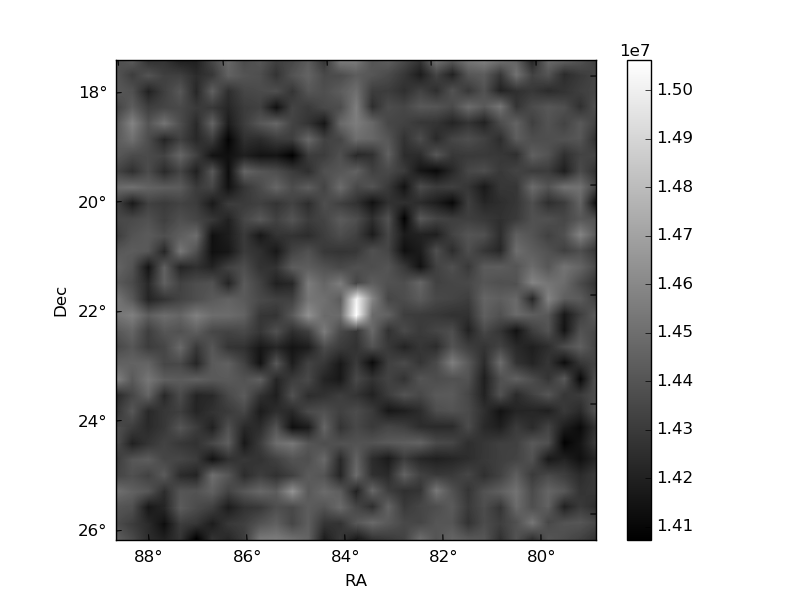
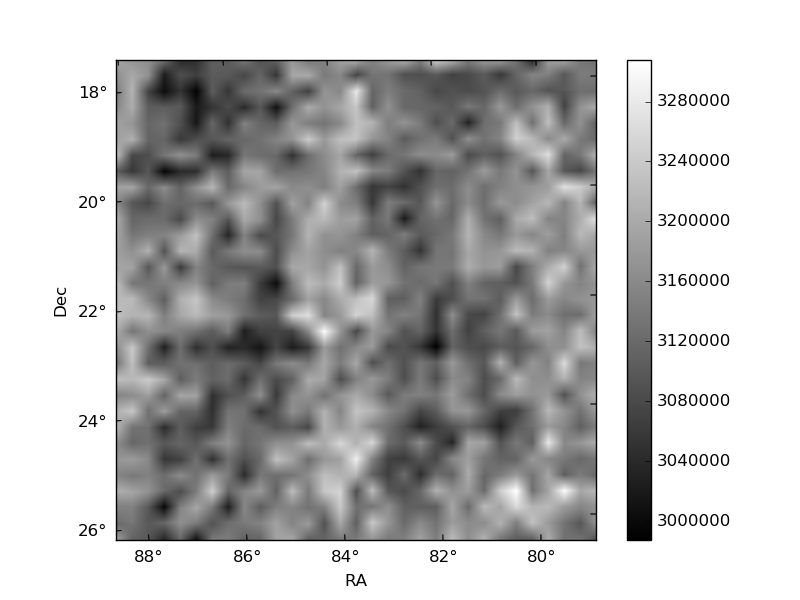
Histogram calculated using DETX and DETY for each event in the final _common_clean file
| Quadrant A | 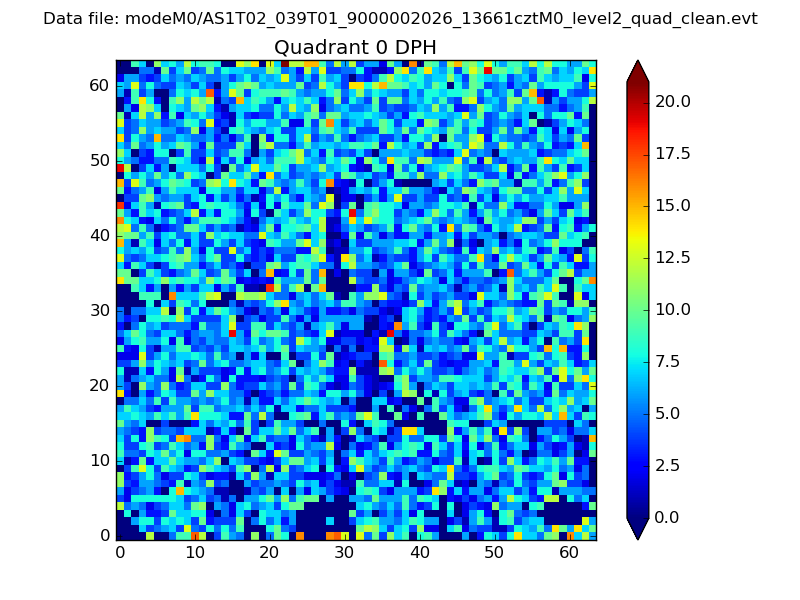 |
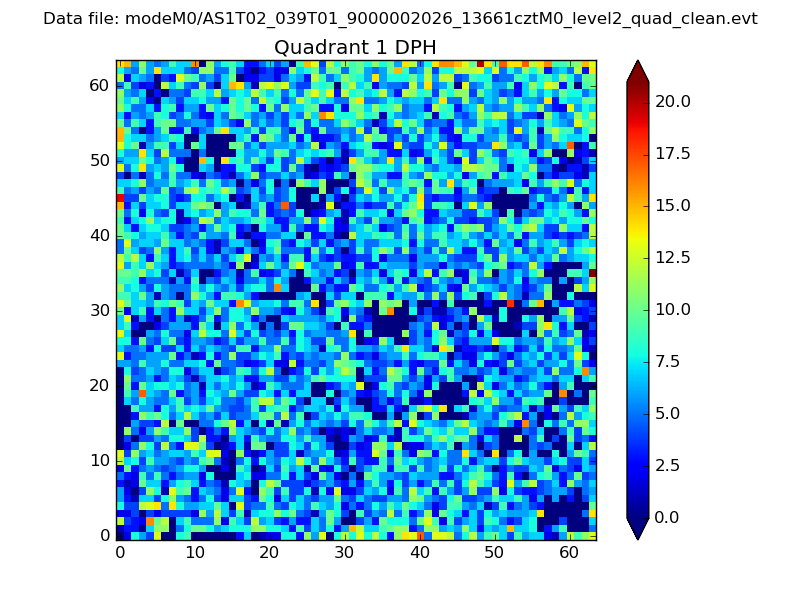 |
Quadrant B |
|---|---|---|---|
| Quadrant D | 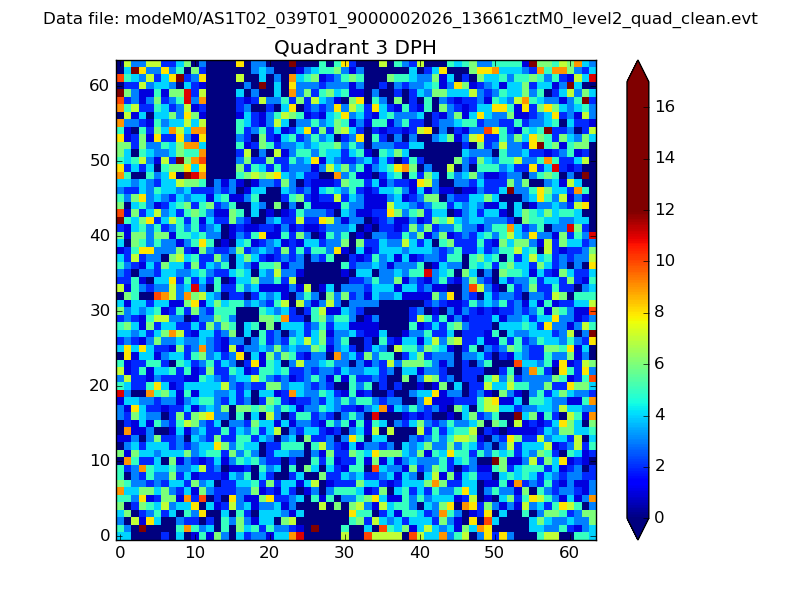 |
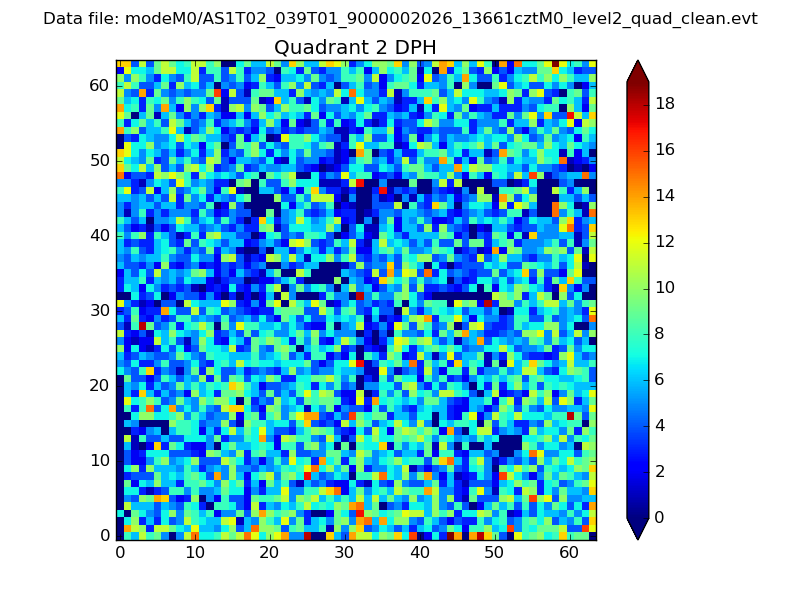 |
Quadrant C |
| Plot type | Count rate plots | Images |
|---|---|---|
| Comparison with Poisson distribution Blue bars denote a histogram of data divided into 1 sec bins. Red curve is a Poisson curve with rate = median count rate of data. |
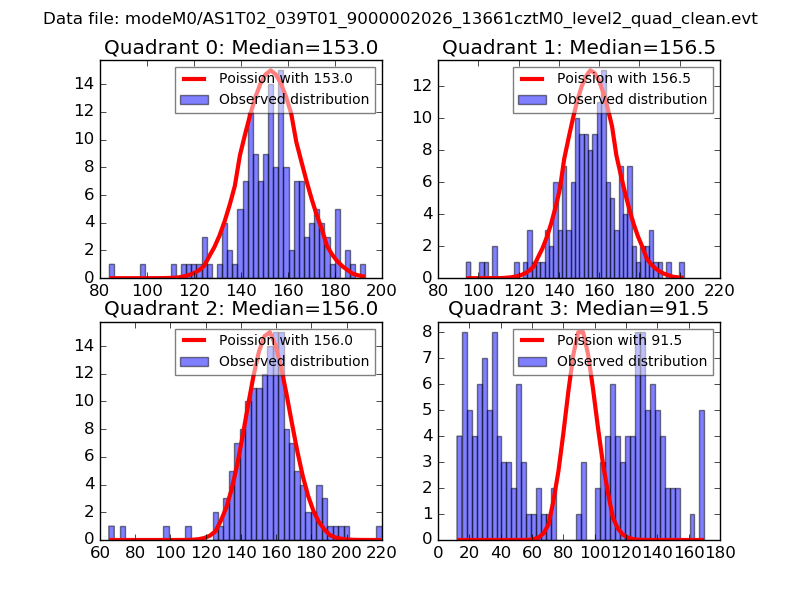 |
 |
| Quadrant-wise count rates Data is divided into 100 sec bins |
 |
|
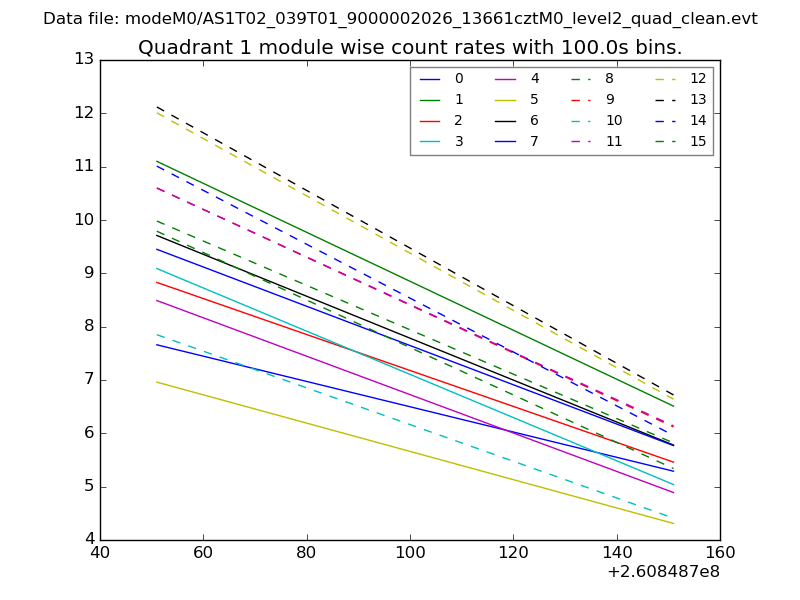
| Module-wise count rates for Quadrant A Data is divided into 100 sec bins |
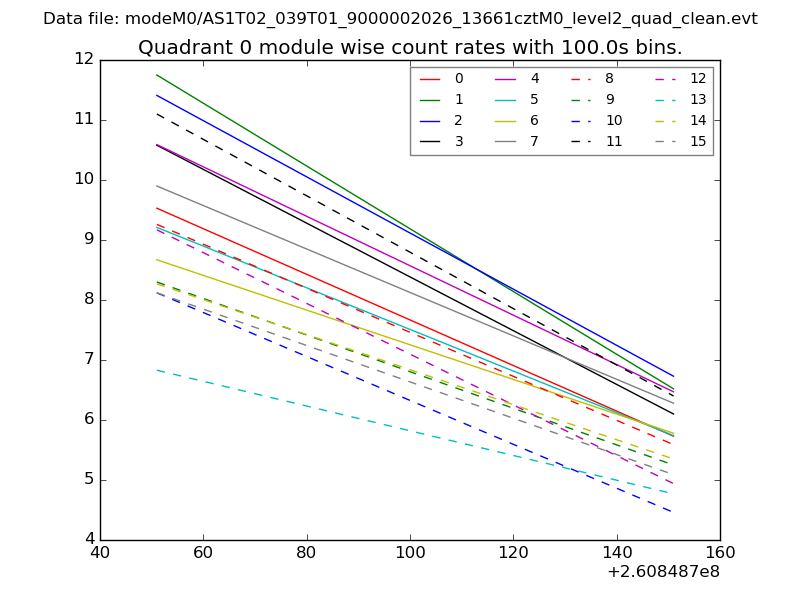 |
 |
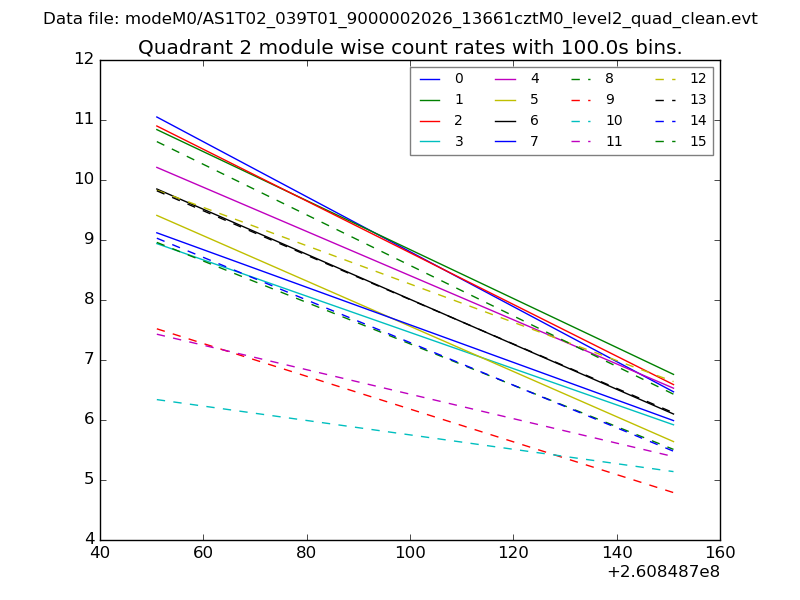
| Module-wise count rates for Quadrant B Data is divided into 100 sec bins |
 |
 |
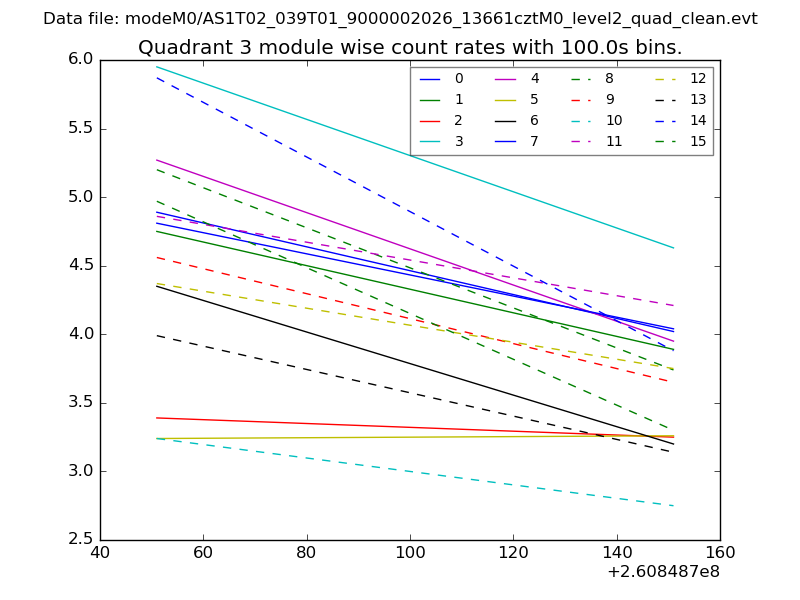
| Module-wise count rates for Quadrant C Data is divided into 100 sec bins |
 |
 |
| Module-wise count rates for Quadrant D Data is divided into 100 sec bins |
 |
 |
| Parameter | Plot |
|---|---|
| CZT HV Monitor | 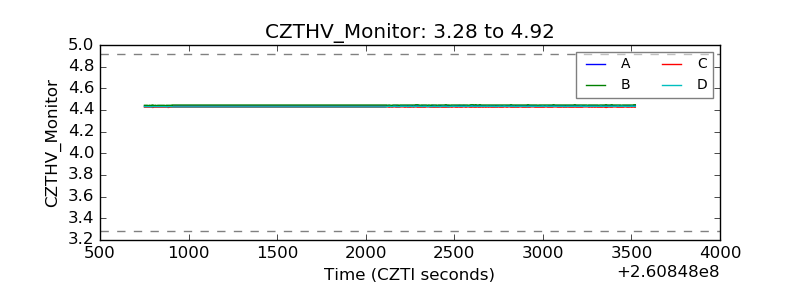 |
| D_VDD | 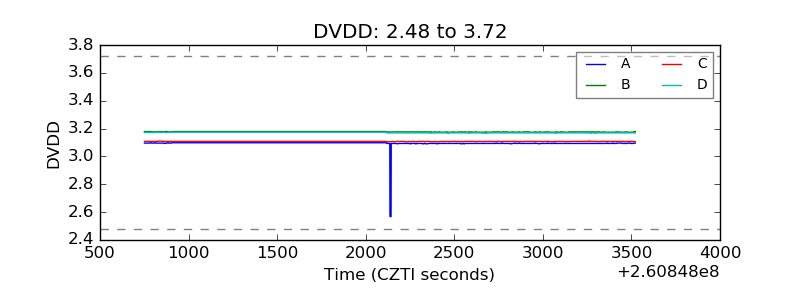 |
| Temperature 1 |  |
| Veto HV Monitor | 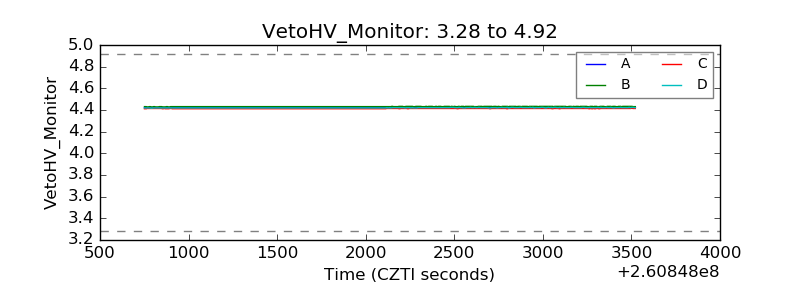 |
| Veto LLD | 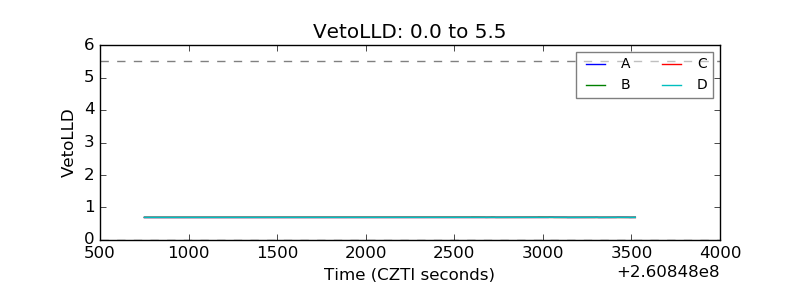 |
| Alpha Counter | 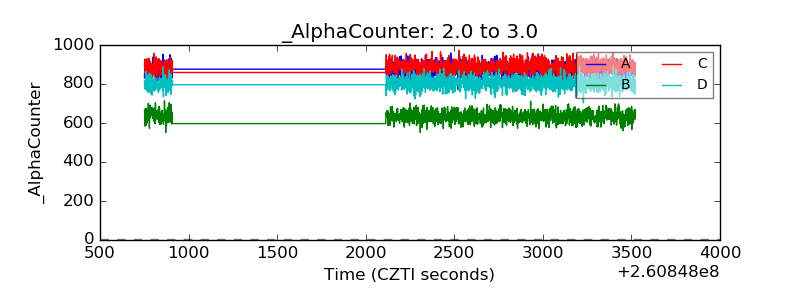 |
| _CPM_Rate | 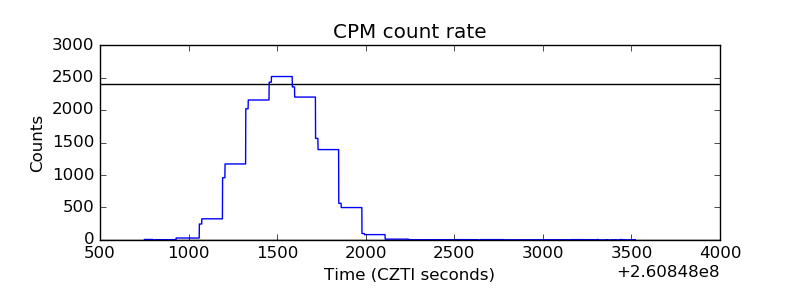 |
| CZT Counter |  |
| +2.5 Volts monitor |  |
| +5 Volts monitor |  |
| _ROLL_ROT | 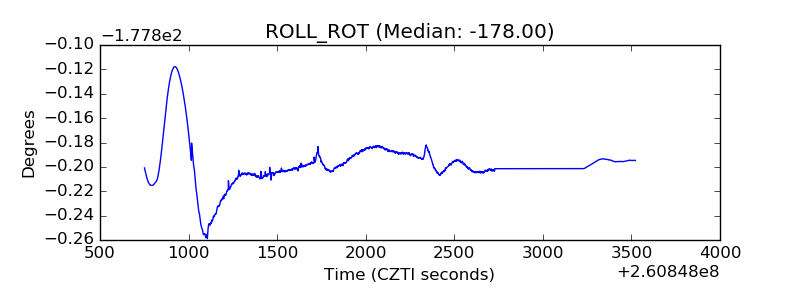 |
| _Roll_DEC | 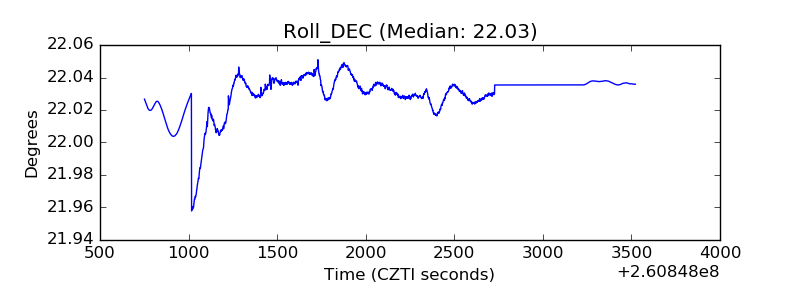 |
| _Roll_RA | 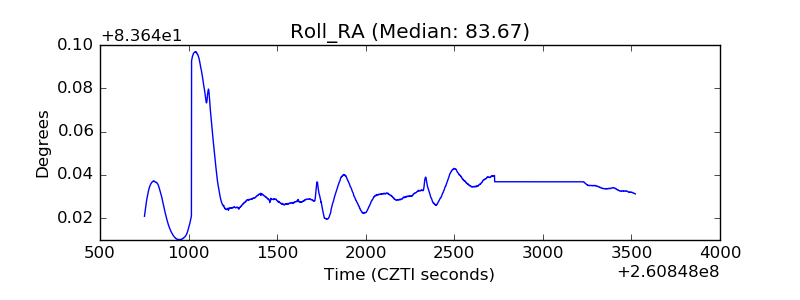 |
| Veto Counter | 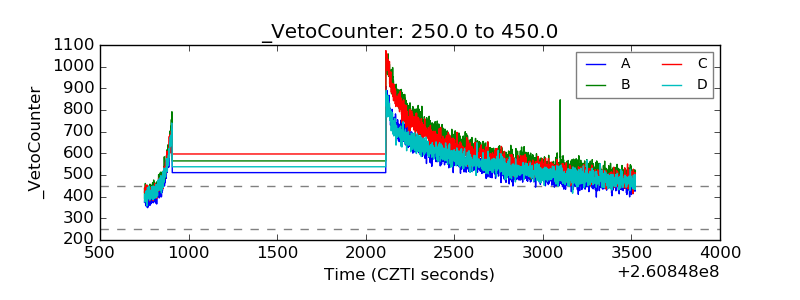 |