| Param | Original file | Final file |
|---|---|---|
| Filename | modeM0/AS1T02_039T01_9000002026_13662cztM0_level2.evt | modeM0/AS1T02_039T01_9000002026_13662cztM0_level2_quad_clean.evt |
| Size (bytes) | 598,273,920 | 74,370,240 |
| Size | 570.6 MB | 70.9 MB |
| Events in quadrant A | 5,209,258 | 418,445 |
| Events in quadrant B | 4,029,630 | 481,969 |
| Events in quadrant C | 3,483,488 | 479,866 |
| Events in quadrant D | 4,973,022 | 434,348 |
| Mode SS | |||
|---|---|---|---|
| Quadrant | BADHDUFLAG | Total packets | Discarded packets |
| A | 0 | 126 | 0 |
| B | 0 | 126 | 0 |
| C | 0 | 126 | 0 |
| D | 0 | 126 | 0 |
| Mode M0 | |||
|---|---|---|---|
| Quadrant | BADHDUFLAG | Total packets | Discarded packets |
| A | 0 | 19360 | 3 |
| B | 0 | 15989 | 2 |
| C | 0 | 14052 | 2 |
| D | 0 | 18924 | 2 |
| Mode M9 | |||
|---|---|---|---|
| Quadrant | BADHDUFLAG | Total packets | Discarded packets |
| A | 0 | 20 | 0 |
| B | 0 | 20 | 0 |
| C | 0 | 20 | 0 |
| D | 0 | 21 | 0 |
| Quadrant | Total seconds | Saturated seconds | Saturation percentage |
|---|---|---|---|
| A | 6263 | 718 | 11.464155% |
| B | 6263 | 233 | 3.720262% |
| C | 6263 | 65 | 1.037841% |
| D | 6263 | 437 | 6.977487% |
Noise dominated data is calculated using 1-second bins in cleaned event files. If a bin has >2000 counts, and if more than 50% of those come from <1% of pixels, then it is considered to be noise-dominated and hence unusable.
| Quadrant | # 1 sec bins | Bins with >0 counts | Bins with >2000 counts | High rate bins dominated by noise | Noise dominated (total time) | Noise dominated (detector-on time) | Marked lightcurve |
|---|---|---|---|---|---|---|---|
| A | 7529 | 6265 | 595 | 595 | 7.90% | 9.50% | 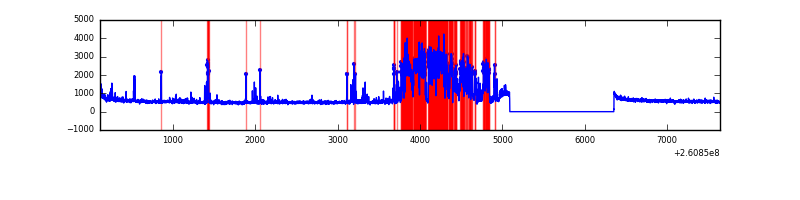 |
| B | 7529 | 6265 | 39 | 39 | 0.52% | 0.62% | 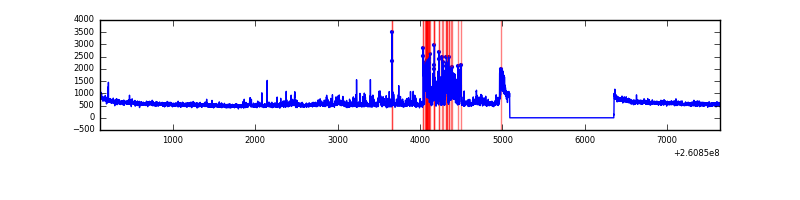 |
| C | 7529 | 6265 | 0 | 0 | 0.00% | 0.00% | 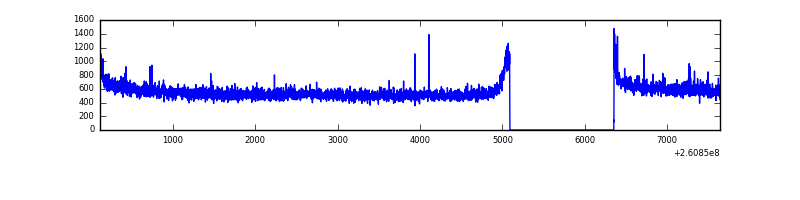 |
| D | 7529 | 6265 | 401 | 401 | 5.33% | 6.40% | 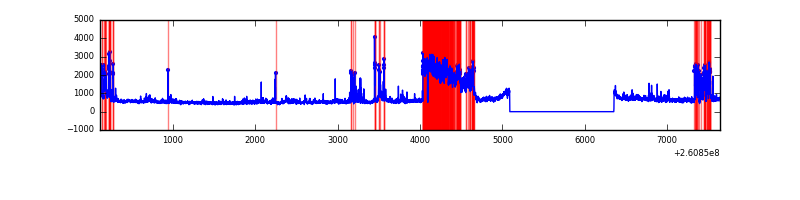 |
Top three noisy pixels from each quadrant. If the there are fewer than three noisy pixels in the level2.evt file, extra rows are filled as -1
| Pixel properties | Quadrant properties | ||||||
|---|---|---|---|---|---|---|---|
| Quadrant | DetID | PixID | Counts | Sigma | Mean | Median | Sigma |
| A | 9 | 143 | 1975927 | 11751.4 | 832 | 819 | 168.1 |
| A | 1 | 162 | 15807 | 89.17 | 832 | 819 | 168.1 |
| A | 15 | 69 | 10516 | 57.69 | 832 | 819 | 168.1 |
| B | 0 | 219 | 357778 | 2193.89 | 874 | 859 | 162.7 |
| B | 4 | 142 | 128372 | 783.79 | 874 | 859 | 162.7 |
| B | 0 | 189 | 68323 | 414.68 | 874 | 859 | 162.7 |
| C | 3 | 233 | 212376 | 1101.71 | 837 | 846 | 192.0 |
| C | 13 | 61 | 6260 | 28.2 | 837 | 846 | 192.0 |
| C | 0 | 207 | 3840 | 15.59 | 837 | 846 | 192.0 |
| D | 5 | 222 | 1420067 | 7277.31 | 821 | 803 | 195.0 |
| D | 8 | 195 | 125930 | 641.59 | 821 | 803 | 195.0 |
| D | 13 | 104 | 104212 | 530.23 | 821 | 803 | 195.0 |
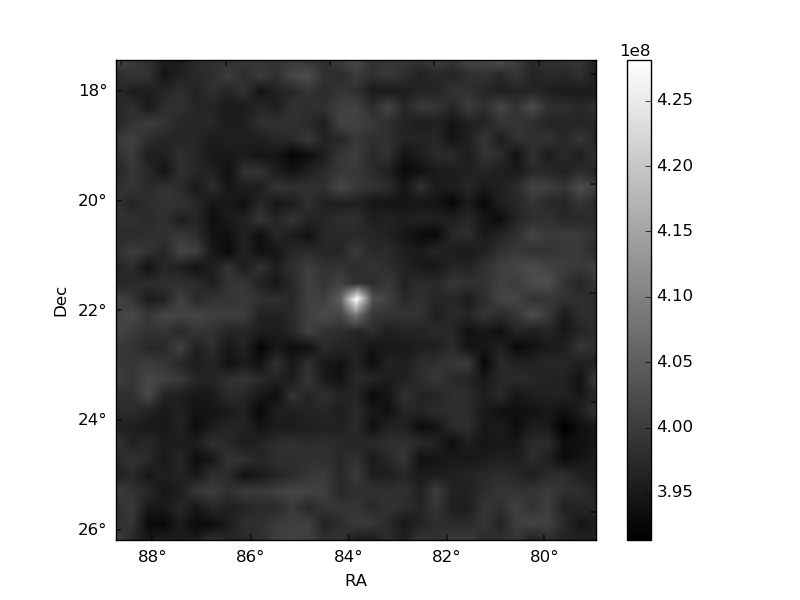
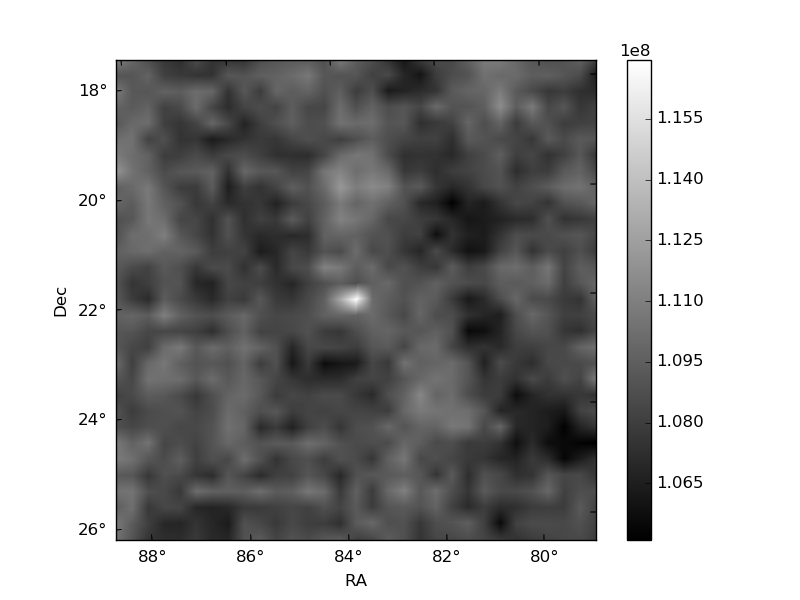
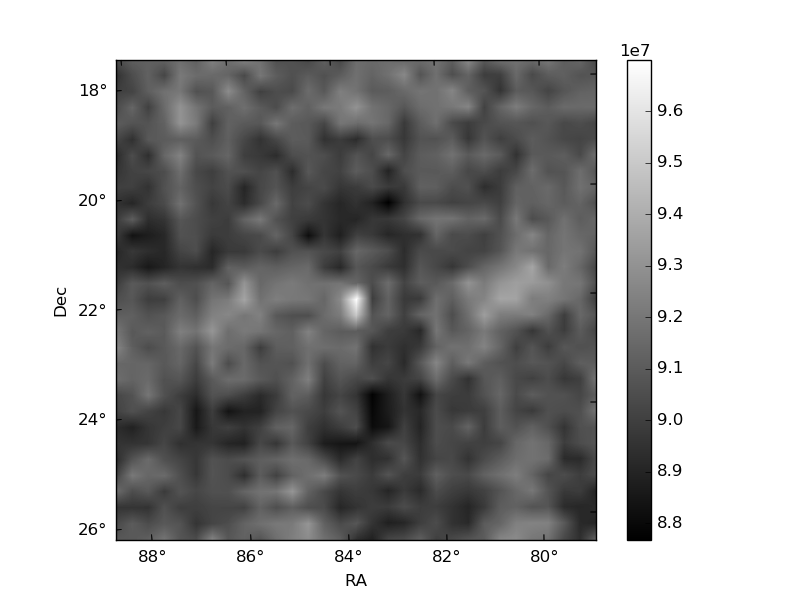
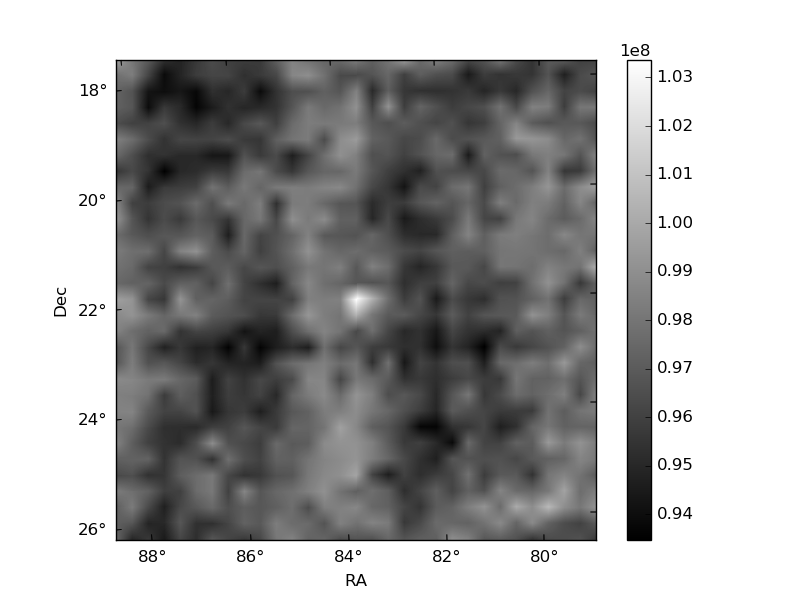
Histogram calculated using DETX and DETY for each event in the final _common_clean file
| Quadrant A | 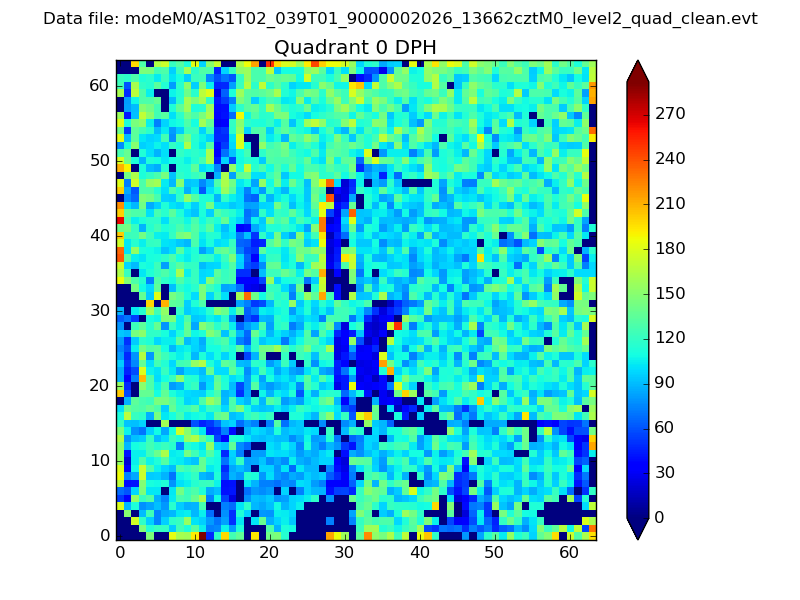 |
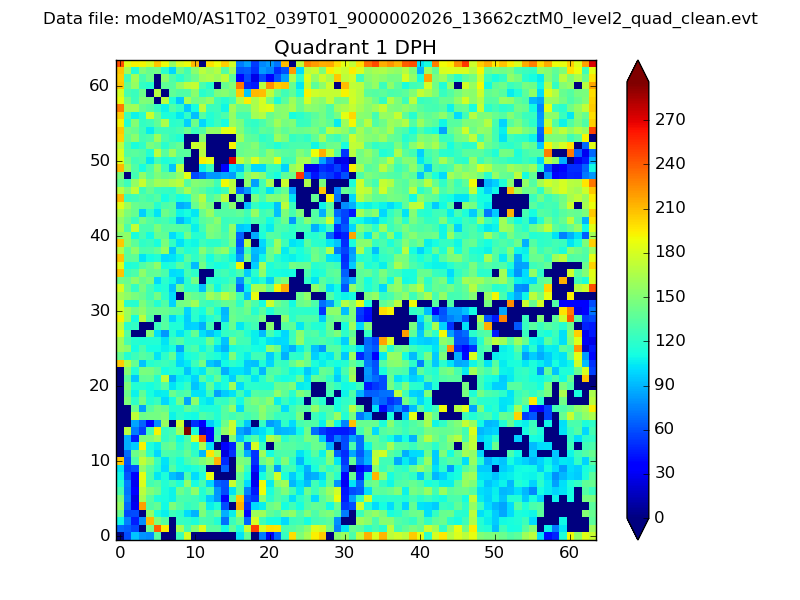 |
Quadrant B |
|---|---|---|---|
| Quadrant D | 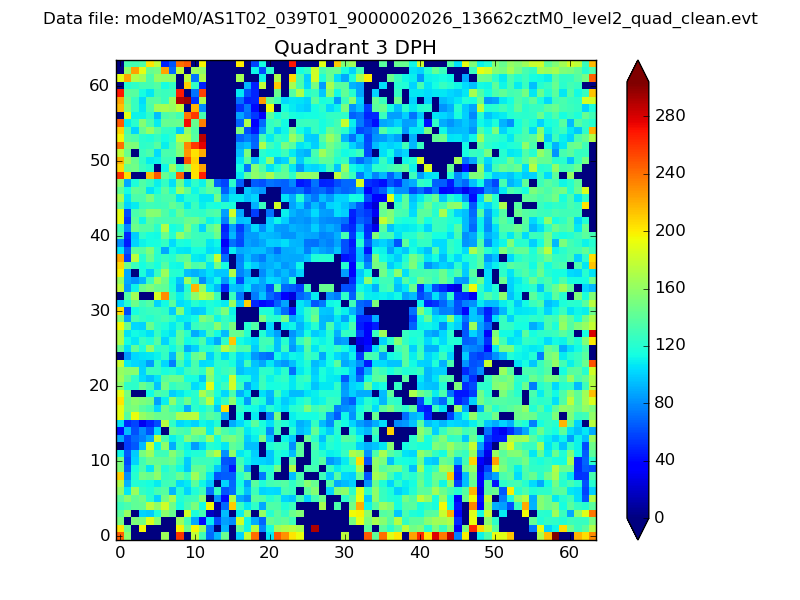 |
 |
Quadrant C |
| Plot type | Count rate plots | Images |
|---|---|---|
| Comparison with Poisson distribution Blue bars denote a histogram of data divided into 1 sec bins. Red curve is a Poisson curve with rate = median count rate of data. |
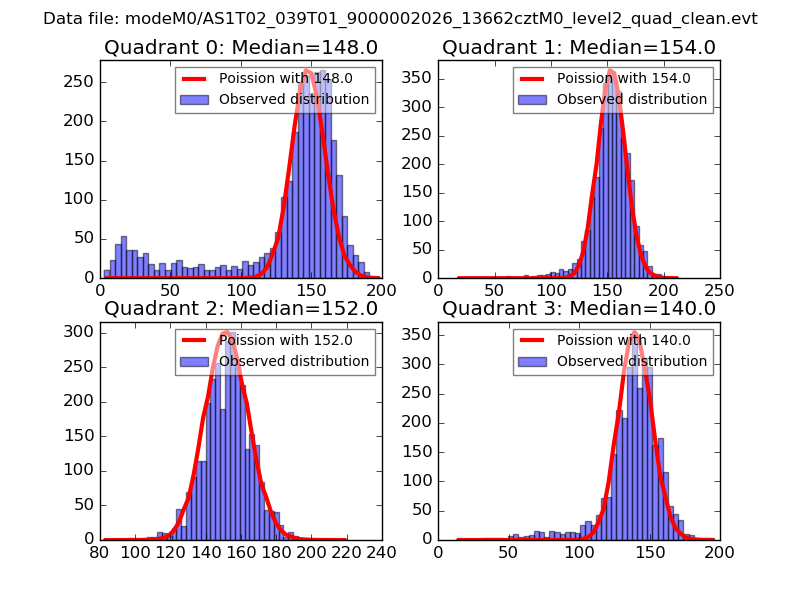 |
 |
| Quadrant-wise count rates Data is divided into 100 sec bins |
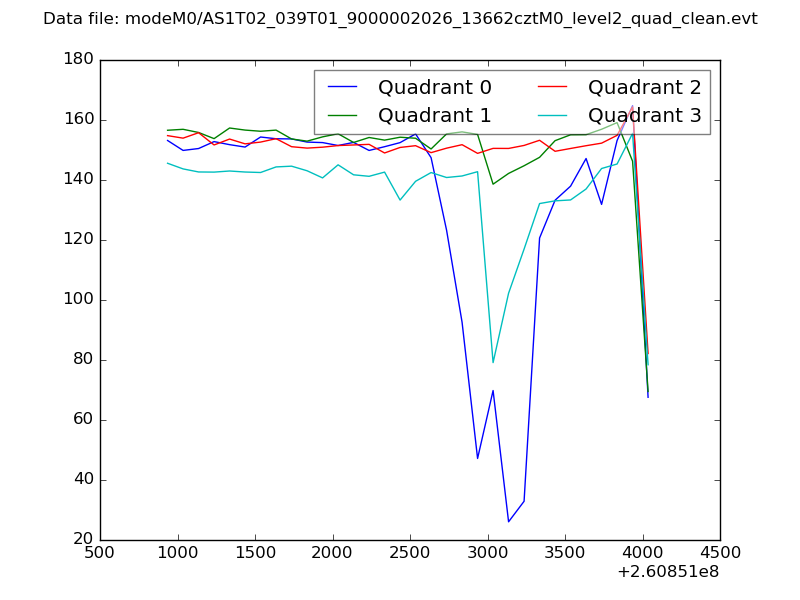 |
|
| Module-wise count rates for Quadrant A Data is divided into 100 sec bins |
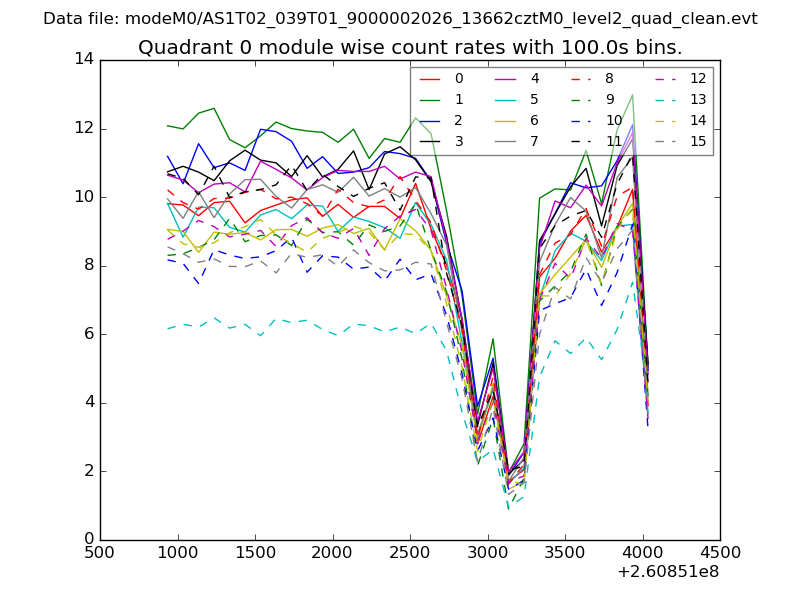 |
 |
| Module-wise count rates for Quadrant B Data is divided into 100 sec bins |
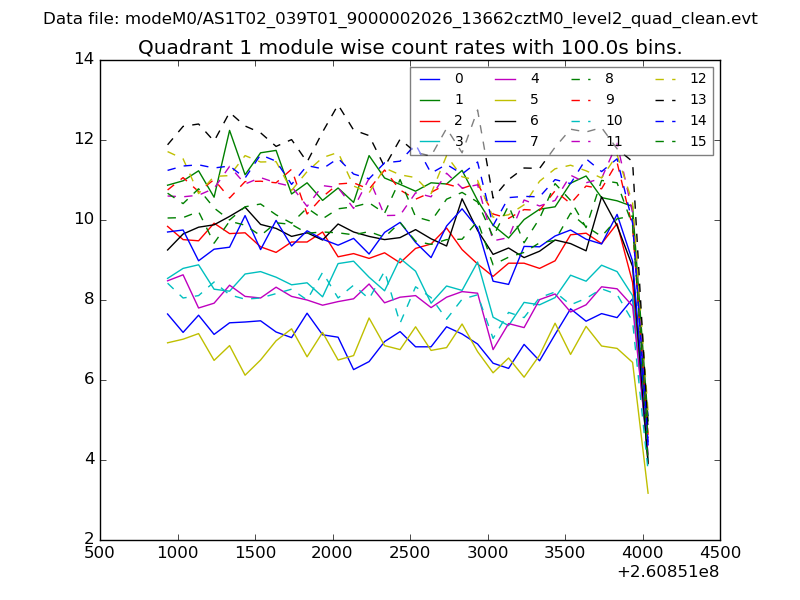 |
 |
| Module-wise count rates for Quadrant C Data is divided into 100 sec bins |
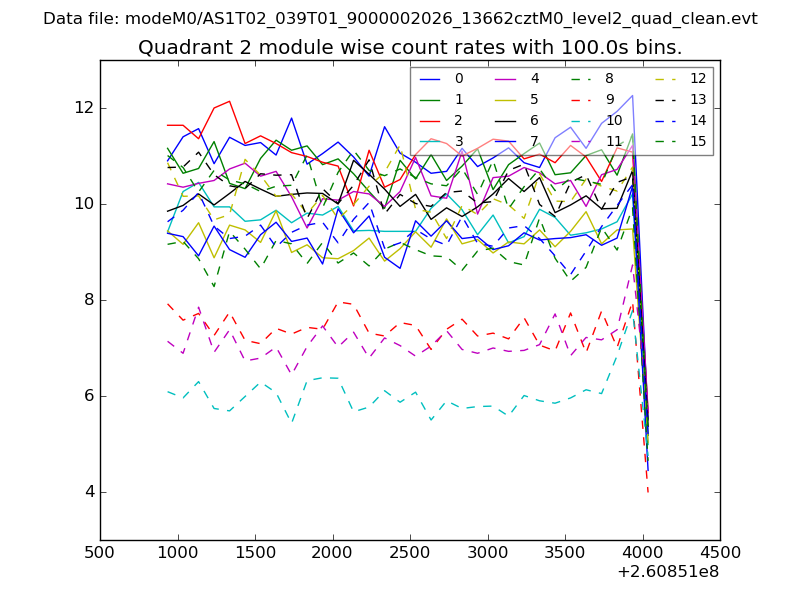 |
 |
| Module-wise count rates for Quadrant D Data is divided into 100 sec bins |
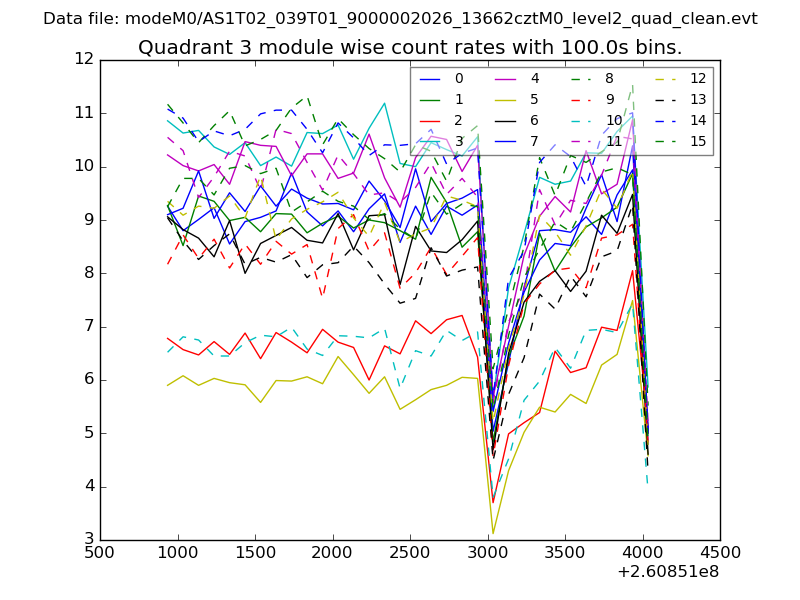 |
 |
| Parameter | Plot |
|---|---|
| CZT HV Monitor | 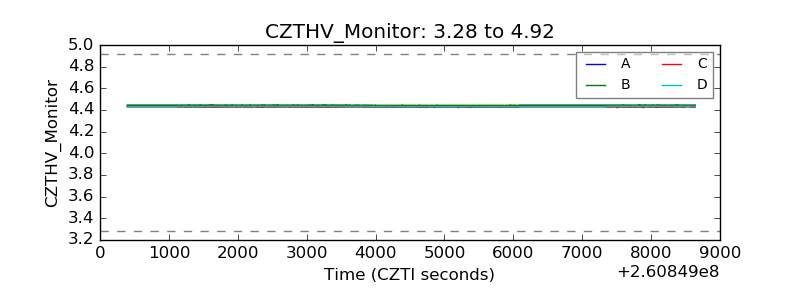 |
| D_VDD | 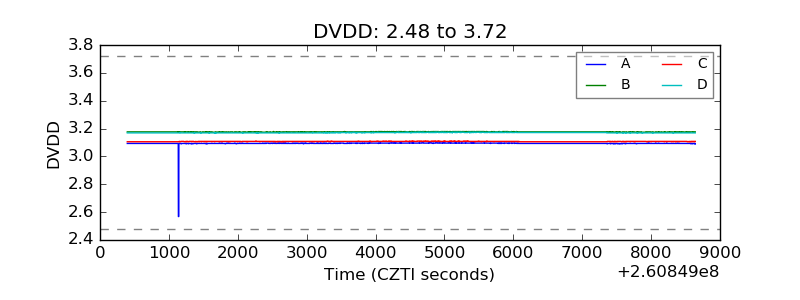 |
| Temperature 1 | 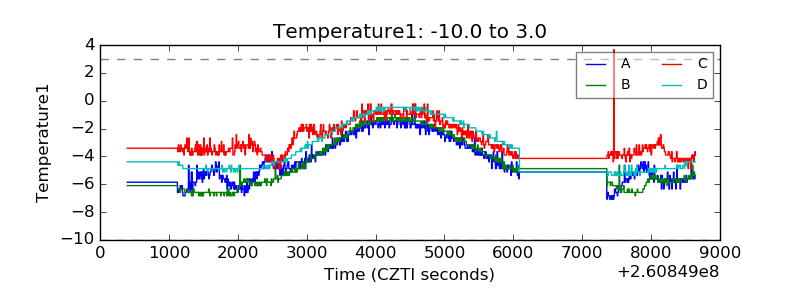 |
| Veto HV Monitor | 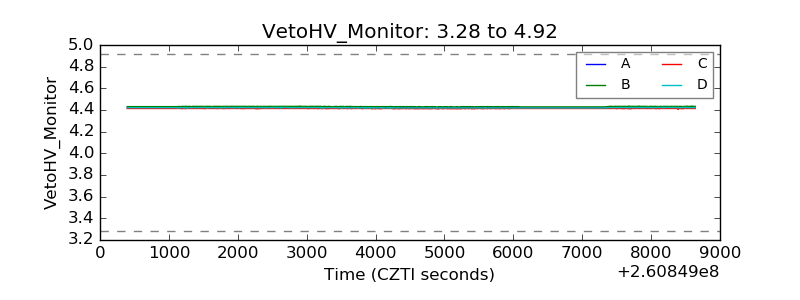 |
| Veto LLD | 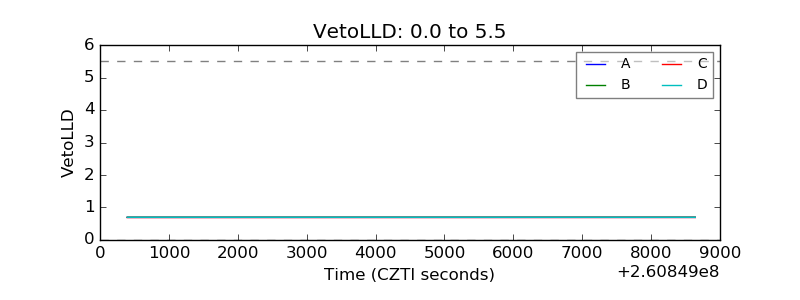 |
| Alpha Counter | 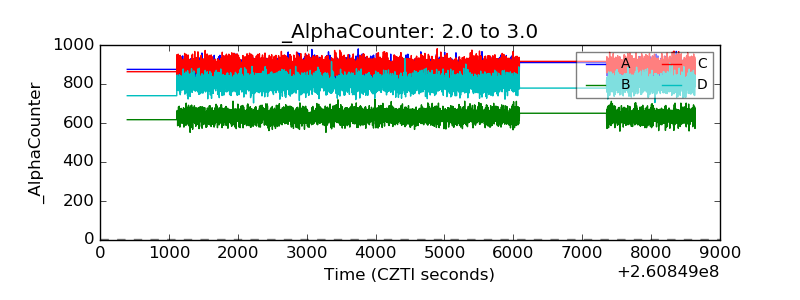 |
| _CPM_Rate | 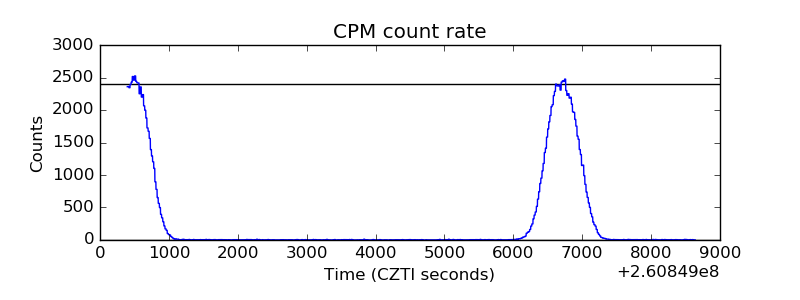 |
| CZT Counter |  |
| +2.5 Volts monitor |  |
| +5 Volts monitor |  |
| _ROLL_ROT | 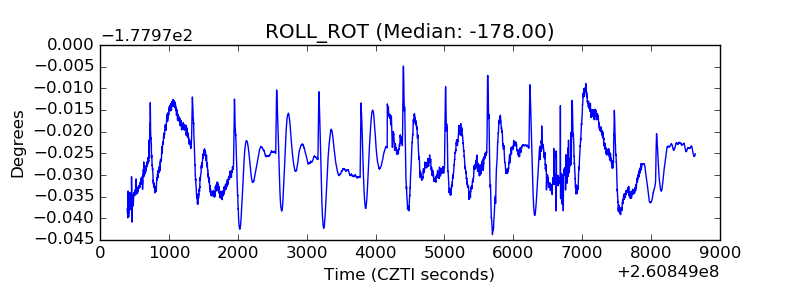 |
| _Roll_DEC | 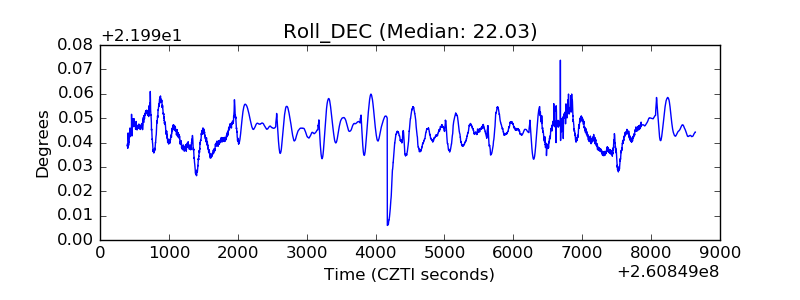 |
| _Roll_RA | 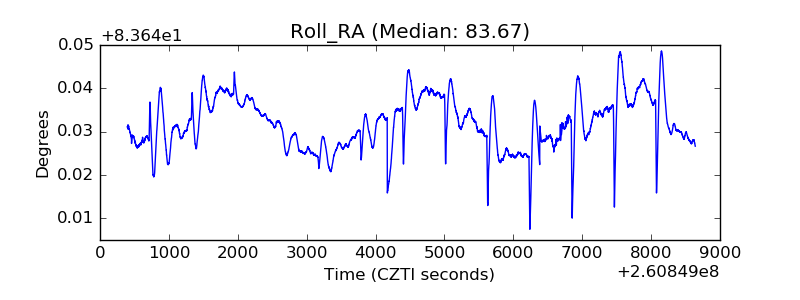 |
| Veto Counter | 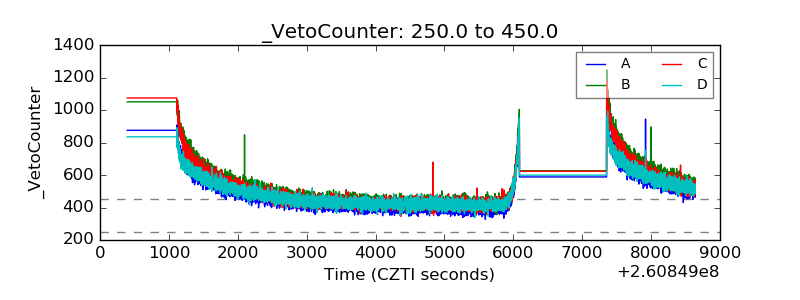 |