| Param | Original file | Final file |
|---|---|---|
| Filename | modeM0/AS1T02_039T01_9000002026_13663cztM0_level2.evt | modeM0/AS1T02_039T01_9000002026_13663cztM0_level2_quad_clean.evt |
| Size (bytes) | 529,770,240 | 92,833,920 |
| Size | 505.2 MB | 88.5 MB |
| Events in quadrant A | 3,423,427 | 611,179 |
| Events in quadrant B | 4,116,157 | 613,480 |
| Events in quadrant C | 3,497,666 | 600,315 |
| Events in quadrant D | 4,592,810 | 559,413 |
| Mode SS | |||
|---|---|---|---|
| Quadrant | BADHDUFLAG | Total packets | Discarded packets |
| A | 0 | 124 | 0 |
| B | 0 | 124 | 0 |
| C | 0 | 124 | 0 |
| D | 0 | 124 | 0 |
| Mode M0 | |||
|---|---|---|---|
| Quadrant | BADHDUFLAG | Total packets | Discarded packets |
| A | 0 | 13736 | 2 |
| B | 0 | 16381 | 1 |
| C | 0 | 14086 | 1 |
| D | 0 | 18053 | 1 |
| Mode M9 | |||
|---|---|---|---|
| Quadrant | BADHDUFLAG | Total packets | Discarded packets |
| A | 0 | 14 | 0 |
| B | 0 | 14 | 0 |
| C | 0 | 14 | 0 |
| D | 0 | 14 | 0 |
| Quadrant | Total seconds | Saturated seconds | Saturation percentage |
|---|---|---|---|
| A | 6115 | 119 | 1.946034% |
| B | 6115 | 192 | 3.139820% |
| C | 6115 | 90 | 1.471791% |
| D | 6115 | 217 | 3.548651% |
Noise dominated data is calculated using 1-second bins in cleaned event files. If a bin has >2000 counts, and if more than 50% of those come from <1% of pixels, then it is considered to be noise-dominated and hence unusable.
| Quadrant | # 1 sec bins | Bins with >0 counts | Bins with >2000 counts | High rate bins dominated by noise | Noise dominated (total time) | Noise dominated (detector-on time) | Marked lightcurve |
|---|---|---|---|---|---|---|---|
| A | 7426 | 6117 | 0 | 0 | 0.00% | 0.00% | 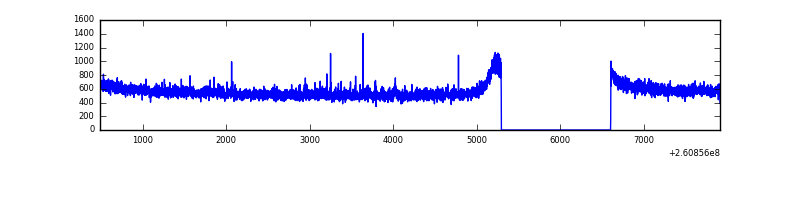 |
| B | 7426 | 6117 | 53 | 53 | 0.71% | 0.87% | 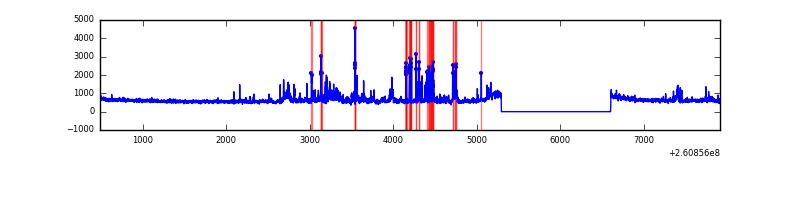 |
| C | 7426 | 6117 | 0 | 0 | 0.00% | 0.00% | 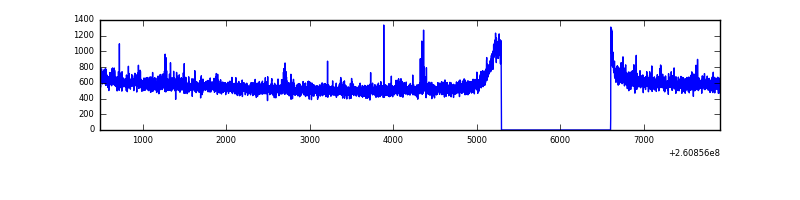 |
| D | 7426 | 6117 | 54 | 54 | 0.73% | 0.88% | 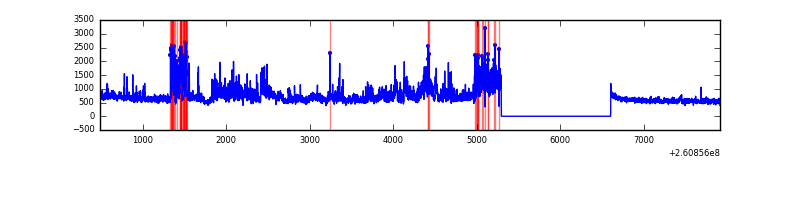 |
Top three noisy pixels from each quadrant. If the there are fewer than three noisy pixels in the level2.evt file, extra rows are filled as -1
| Pixel properties | Quadrant properties | ||||||
|---|---|---|---|---|---|---|---|
| Quadrant | DetID | PixID | Counts | Sigma | Mean | Median | Sigma |
| A | 1 | 162 | 17691 | 95.2 | 879 | 868 | 176.7 |
| A | 0 | 226 | 7724 | 38.8 | 879 | 868 | 176.7 |
| A | 9 | 143 | 7263 | 36.19 | 879 | 868 | 176.7 |
| B | 0 | 219 | 206122 | 1262.39 | 874 | 859 | 162.6 |
| B | 0 | 229 | 195388 | 1196.37 | 874 | 859 | 162.6 |
| B | 0 | 189 | 103443 | 630.9 | 874 | 859 | 162.6 |
| C | 3 | 233 | 240043 | 1252.82 | 833 | 842 | 190.9 |
| C | 13 | 61 | 6051 | 27.28 | 833 | 842 | 190.9 |
| C | 14 | 234 | 4579 | 19.57 | 833 | 842 | 190.9 |
| D | 5 | 222 | 1395637 | 7145.48 | 824 | 807 | 195.2 |
| D | 2 | 234 | 24265 | 120.17 | 824 | 807 | 195.2 |
| D | 8 | 195 | 22912 | 113.24 | 824 | 807 | 195.2 |
Histogram calculated using DETX and DETY for each event in the final _common_clean file
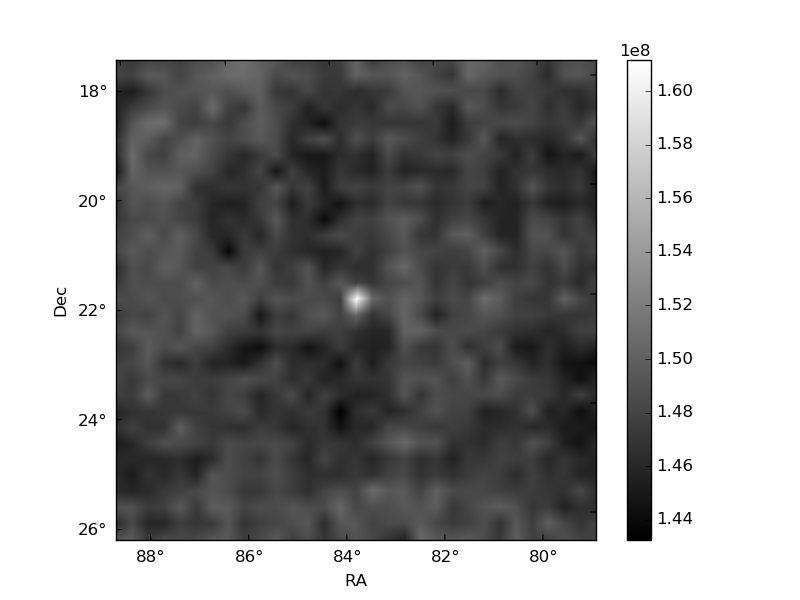
| Quadrant A |  |
 |
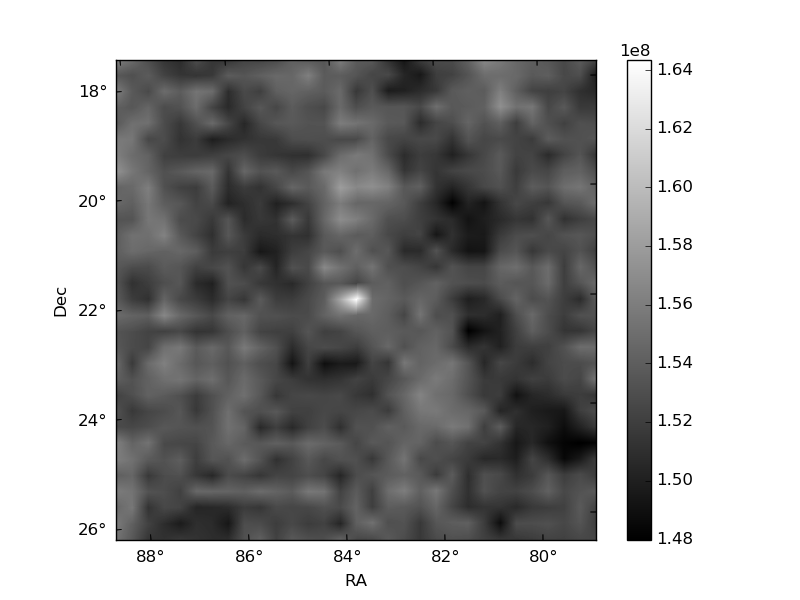
Quadrant B |
|---|---|---|---|
| Quadrant D |  |
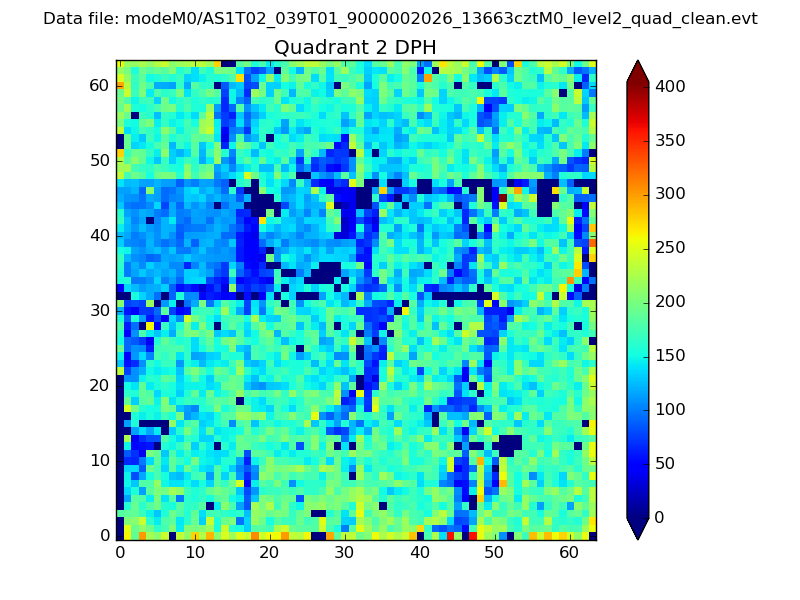 |
Quadrant C |
| Plot type | Count rate plots | Images |
|---|---|---|
| Comparison with Poisson distribution Blue bars denote a histogram of data divided into 1 sec bins. Red curve is a Poisson curve with rate = median count rate of data. |
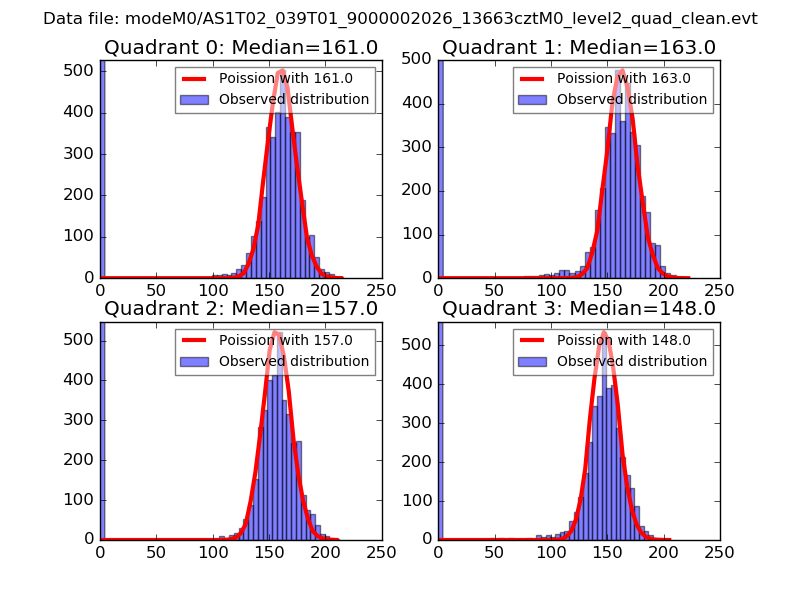 |
 |
| Quadrant-wise count rates Data is divided into 100 sec bins |
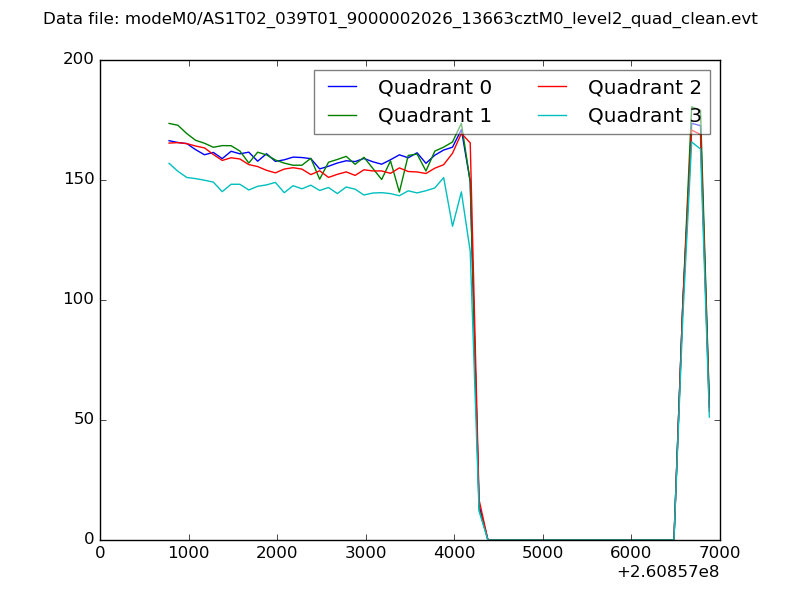 |
|
| Module-wise count rates for Quadrant A Data is divided into 100 sec bins |
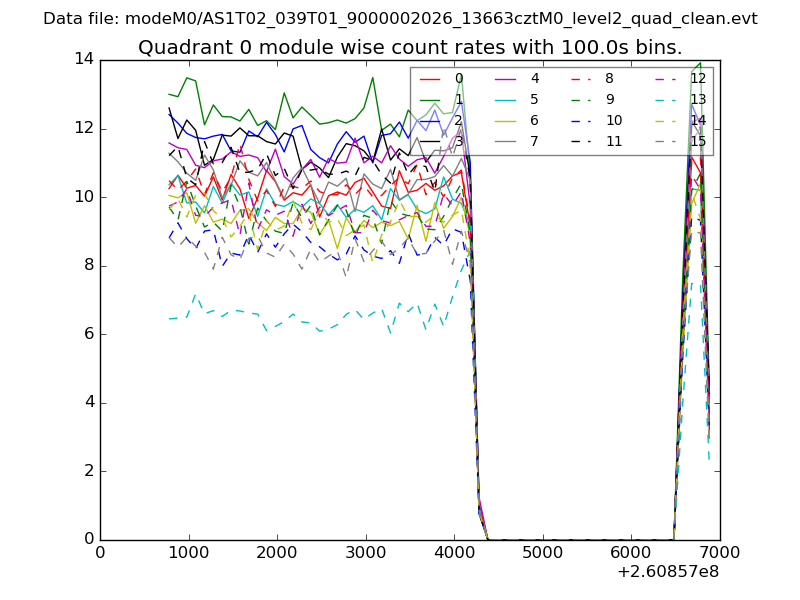 |
 |
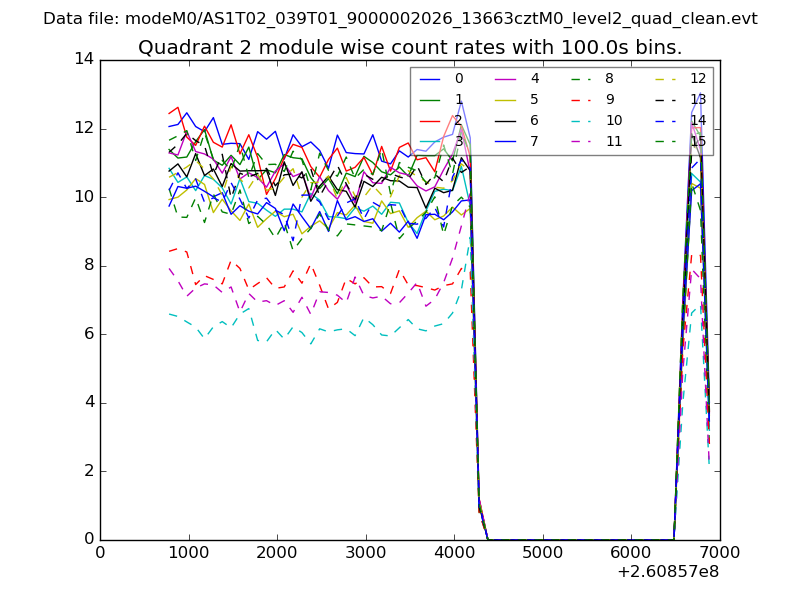
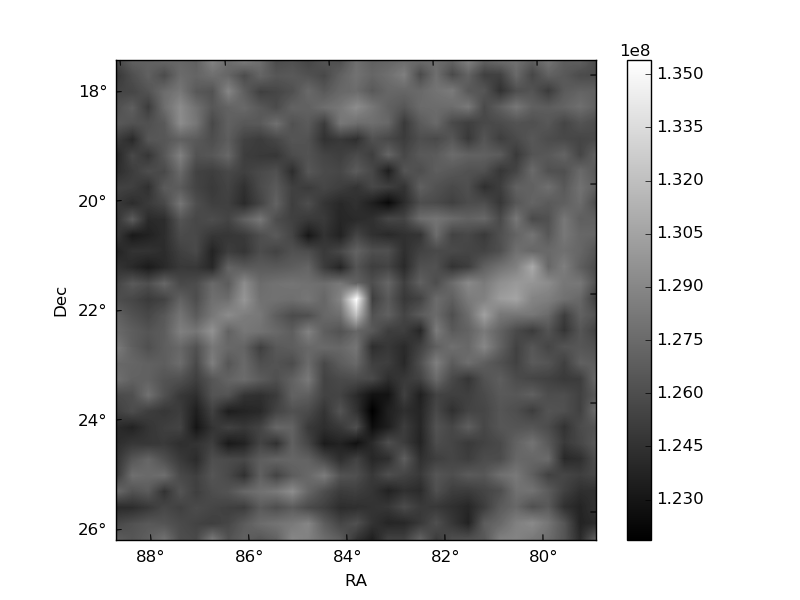
| Module-wise count rates for Quadrant B Data is divided into 100 sec bins |
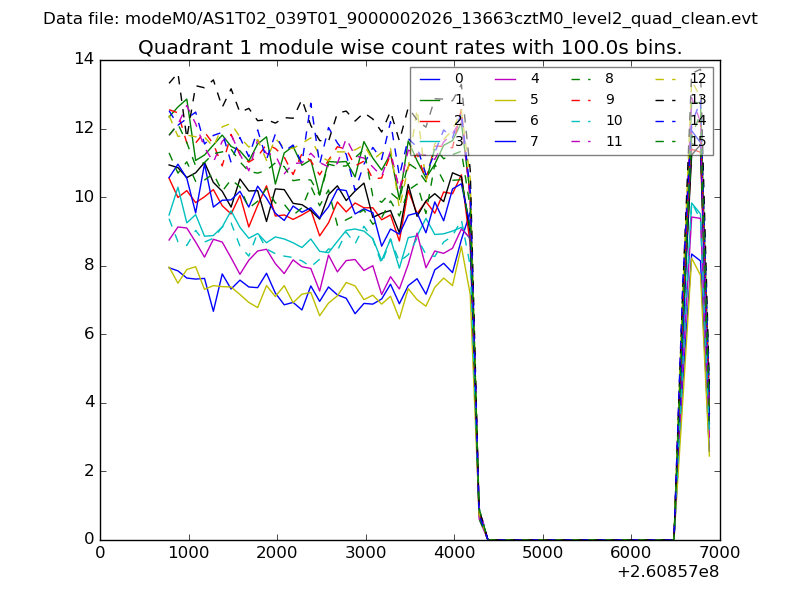 |
 |
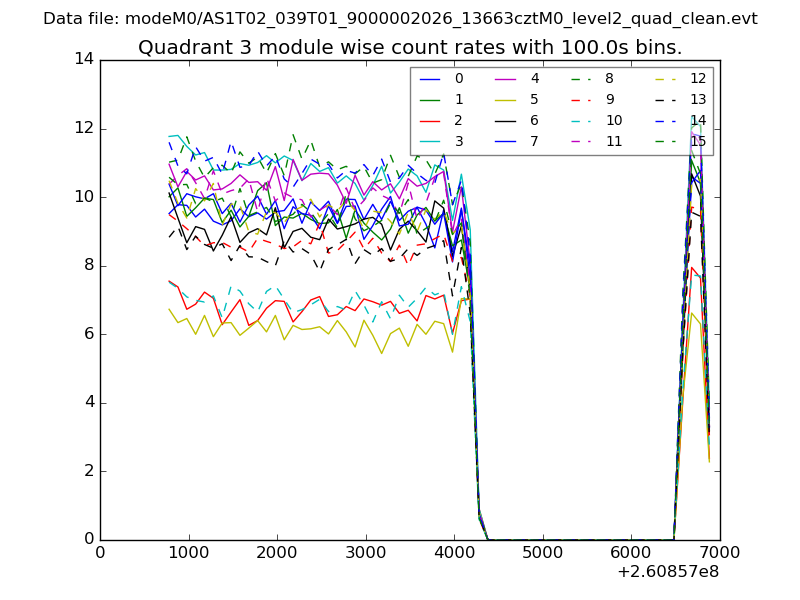
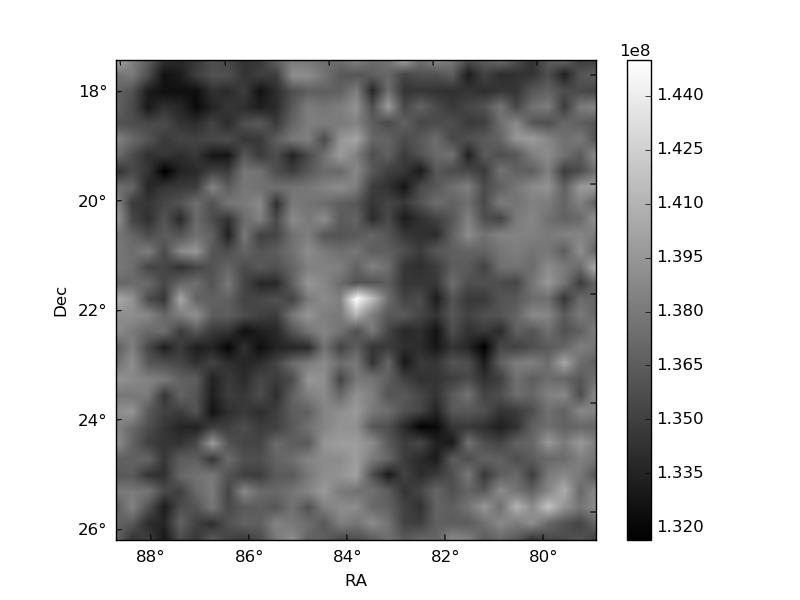
| Module-wise count rates for Quadrant C Data is divided into 100 sec bins |
 |
 |
| Module-wise count rates for Quadrant D Data is divided into 100 sec bins |
 |
 |
| Parameter | Plot |
|---|---|
| CZT HV Monitor | 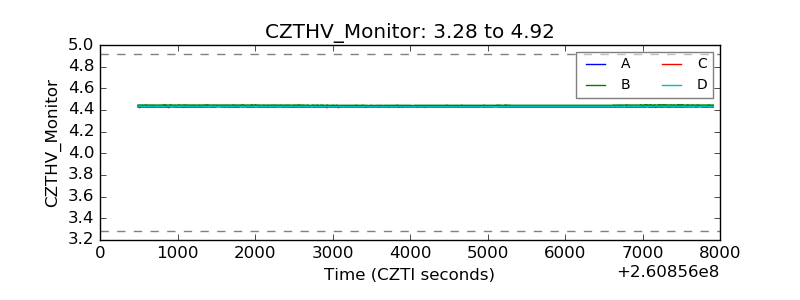 |
| D_VDD | 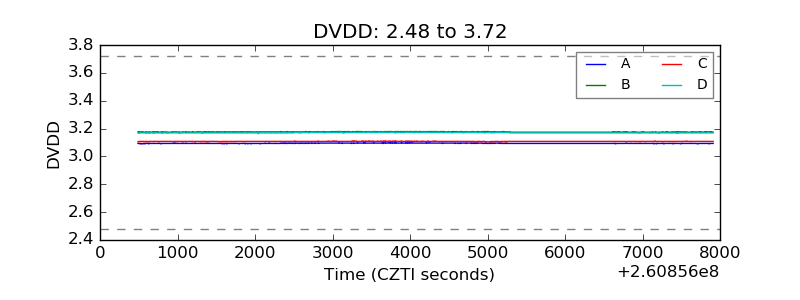 |
| Temperature 1 | 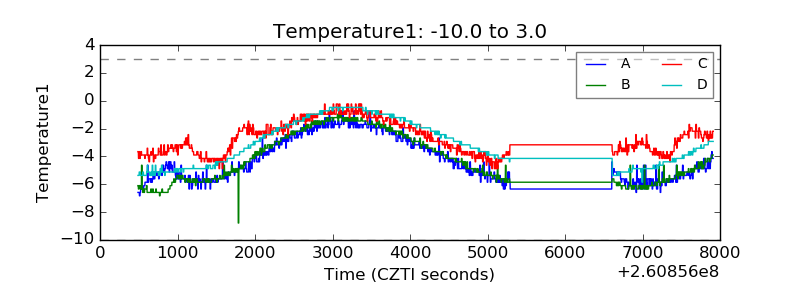 |
| Veto HV Monitor | 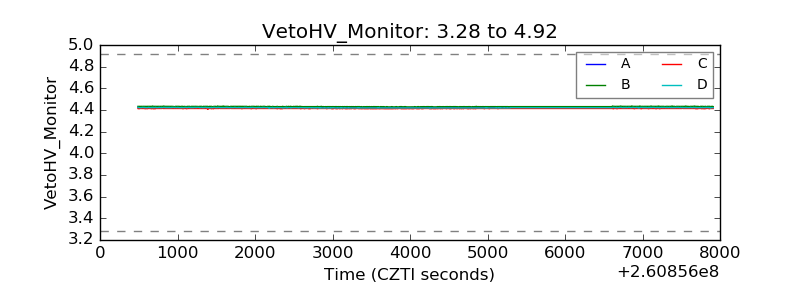 |
| Veto LLD | 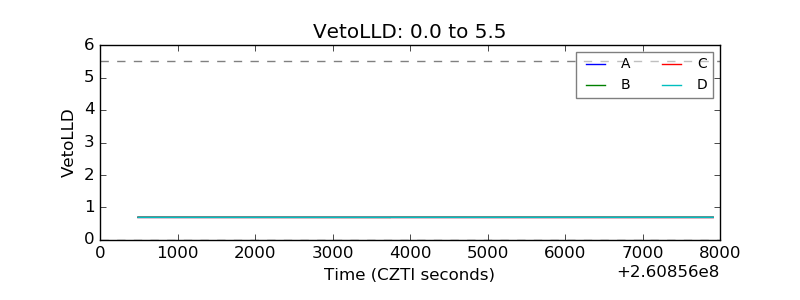 |
| Alpha Counter | 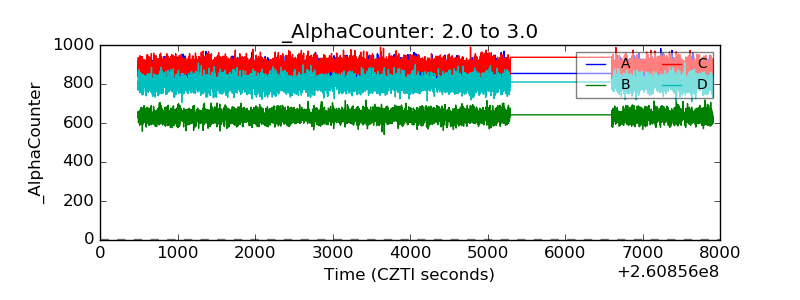 |
| _CPM_Rate | 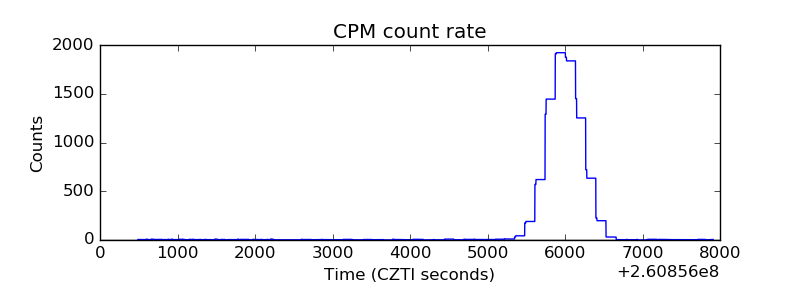 |
| CZT Counter | 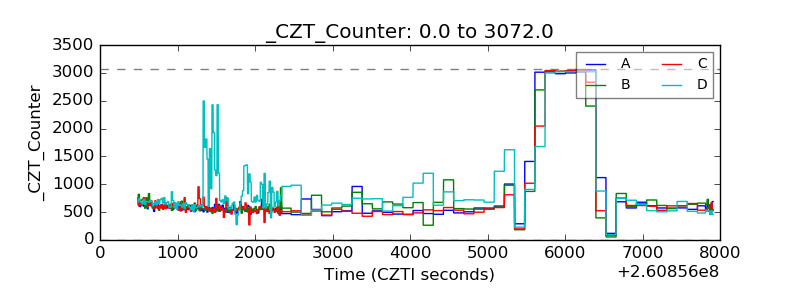 |
| +2.5 Volts monitor |  |
| +5 Volts monitor |  |
| _ROLL_ROT | 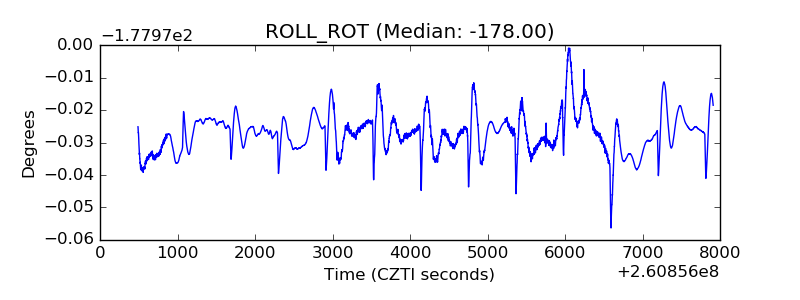 |
| _Roll_DEC | 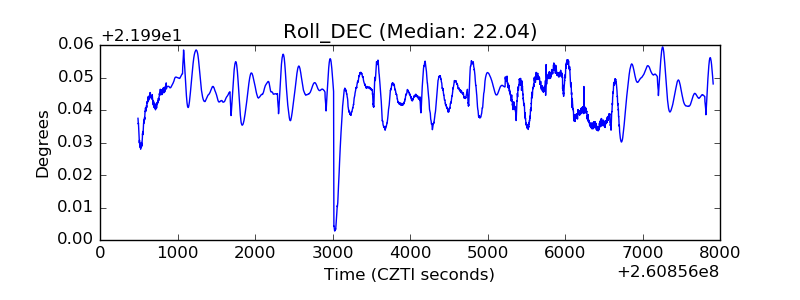 |
| _Roll_RA | 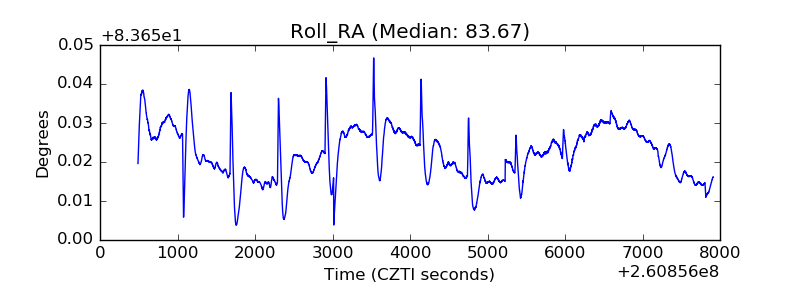 |
| Veto Counter | 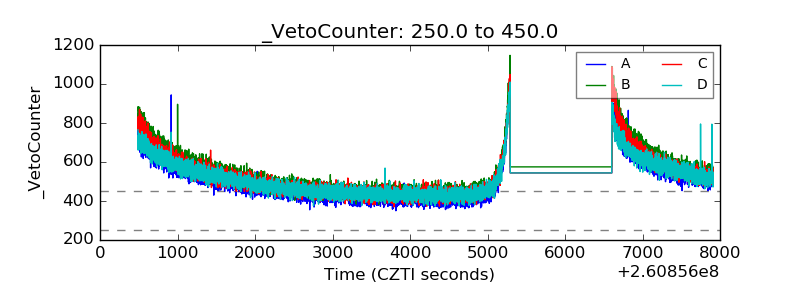 |