| Param | Original file | Final file |
|---|---|---|
| Filename | modeM0/AS1T02_039T01_9000002026_13665cztM0_level2.evt | modeM0/AS1T02_039T01_9000002026_13665cztM0_level2_quad_clean.evt |
| Size (bytes) | 63,463,680 | 19,998,720 |
| Size | 60.5 MB | 19.1 MB |
| Events in quadrant A | 454,669 | 137,013 |
| Events in quadrant B | 472,827 | 139,852 |
| Events in quadrant C | 460,403 | 134,551 |
| Events in quadrant D | 474,526 | 128,468 |
| Mode SS | |||
|---|---|---|---|
| Quadrant | BADHDUFLAG | Total packets | Discarded packets |
| A | 0 | 18 | 0 |
| B | 0 | 18 | 0 |
| C | 0 | 18 | 0 |
| D | 0 | 18 | 0 |
| Mode M0 | |||
|---|---|---|---|
| Quadrant | BADHDUFLAG | Total packets | Discarded packets |
| A | 0 | 1774 | 0 |
| B | 0 | 1893 | 0 |
| C | 0 | 1818 | 0 |
| D | 0 | 1880 | 0 |
| Quadrant | Total seconds | Saturated seconds | Saturation percentage |
|---|---|---|---|
| A | 823 | 0 | 0.000000% |
| B | 823 | 2 | 0.243013% |
| C | 823 | 0 | 0.000000% |
| D | 823 | 4 | 0.486027% |
Noise dominated data is calculated using 1-second bins in cleaned event files. If a bin has >2000 counts, and if more than 50% of those come from <1% of pixels, then it is considered to be noise-dominated and hence unusable.
| Quadrant | # 1 sec bins | Bins with >0 counts | Bins with >2000 counts | High rate bins dominated by noise | Noise dominated (total time) | Noise dominated (detector-on time) | Marked lightcurve |
|---|---|---|---|---|---|---|---|
| A | 824 | 824 | 0 | 0 | 0.00% | 0.00% | 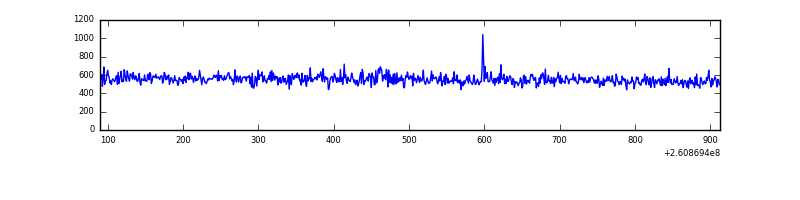 |
| B | 824 | 824 | 0 | 0 | 0.00% | 0.00% | 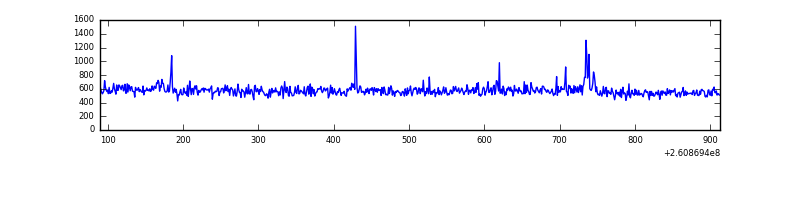 |
| C | 824 | 824 | 0 | 0 | 0.00% | 0.00% | 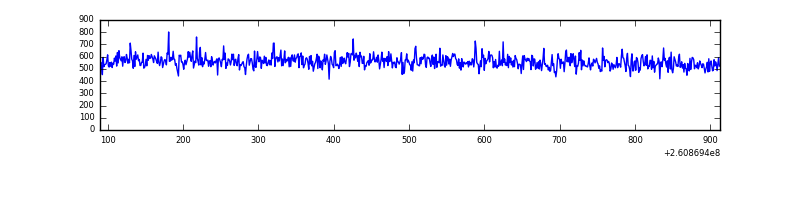 |
| D | 824 | 824 | 5 | 5 | 0.61% | 0.61% |  |
Top three noisy pixels from each quadrant. If the there are fewer than three noisy pixels in the level2.evt file, extra rows are filled as -1
| Pixel properties | Quadrant properties | ||||||
|---|---|---|---|---|---|---|---|
| Quadrant | DetID | PixID | Counts | Sigma | Mean | Median | Sigma |
| A | 1 | 162 | 1653 | 59.43 | 117 | 115 | 25.9 |
| A | 0 | 226 | 1017 | 34.85 | 117 | 115 | 25.9 |
| A | 12 | 194 | 882 | 29.64 | 117 | 115 | 25.9 |
| B | 0 | 219 | 14917 | 606.45 | 115 | 113 | 24.4 |
| B | 12 | 111 | 2421 | 94.55 | 115 | 113 | 24.4 |
| B | 0 | 229 | 2183 | 84.8 | 115 | 113 | 24.4 |
| C | 3 | 233 | 29766 | 1093.38 | 110 | 111 | 27.1 |
| C | 13 | 61 | 826 | 26.36 | 110 | 111 | 27.1 |
| C | 3 | 202 | 279 | 6.19 | 110 | 111 | 27.1 |
| D | 1 | 52 | 13616 | 463.6 | 111 | 108 | 29.1 |
| D | 8 | 195 | 12970 | 441.43 | 111 | 108 | 29.1 |
| D | 14 | 35 | 11832 | 402.37 | 111 | 108 | 29.1 |
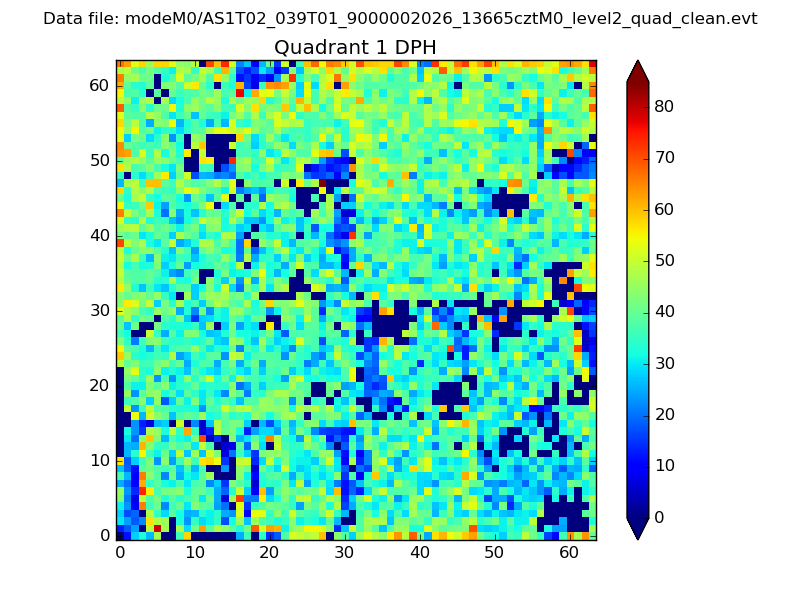
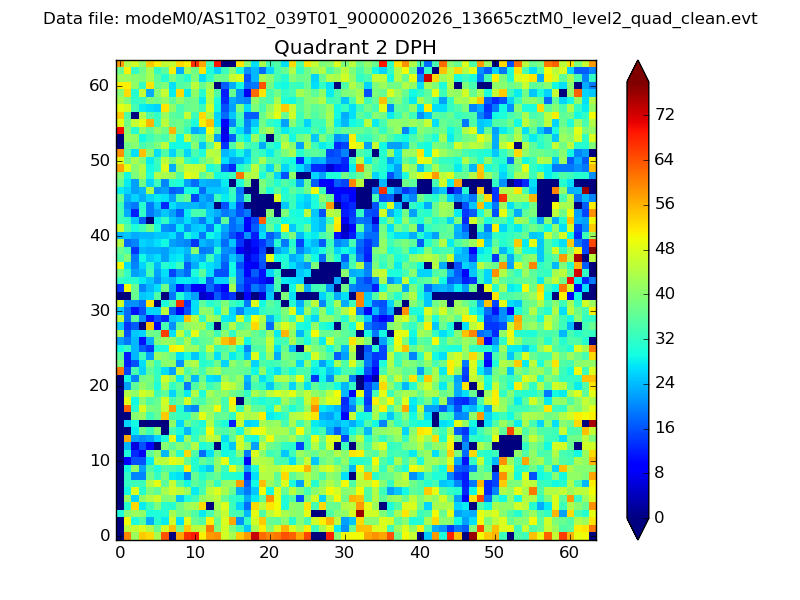
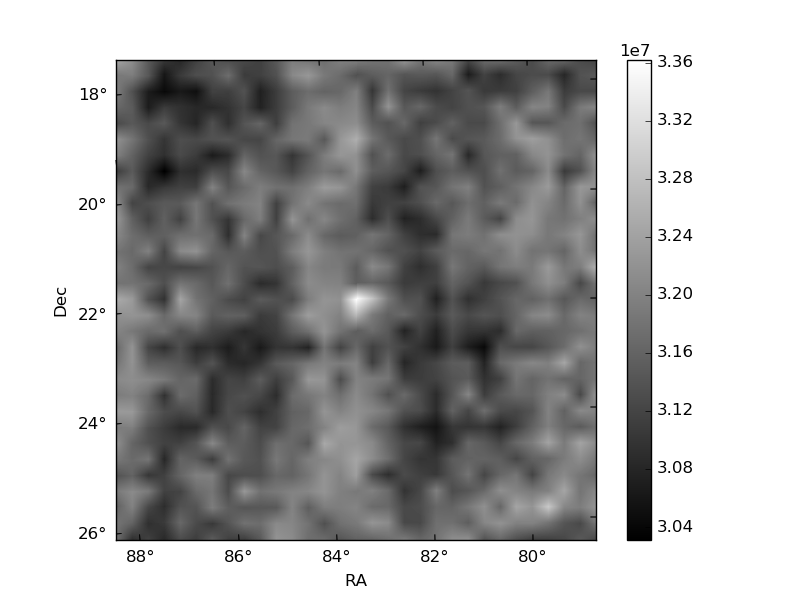
Histogram calculated using DETX and DETY for each event in the final _common_clean file
| Quadrant A | 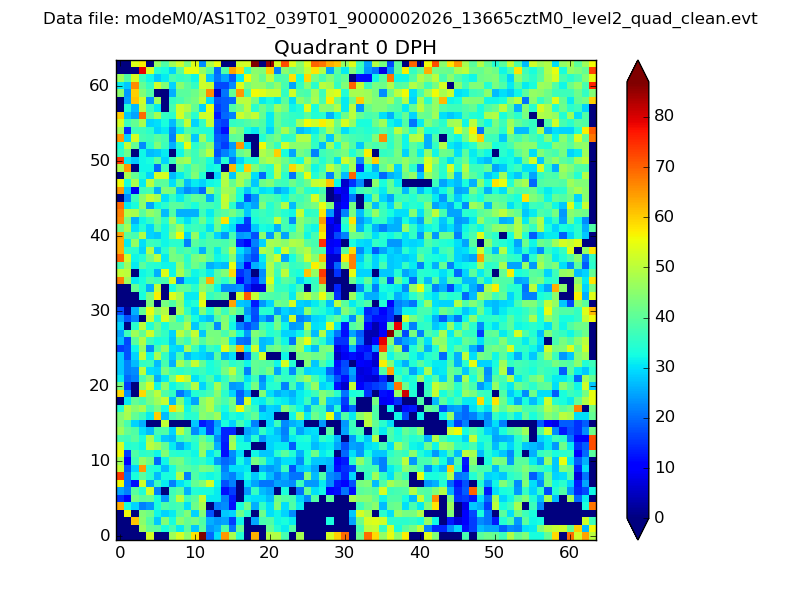 |
 |
Quadrant B |
|---|---|---|---|
| Quadrant D | 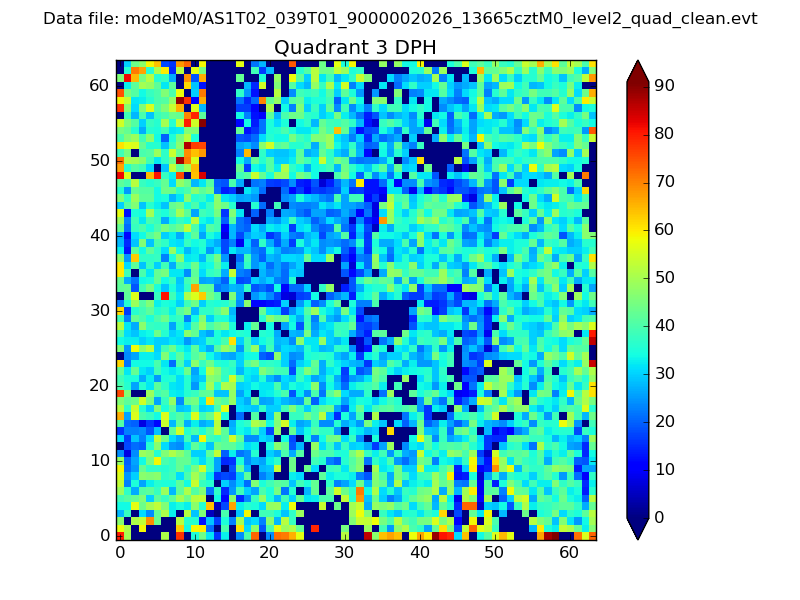 |
 |
Quadrant C |
| Plot type | Count rate plots | Images |
|---|---|---|
| Comparison with Poisson distribution Blue bars denote a histogram of data divided into 1 sec bins. Red curve is a Poisson curve with rate = median count rate of data. |
 |
 |
| Quadrant-wise count rates Data is divided into 100 sec bins |
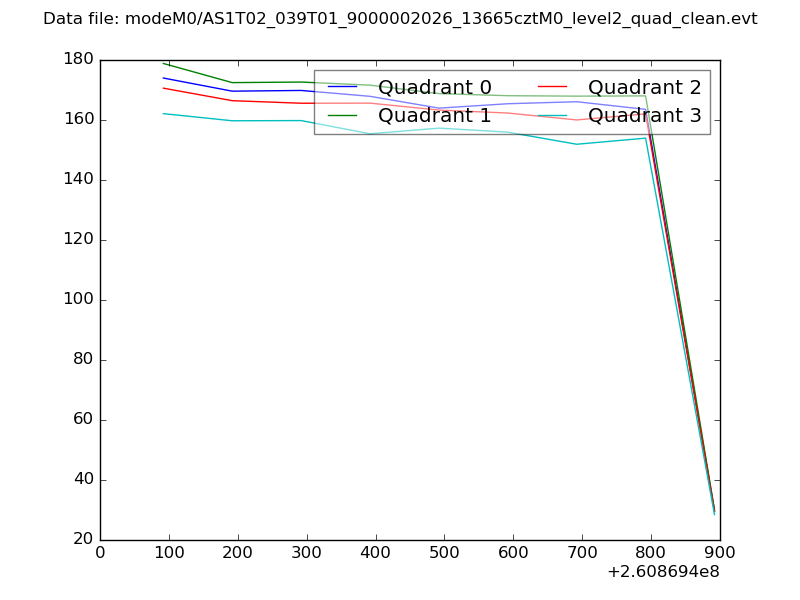 |
|
| Module-wise count rates for Quadrant A Data is divided into 100 sec bins |
 |
 |
| Module-wise count rates for Quadrant B Data is divided into 100 sec bins |
 |
 |
| Module-wise count rates for Quadrant C Data is divided into 100 sec bins |
 |
 |
| Module-wise count rates for Quadrant D Data is divided into 100 sec bins |
 |
 |
| Parameter | Plot |
|---|---|
| CZT HV Monitor |  |
| D_VDD | 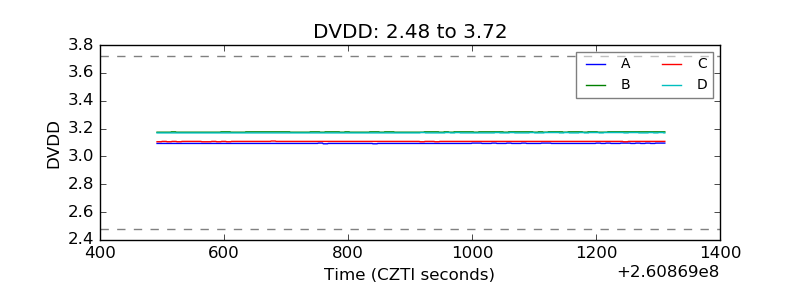 |
| Temperature 1 | 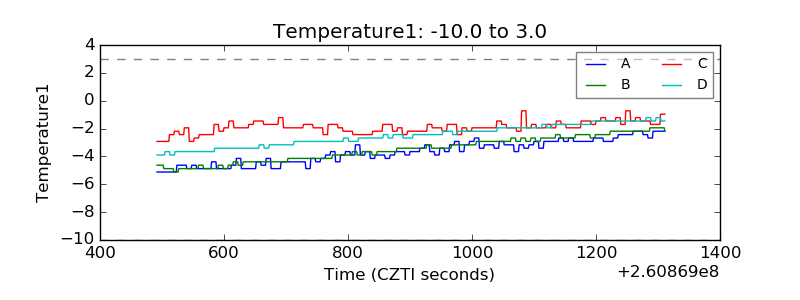 |
| Veto HV Monitor | 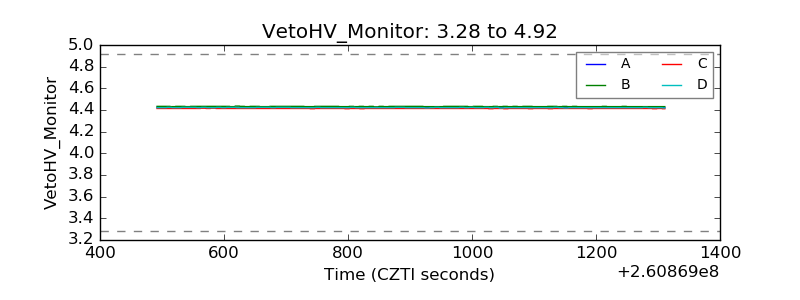 |
| Veto LLD | 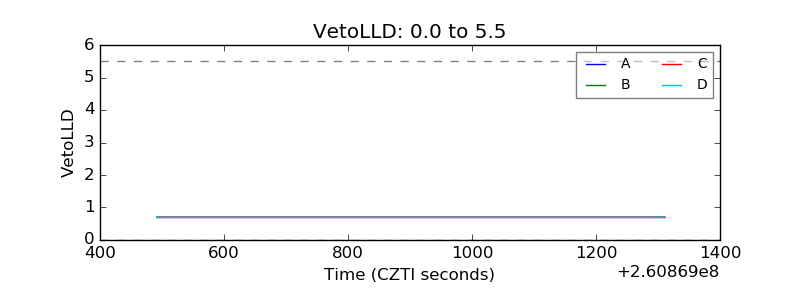 |
| Alpha Counter | 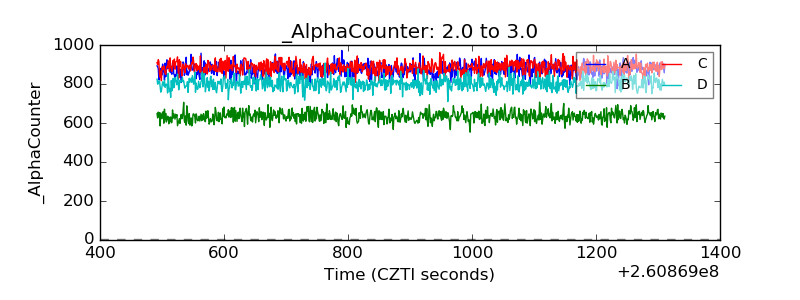 |
| _CPM_Rate | 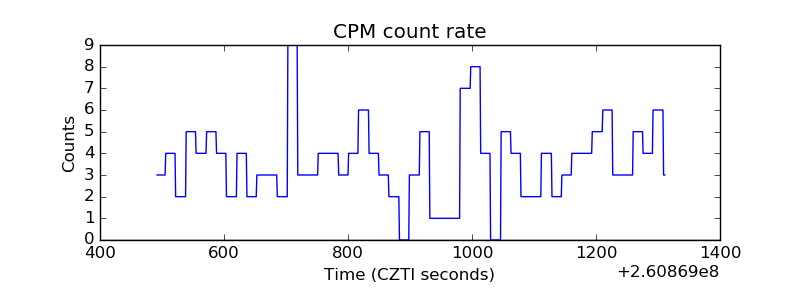 |
| CZT Counter | 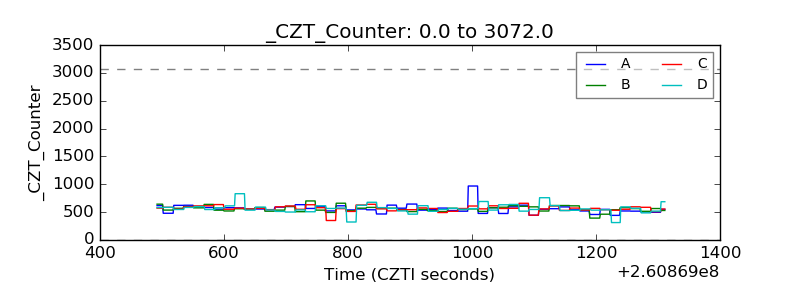 |
| +2.5 Volts monitor |  |
| +5 Volts monitor |  |
| _ROLL_ROT |  |
| _Roll_DEC | 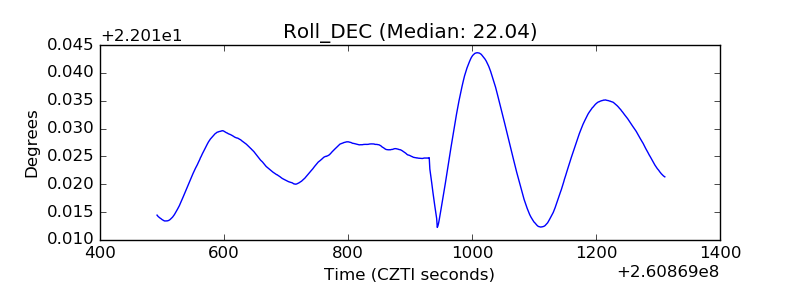 |
| _Roll_RA | 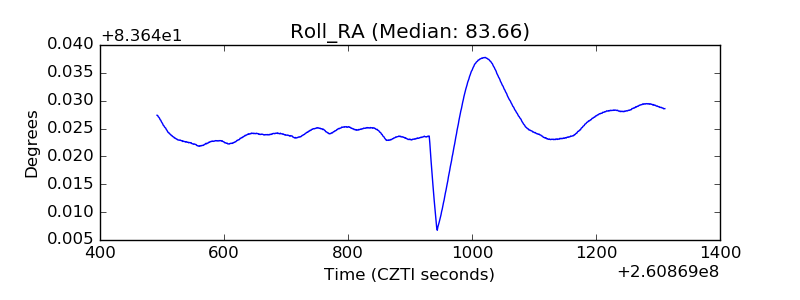 |
| Veto Counter |  |