| Param | Original file | Final file |
|---|---|---|
| Filename | modeM0/AS1T02_040T01_9000002030_13698cztM0_level2.evt | modeM0/AS1T02_040T01_9000002030_13698cztM0_level2_quad_clean.evt |
| Size (bytes) | 318,723,840 | 53,979,840 |
| Size | 304.0 MB | 51.5 MB |
| Events in quadrant A | 2,039,962 | 345,314 |
| Events in quadrant B | 2,198,341 | 364,845 |
| Events in quadrant C | 2,020,858 | 325,488 |
| Events in quadrant D | 3,112,613 | 308,392 |
| Mode SS | |||
|---|---|---|---|
| Quadrant | BADHDUFLAG | Total packets | Discarded packets |
| A | 0 | 86 | 0 |
| B | 0 | 86 | 0 |
| C | 0 | 86 | 0 |
| D | 0 | 86 | 0 |
| Mode M0 | |||
|---|---|---|---|
| Quadrant | BADHDUFLAG | Total packets | Discarded packets |
| A | 0 | 8601 | 3 |
| B | 0 | 9038 | 2 |
| C | 0 | 8518 | 2 |
| D | 0 | 12028 | 2 |
| Mode M9 | |||
|---|---|---|---|
| Quadrant | BADHDUFLAG | Total packets | Discarded packets |
| A | 0 | 3 | 0 |
| B | 0 | 3 | 0 |
| C | 0 | 3 | 0 |
| D | 0 | 3 | 0 |
| Quadrant | Total seconds | Saturated seconds | Saturation percentage |
|---|---|---|---|
| A | 4112 | 54 | 1.313230% |
| B | 4112 | 76 | 1.848249% |
| C | 4112 | 35 | 0.851167% |
| D | 4112 | 220 | 5.350195% |
Noise dominated data is calculated using 1-second bins in cleaned event files. If a bin has >2000 counts, and if more than 50% of those come from <1% of pixels, then it is considered to be noise-dominated and hence unusable.
| Quadrant | # 1 sec bins | Bins with >0 counts | Bins with >2000 counts | High rate bins dominated by noise | Noise dominated (total time) | Noise dominated (detector-on time) | Marked lightcurve |
|---|---|---|---|---|---|---|---|
| A | 4428 | 4115 | 0 | 0 | 0.00% | 0.00% | 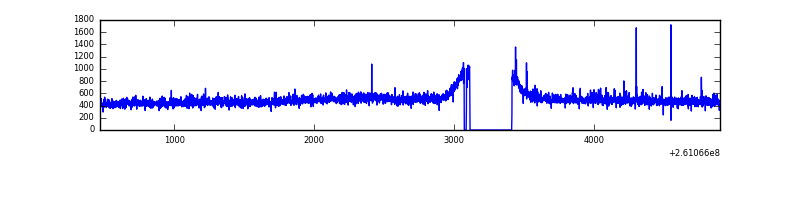 |
| B | 4428 | 4115 | 4 | 4 | 0.09% | 0.10% | 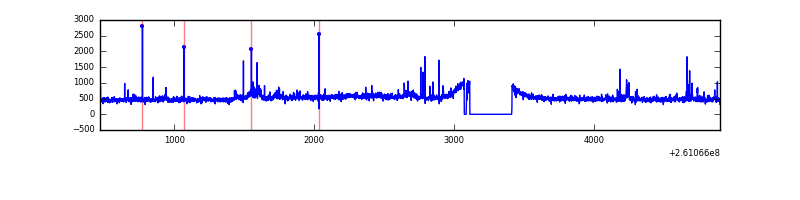 |
| C | 4428 | 4115 | 0 | 0 | 0.00% | 0.00% | 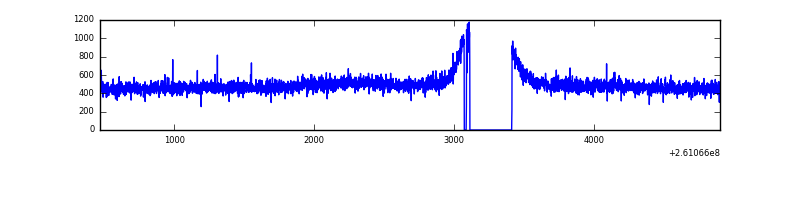 |
| D | 4428 | 4115 | 124 | 124 | 2.80% | 3.01% | 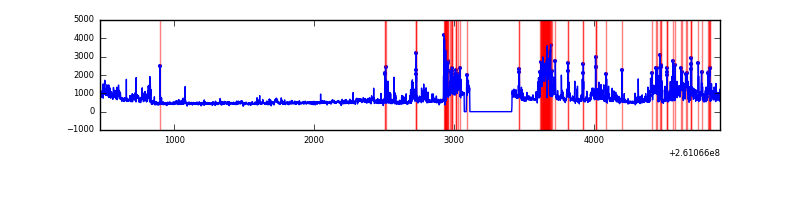 |
Top three noisy pixels from each quadrant. If the there are fewer than three noisy pixels in the level2.evt file, extra rows are filled as -1
| Pixel properties | Quadrant properties | ||||||
|---|---|---|---|---|---|---|---|
| Quadrant | DetID | PixID | Counts | Sigma | Mean | Median | Sigma |
| A | 1 | 162 | 22735 | 203.74 | 520 | 510 | 109.1 |
| A | 1 | 178 | 7417 | 63.32 | 520 | 510 | 109.1 |
| A | 1 | 161 | 6691 | 56.66 | 520 | 510 | 109.1 |
| B | 0 | 214 | 99101 | 973.97 | 523 | 511 | 101.2 |
| B | 4 | 80 | 21359 | 205.96 | 523 | 511 | 101.2 |
| B | 0 | 219 | 15305 | 146.15 | 523 | 511 | 101.2 |
| C | 3 | 233 | 68611 | 581.99 | 500 | 503 | 117.0 |
| C | 13 | 61 | 3666 | 27.03 | 500 | 503 | 117.0 |
| C | 8 | 128 | 2039 | 13.13 | 500 | 503 | 117.0 |
| D | 13 | 122 | 396167 | 3304.97 | 491 | 477 | 119.7 |
| D | 5 | 222 | 289461 | 2413.72 | 491 | 477 | 119.7 |
| D | 1 | 52 | 270108 | 2252.07 | 491 | 477 | 119.7 |
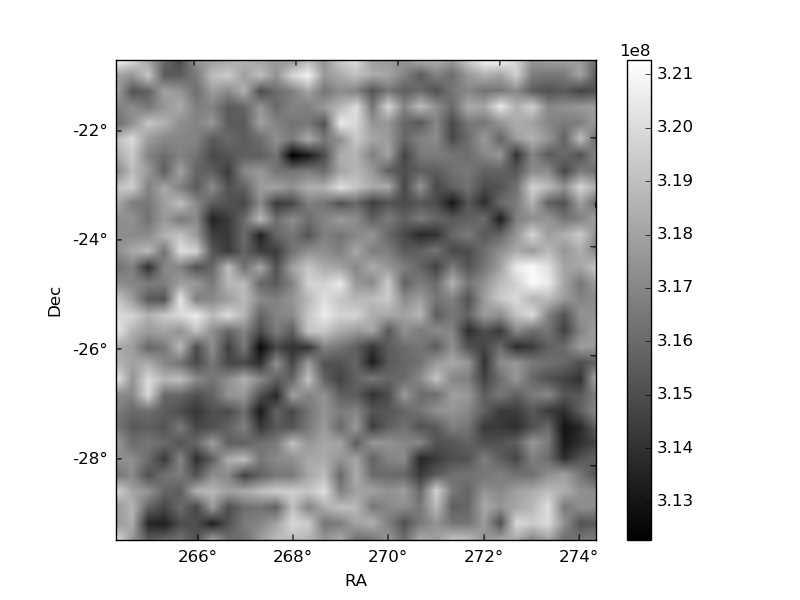
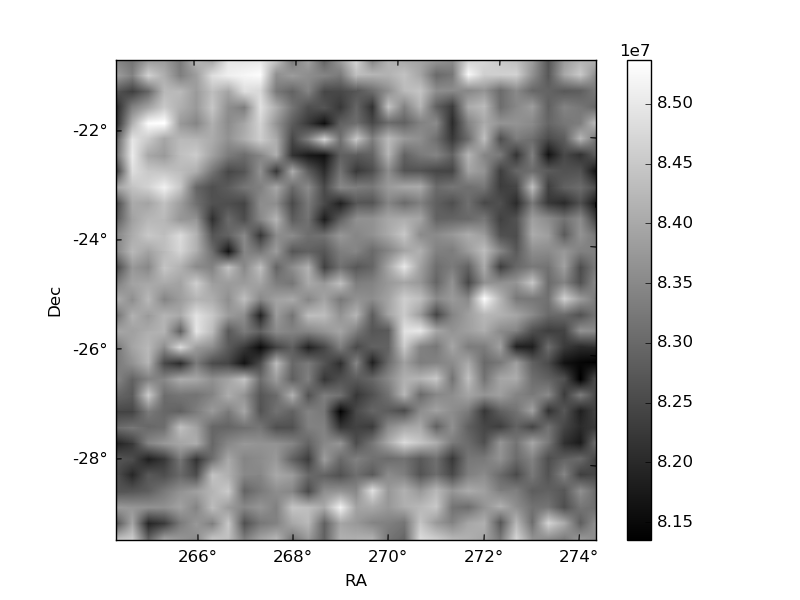
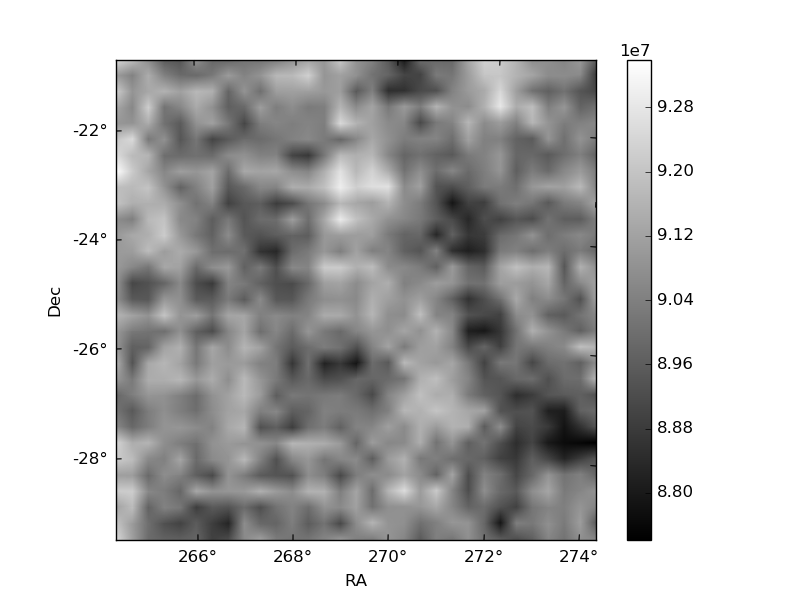
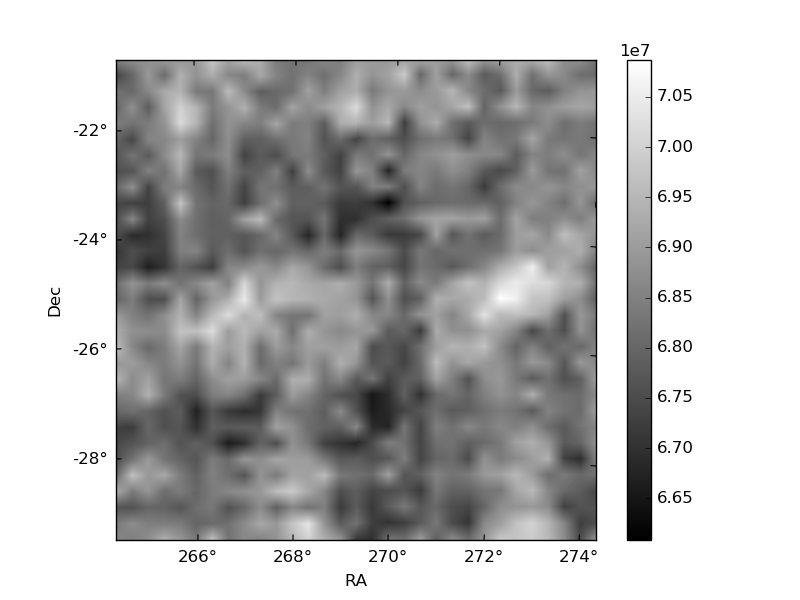
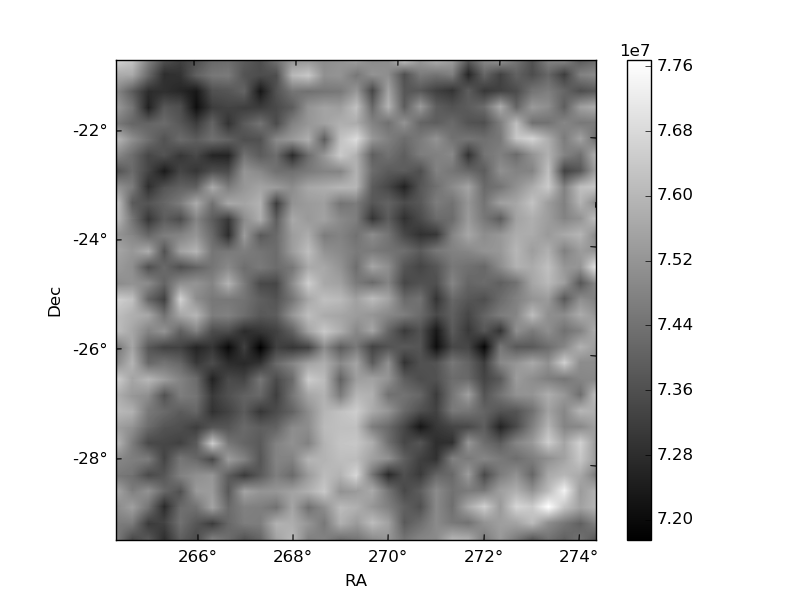
Histogram calculated using DETX and DETY for each event in the final _common_clean file
| Quadrant A | 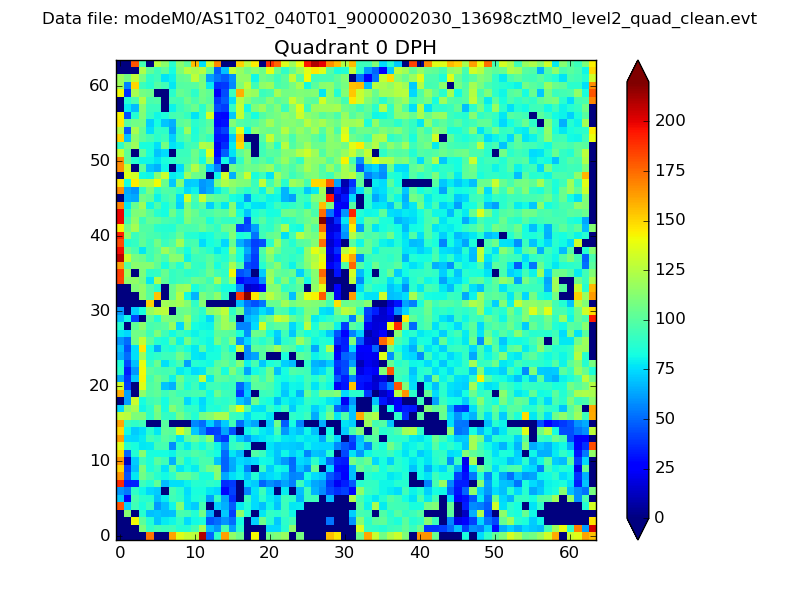 |
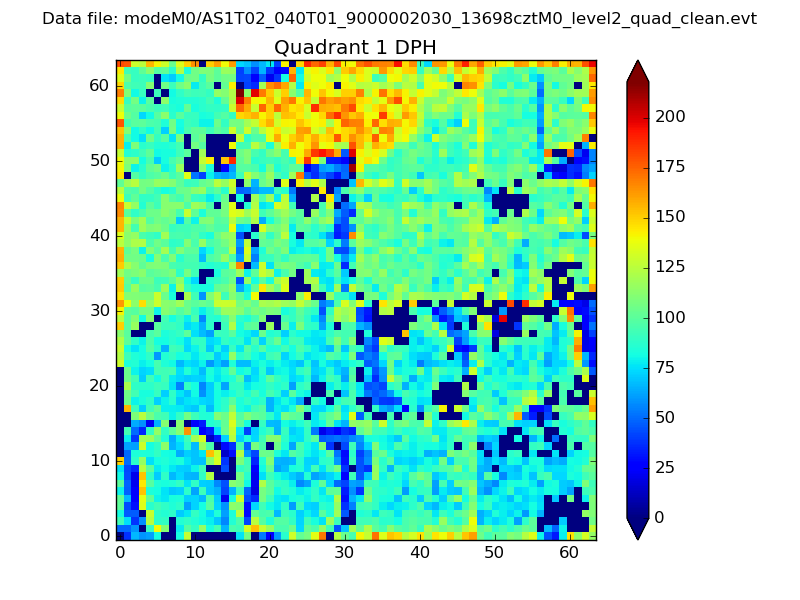 |
Quadrant B |
|---|---|---|---|
| Quadrant D | 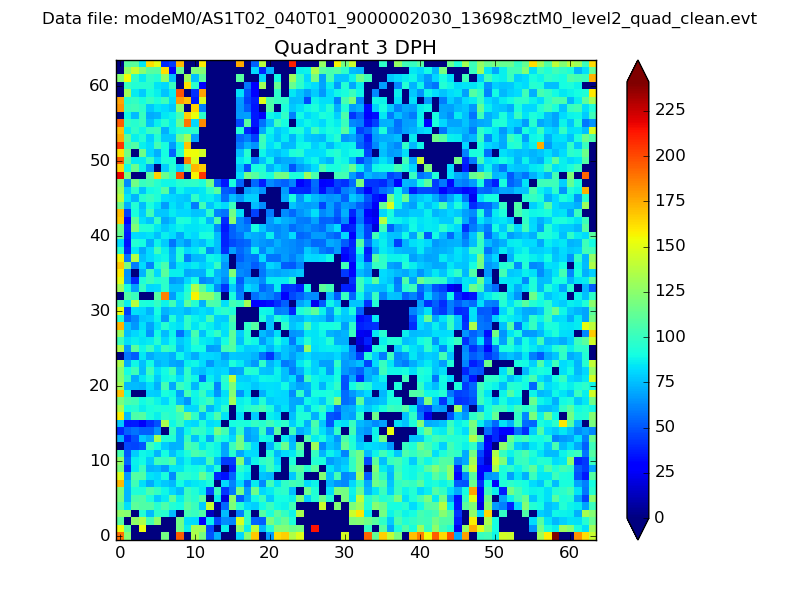 |
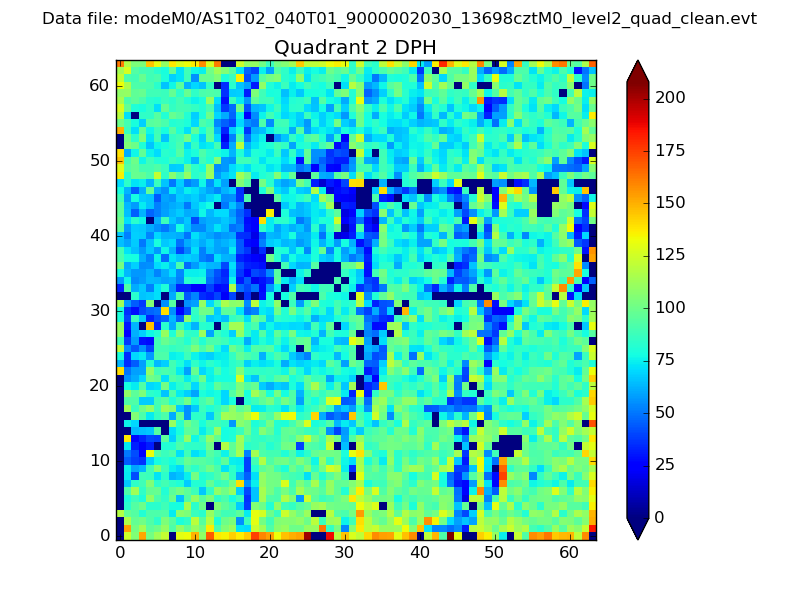 |
Quadrant C |
| Plot type | Count rate plots | Images |
|---|---|---|
| Comparison with Poisson distribution Blue bars denote a histogram of data divided into 1 sec bins. Red curve is a Poisson curve with rate = median count rate of data. |
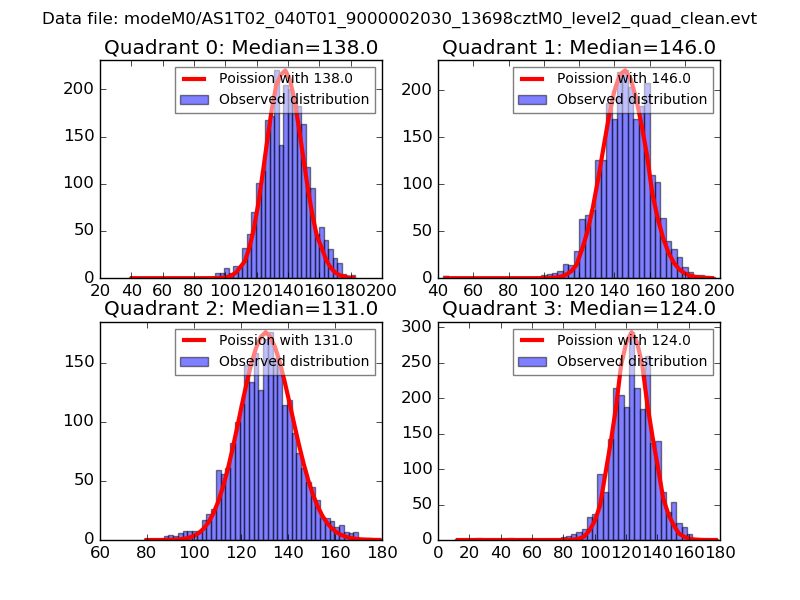 |
 |
| Quadrant-wise count rates Data is divided into 100 sec bins |
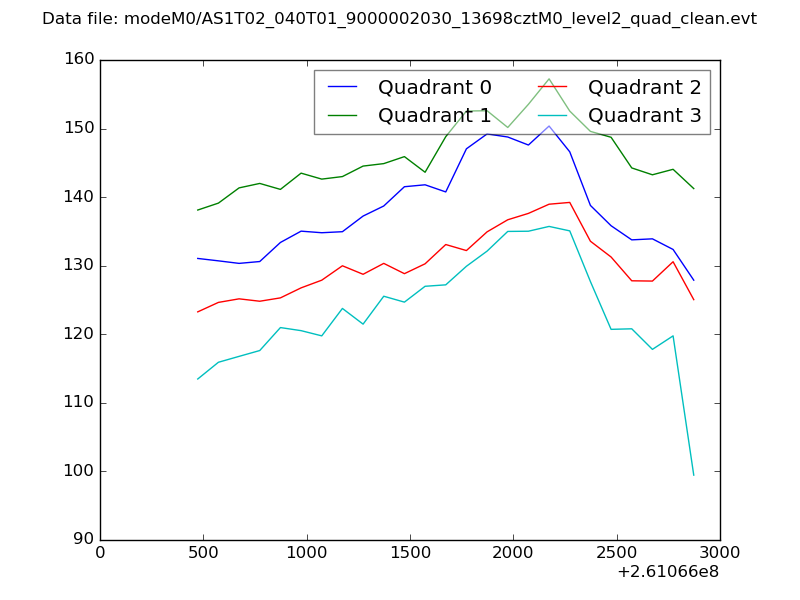 |
|
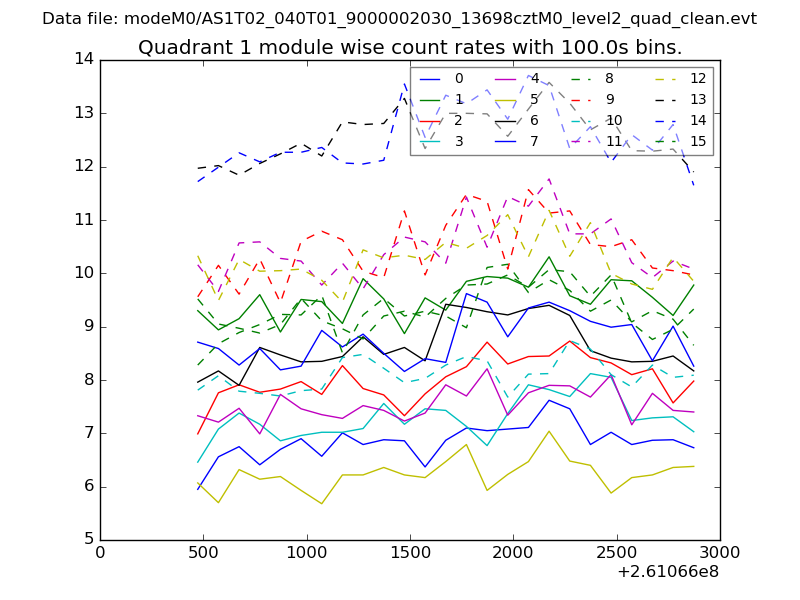
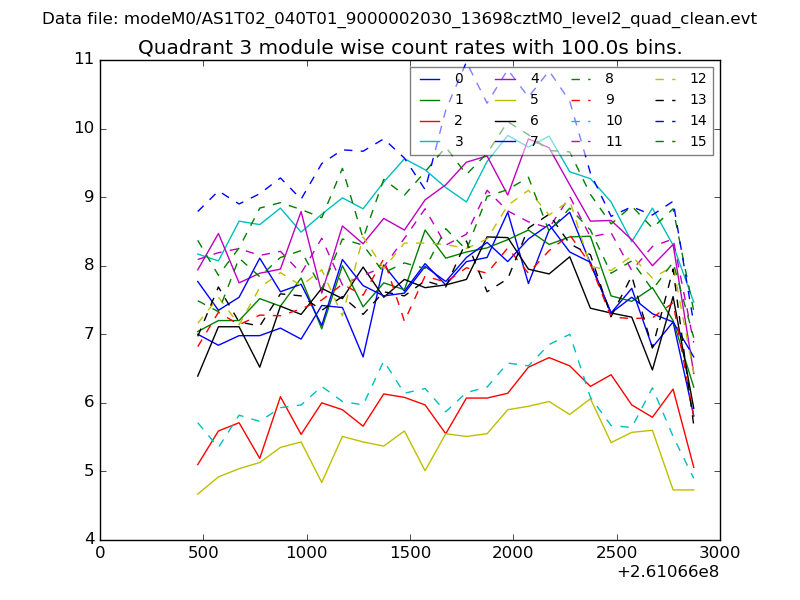
| Module-wise count rates for Quadrant A Data is divided into 100 sec bins |
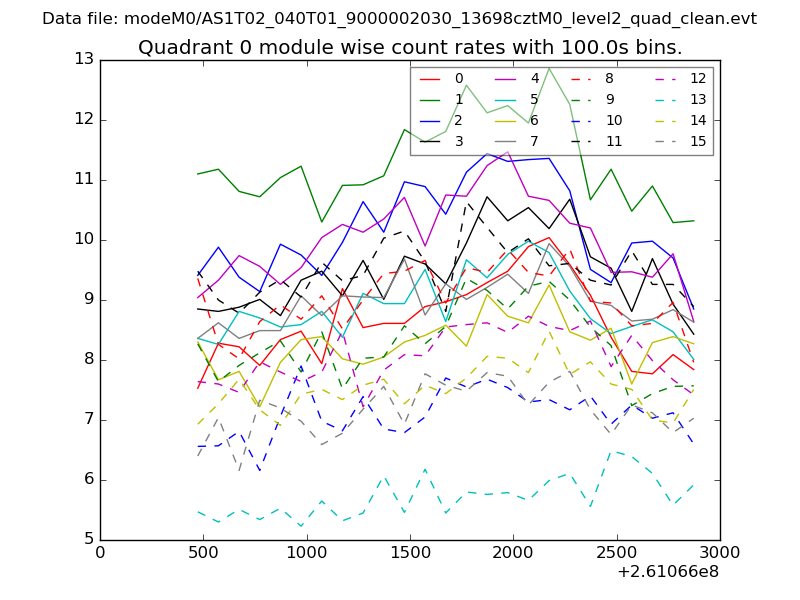 |
 |
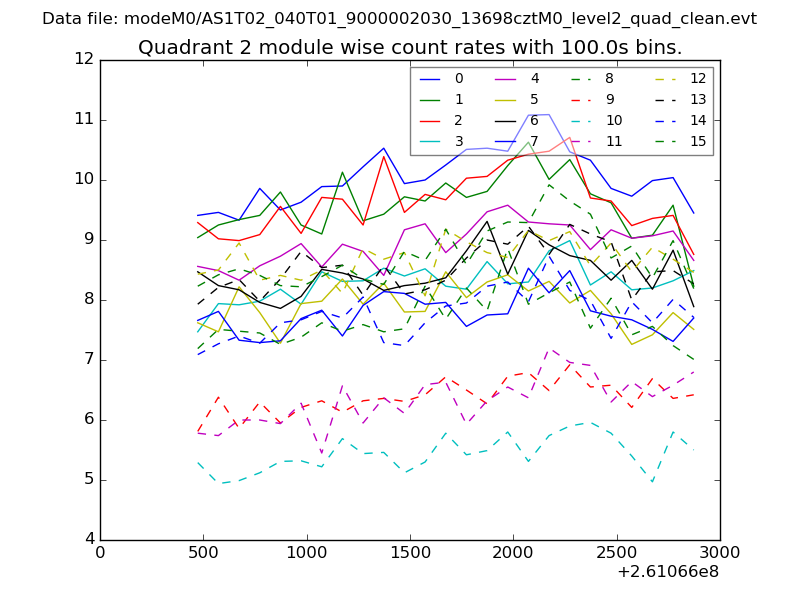
| Module-wise count rates for Quadrant B Data is divided into 100 sec bins |
 |
 |
| Module-wise count rates for Quadrant C Data is divided into 100 sec bins |
 |
 |
| Module-wise count rates for Quadrant D Data is divided into 100 sec bins |
 |
 |
| Parameter | Plot |
|---|---|
| CZT HV Monitor | 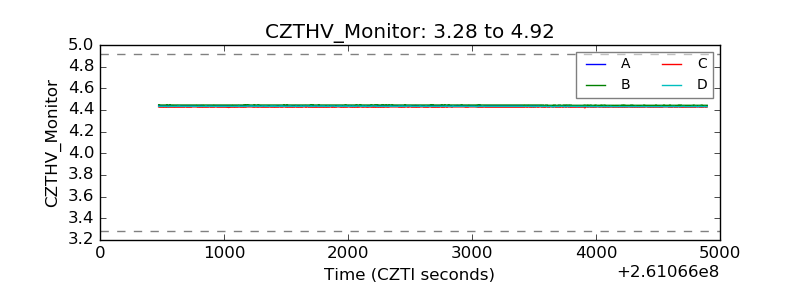 |
| D_VDD | 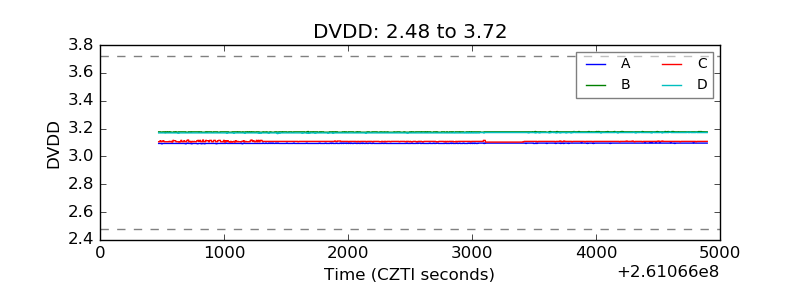 |
| Temperature 1 |  |
| Veto HV Monitor | 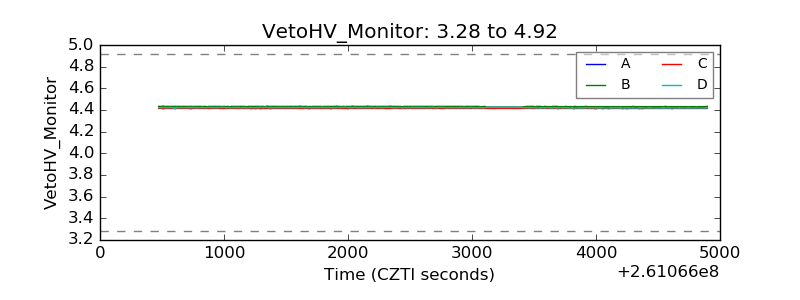 |
| Veto LLD | 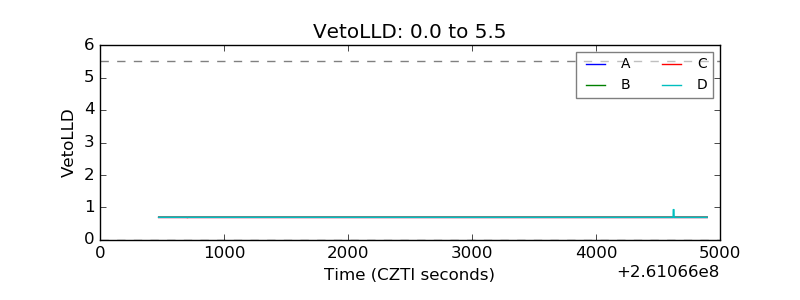 |
| Alpha Counter | 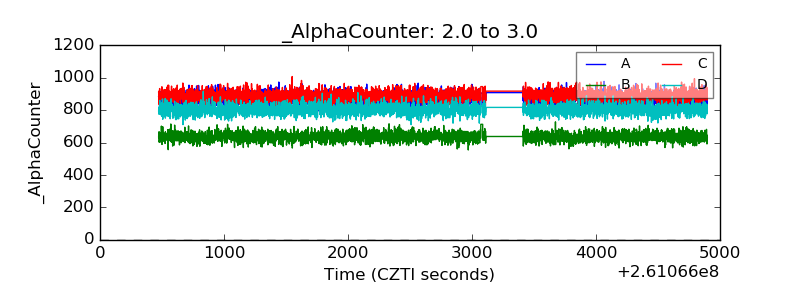 |
| _CPM_Rate | 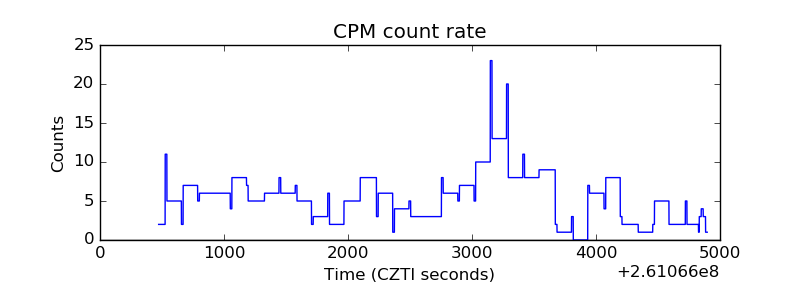 |
| CZT Counter |  |
| +2.5 Volts monitor |  |
| +5 Volts monitor |  |
| _ROLL_ROT | 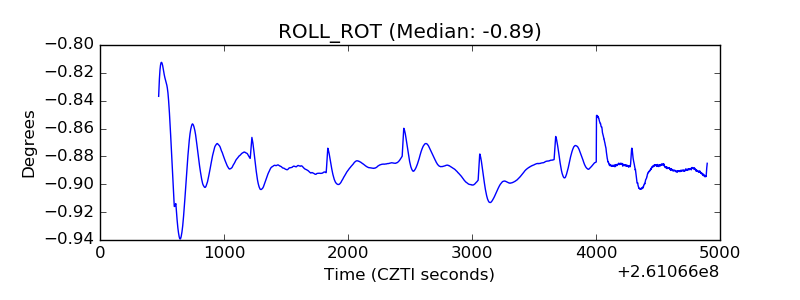 |
| _Roll_DEC | 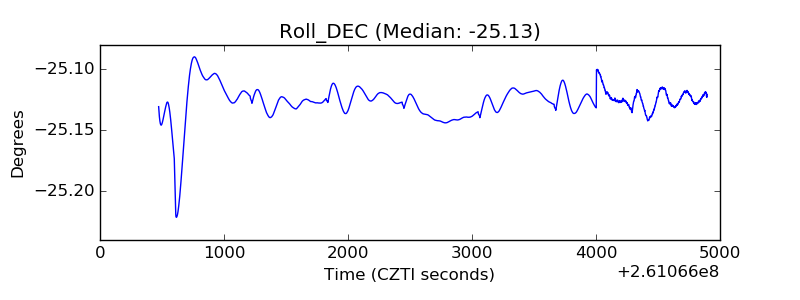 |
| _Roll_RA | 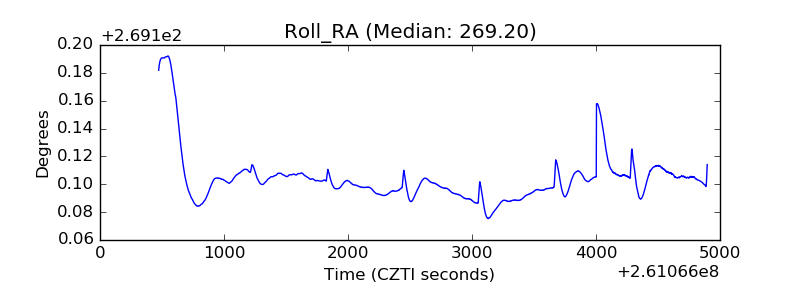 |
| Veto Counter | 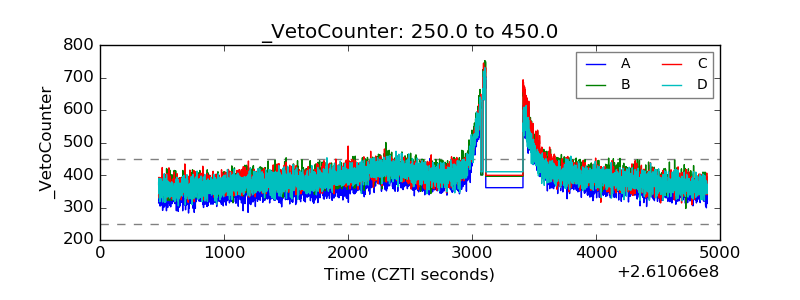 |