| Param | Original file | Final file |
|---|---|---|
| Filename | modeM0/AS1T02_040T01_9000002030_13700cztM0_level2.evt | modeM0/AS1T02_040T01_9000002030_13700cztM0_level2_quad_clean.evt |
| Size (bytes) | 972,432,000 | 163,690,560 |
| Size | 927.4 MB | 156.1 MB |
| Events in quadrant A | 6,333,508 | 1,032,892 |
| Events in quadrant B | 6,792,592 | 1,101,541 |
| Events in quadrant C | 6,247,691 | 991,604 |
| Events in quadrant D | 9,192,778 | 928,350 |
| Mode SS | |||
|---|---|---|---|
| Quadrant | BADHDUFLAG | Total packets | Discarded packets |
| A | 0 | 268 | 0 |
| B | 0 | 268 | 0 |
| C | 0 | 268 | 0 |
| D | 0 | 268 | 0 |
| Mode M0 | |||
|---|---|---|---|
| Quadrant | BADHDUFLAG | Total packets | Discarded packets |
| A | 0 | 27194 | 5 |
| B | 0 | 28267 | 4 |
| C | 0 | 26840 | 4 |
| D | 0 | 35894 | 4 |
| Mode M9 | |||
|---|---|---|---|
| Quadrant | BADHDUFLAG | Total packets | Discarded packets |
| A | 0 | 14 | 0 |
| B | 0 | 13 | 0 |
| C | 0 | 13 | 0 |
| D | 0 | 13 | 0 |
| Quadrant | Total seconds | Saturated seconds | Saturation percentage |
|---|---|---|---|
| A | 13063 | 137 | 1.048764% |
| B | 13063 | 188 | 1.439179% |
| C | 13063 | 87 | 0.666003% |
| D | 13063 | 409 | 3.130981% |
Noise dominated data is calculated using 1-second bins in cleaned event files. If a bin has >2000 counts, and if more than 50% of those come from <1% of pixels, then it is considered to be noise-dominated and hence unusable.
| Quadrant | # 1 sec bins | Bins with >0 counts | Bins with >2000 counts | High rate bins dominated by noise | Noise dominated (total time) | Noise dominated (detector-on time) | Marked lightcurve |
|---|---|---|---|---|---|---|---|
| A | 14529 | 13068 | 4 | 4 | 0.03% | 0.03% | 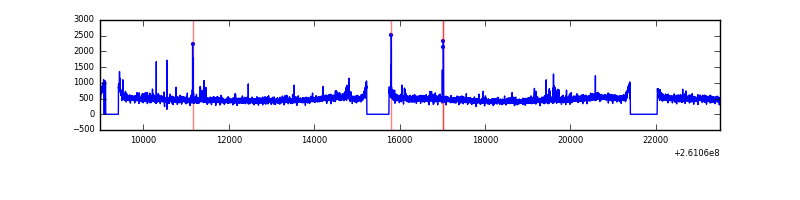 |
| B | 14529 | 13068 | 13 | 13 | 0.09% | 0.10% | 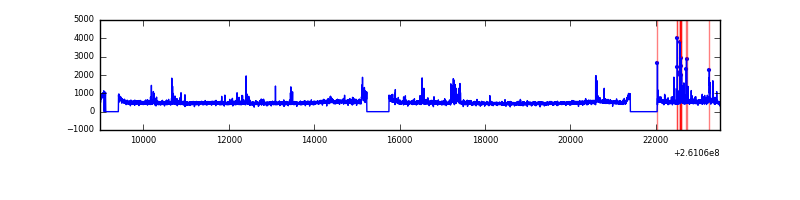 |
| C | 14529 | 13067 | 1 | 1 | 0.01% | 0.01% | 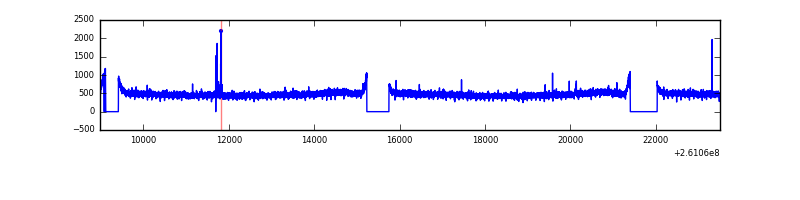 |
| D | 14529 | 13068 | 261 | 261 | 1.80% | 2.00% | 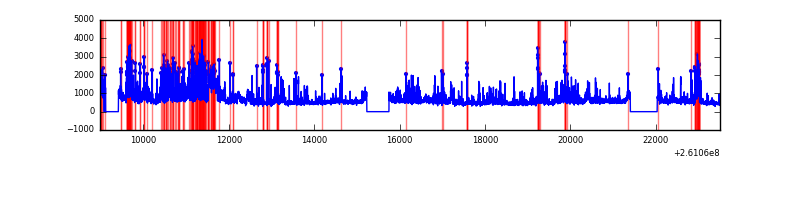 |
Top three noisy pixels from each quadrant. If the there are fewer than three noisy pixels in the level2.evt file, extra rows are filled as -1
| Pixel properties | Quadrant properties | ||||||
|---|---|---|---|---|---|---|---|
| Quadrant | DetID | PixID | Counts | Sigma | Mean | Median | Sigma |
| A | 1 | 162 | 53814 | 160.52 | 1600 | 1569 | 325.5 |
| A | 15 | 157 | 53187 | 158.59 | 1600 | 1569 | 325.5 |
| A | 15 | 69 | 32300 | 94.42 | 1600 | 1569 | 325.5 |
| B | 0 | 219 | 213202 | 693.01 | 1619 | 1585 | 305.4 |
| B | 4 | 48 | 138789 | 449.32 | 1619 | 1585 | 305.4 |
| B | 12 | 111 | 35159 | 109.95 | 1619 | 1585 | 305.4 |
| C | 3 | 233 | 197402 | 547.65 | 1544 | 1555 | 357.6 |
| C | 14 | 234 | 27855 | 73.54 | 1544 | 1555 | 357.6 |
| C | 13 | 61 | 11116 | 26.74 | 1544 | 1555 | 357.6 |
| D | 5 | 222 | 1055505 | 2858.08 | 1523 | 1480 | 368.8 |
| D | 1 | 52 | 829239 | 2244.54 | 1523 | 1480 | 368.8 |
| D | 13 | 122 | 709268 | 1919.23 | 1523 | 1480 | 368.8 |
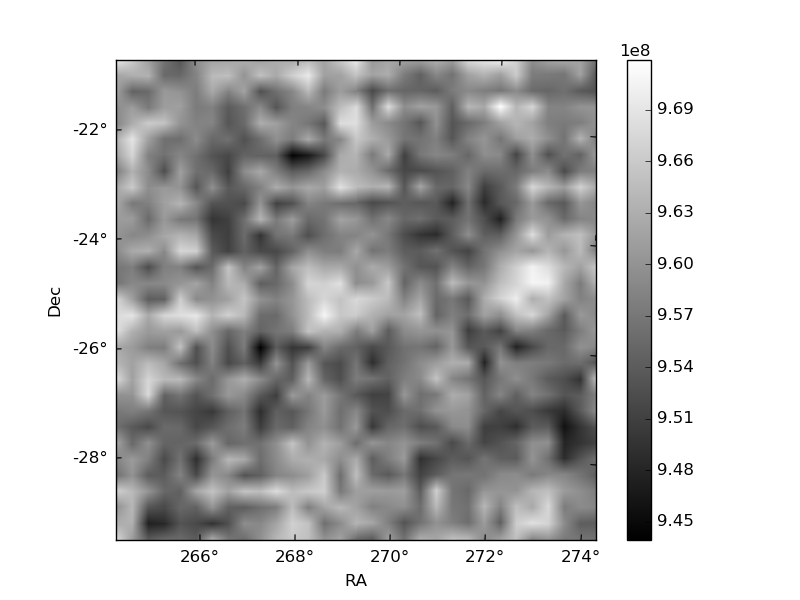
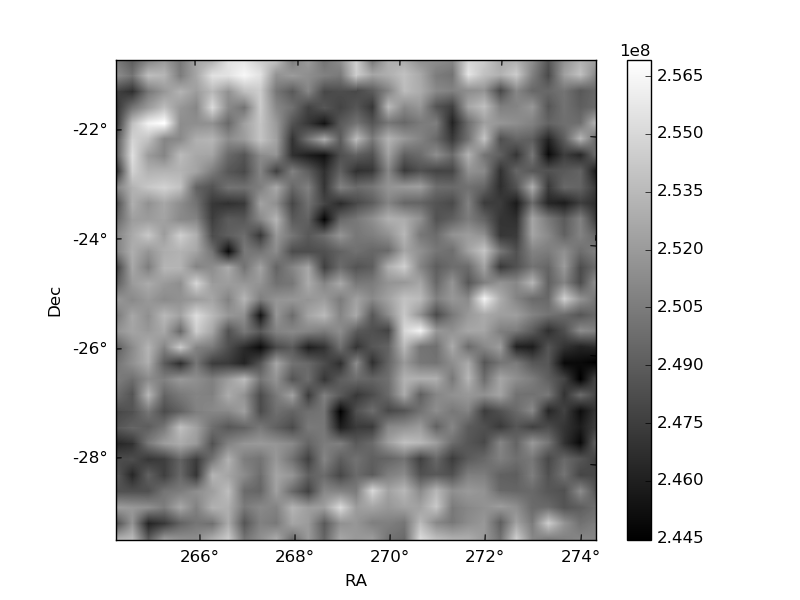
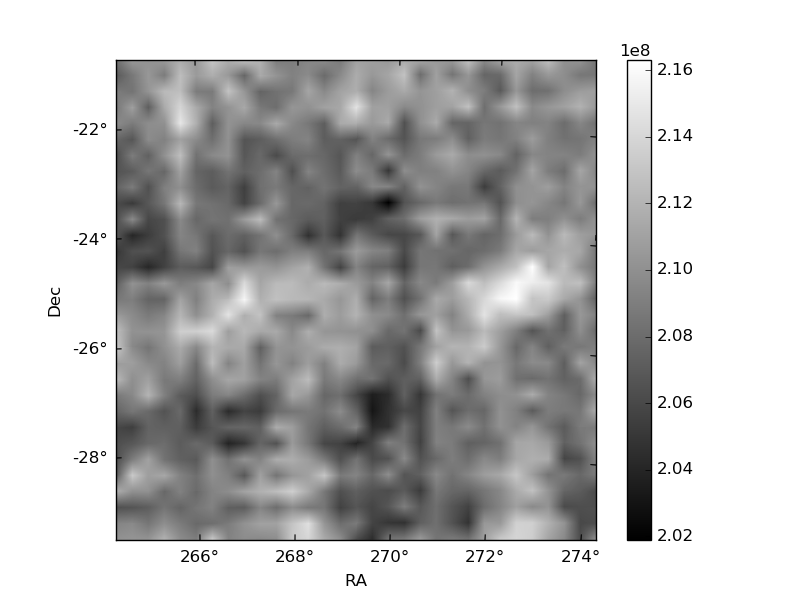
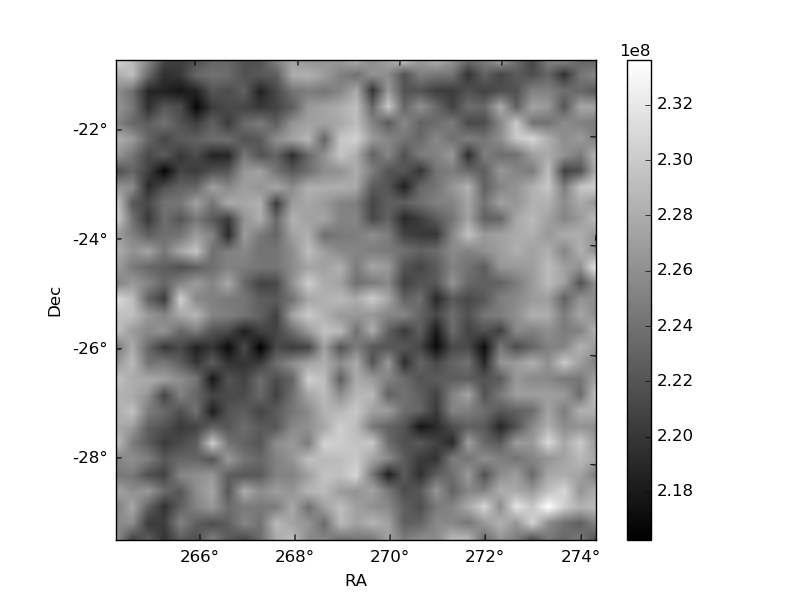
Histogram calculated using DETX and DETY for each event in the final _common_clean file
| Quadrant A | 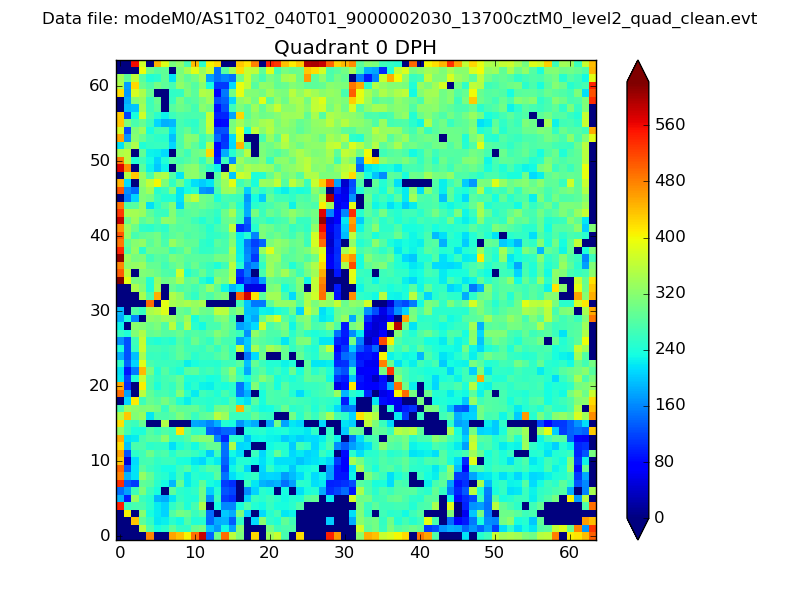 |
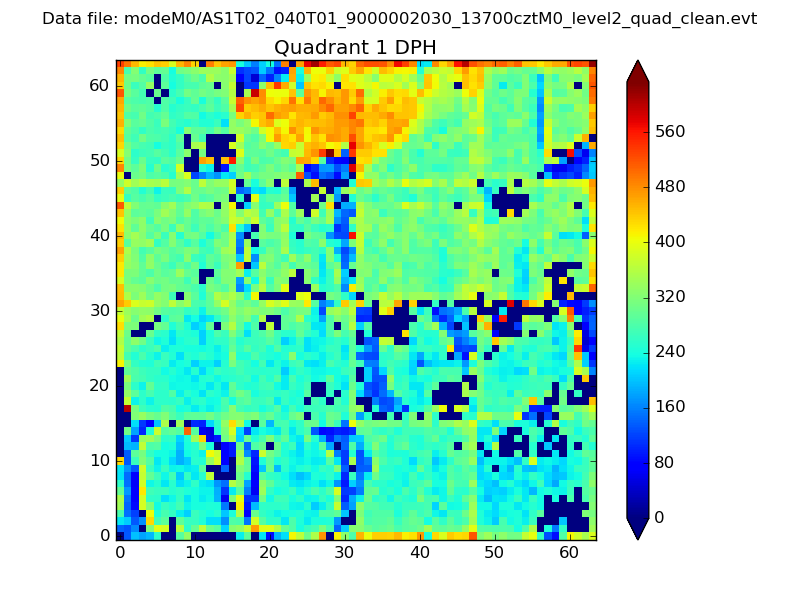 |
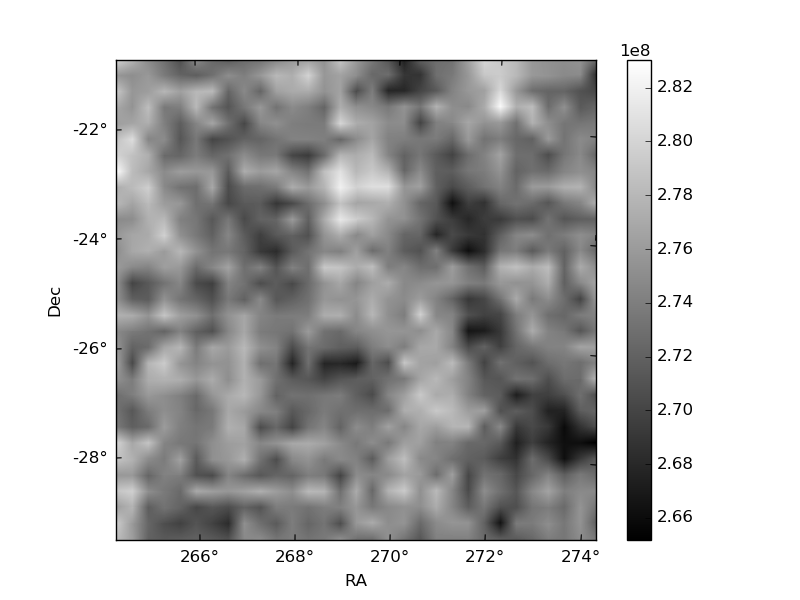
Quadrant B |
|---|---|---|---|
| Quadrant D | 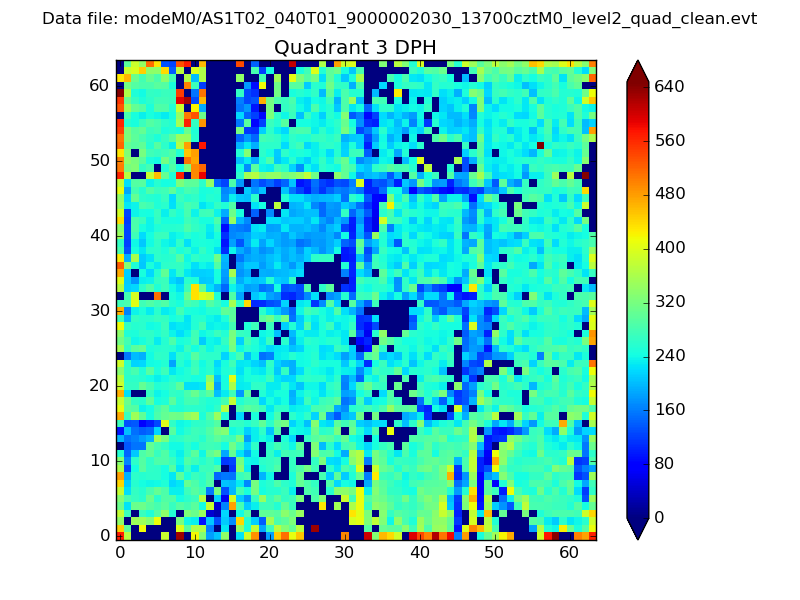 |
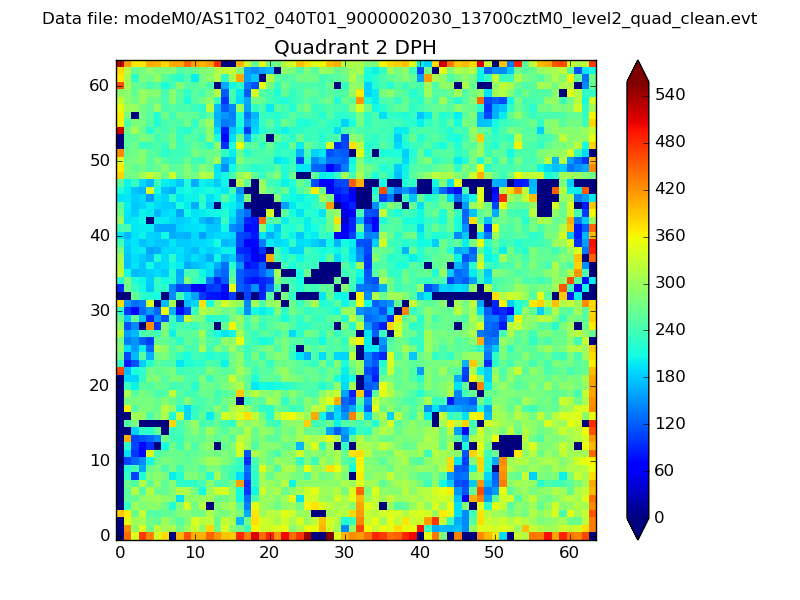 |
Quadrant C |
| Plot type | Count rate plots | Images |
|---|---|---|
| Comparison with Poisson distribution Blue bars denote a histogram of data divided into 1 sec bins. Red curve is a Poisson curve with rate = median count rate of data. |
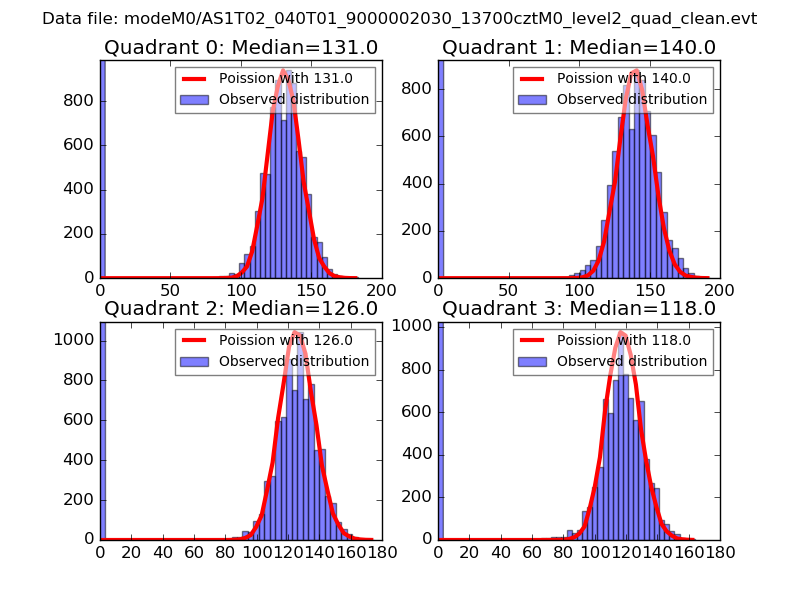 |
 |
| Quadrant-wise count rates Data is divided into 100 sec bins |
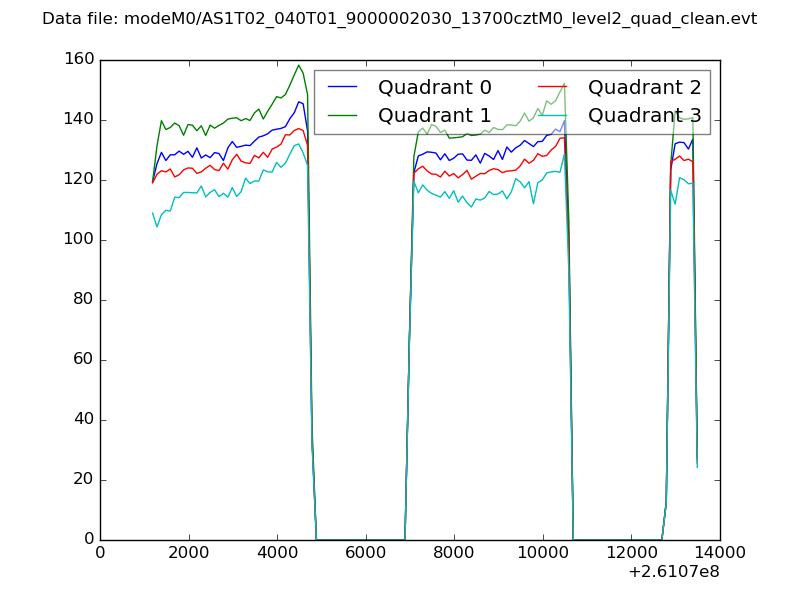 |
|
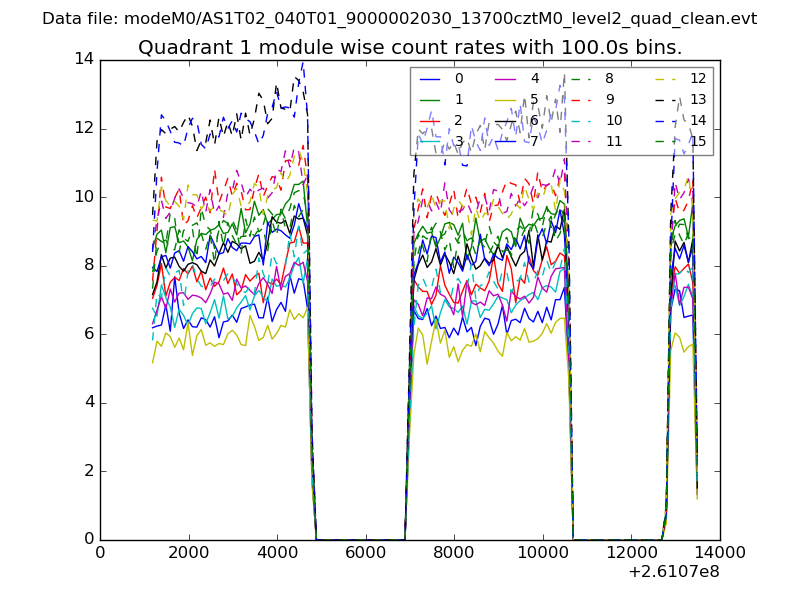
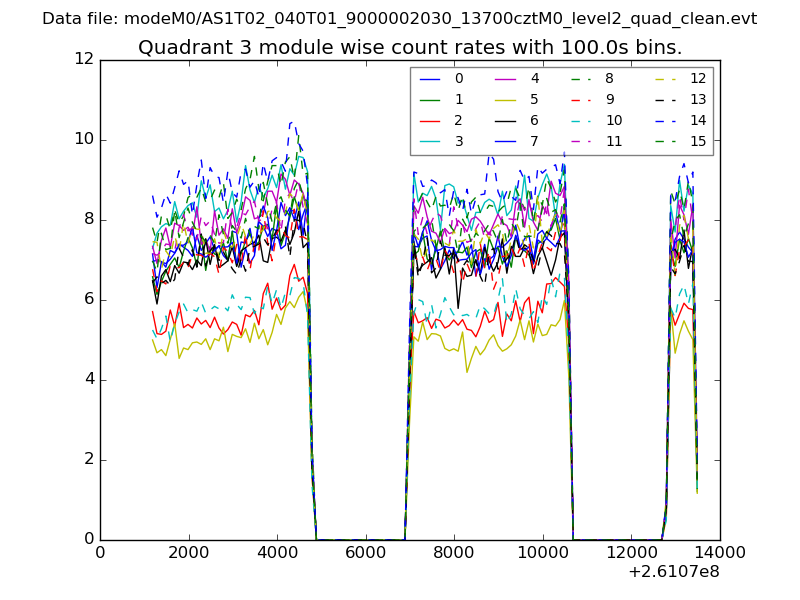
| Module-wise count rates for Quadrant A Data is divided into 100 sec bins |
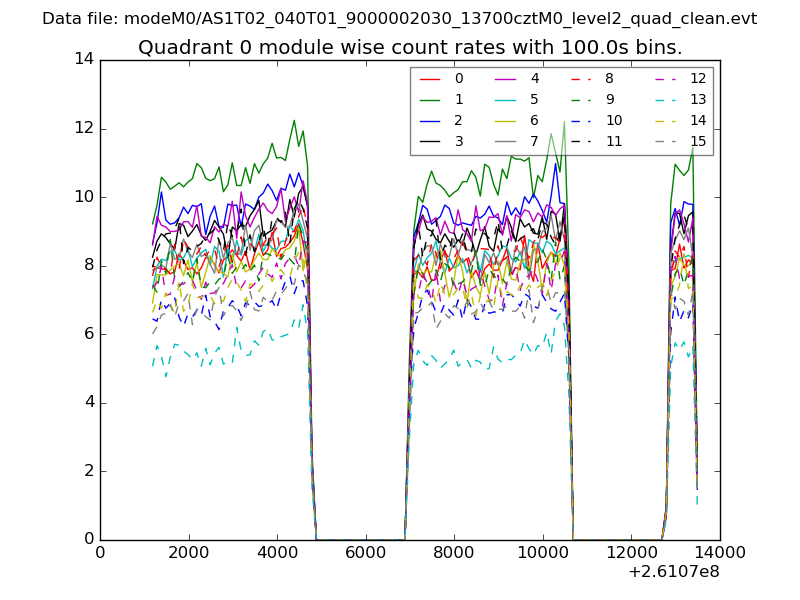 |
 |
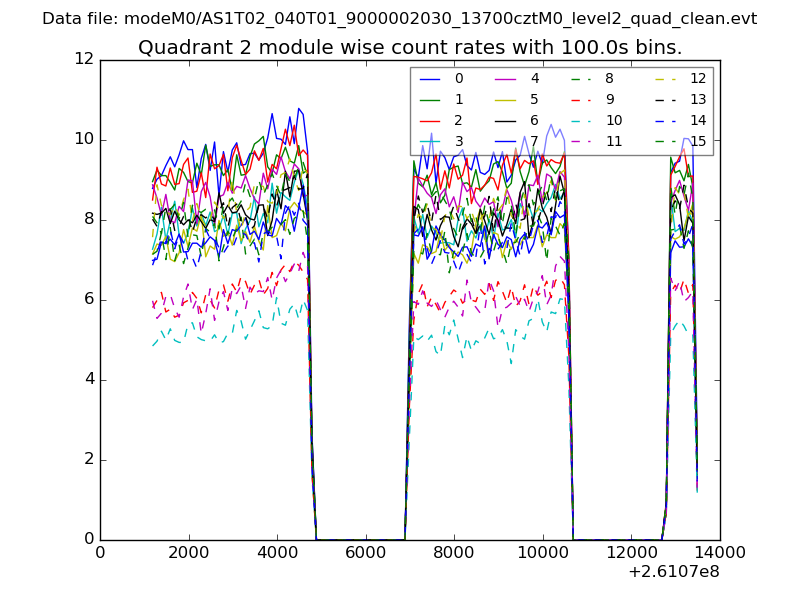
| Module-wise count rates for Quadrant B Data is divided into 100 sec bins |
 |
 |
| Module-wise count rates for Quadrant C Data is divided into 100 sec bins |
 |
 |
| Module-wise count rates for Quadrant D Data is divided into 100 sec bins |
 |
 |
| Parameter | Plot |
|---|---|
| CZT HV Monitor | 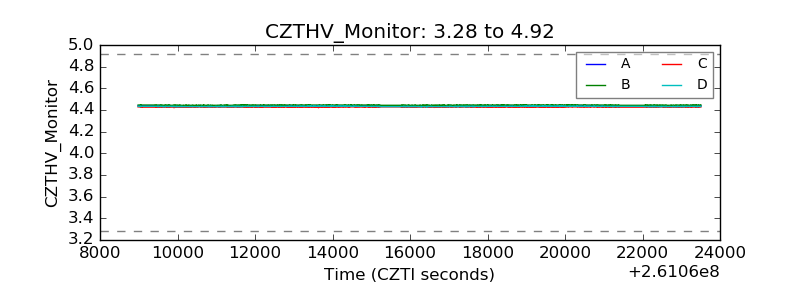 |
| D_VDD | 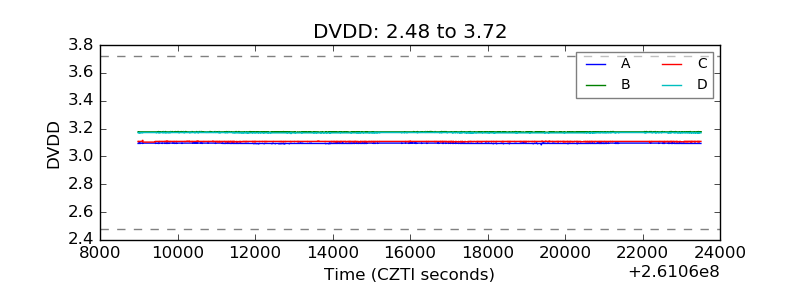 |
| Temperature 1 | 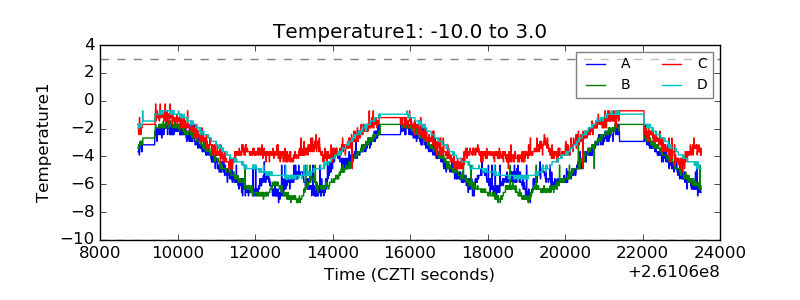 |
| Veto HV Monitor | 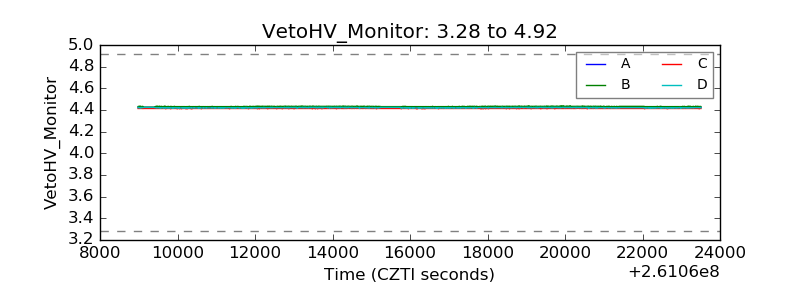 |
| Veto LLD | 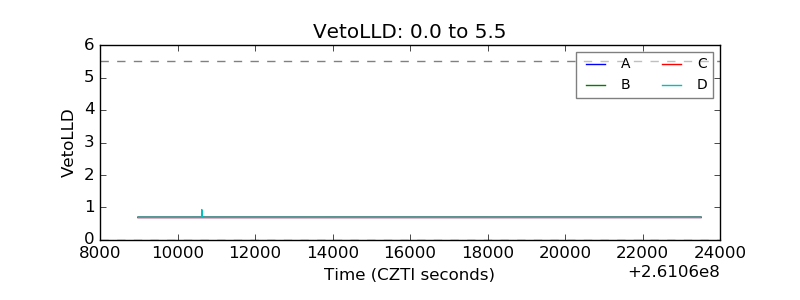 |
| Alpha Counter | 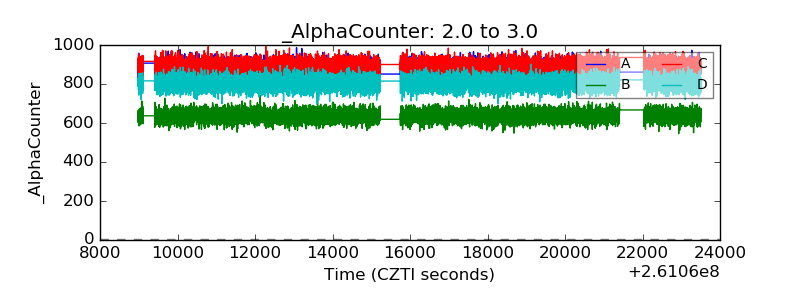 |
| _CPM_Rate | 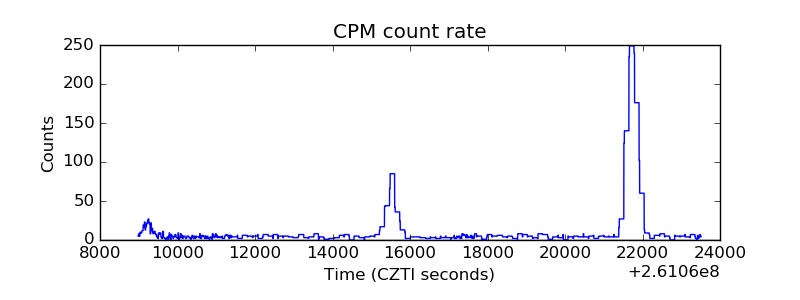 |
| CZT Counter | 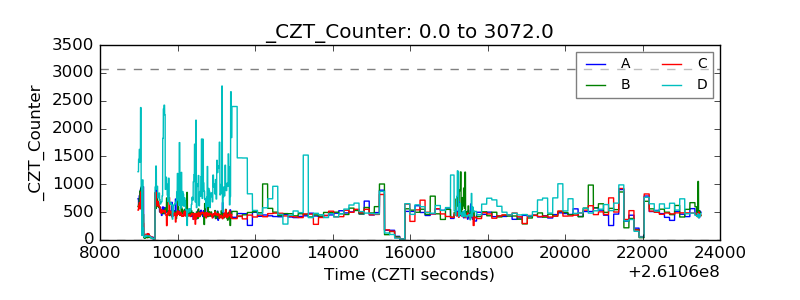 |
| +2.5 Volts monitor |  |
| +5 Volts monitor |  |
| _ROLL_ROT | 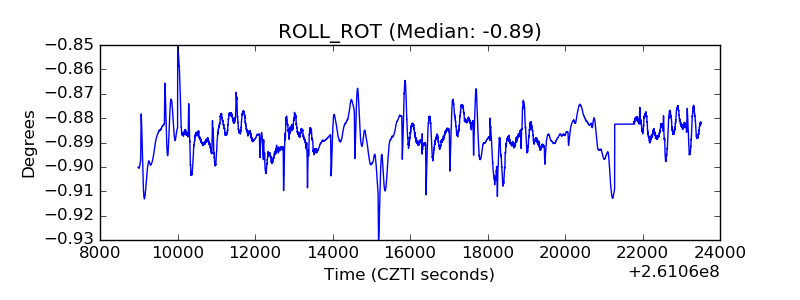 |
| _Roll_DEC | 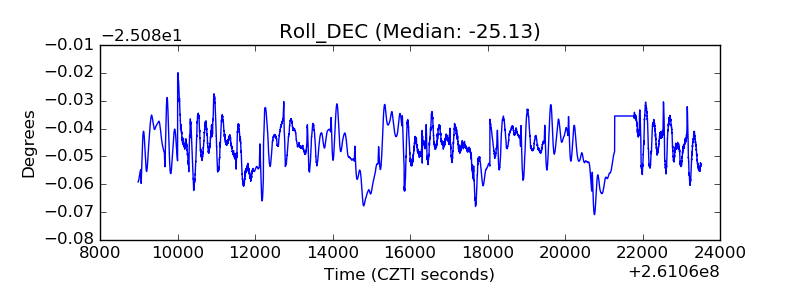 |
| _Roll_RA | 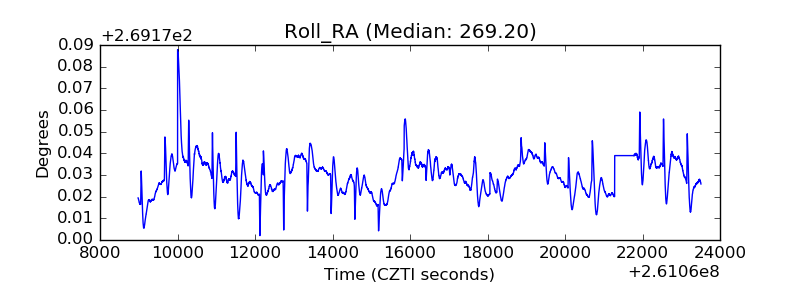 |
| Veto Counter | 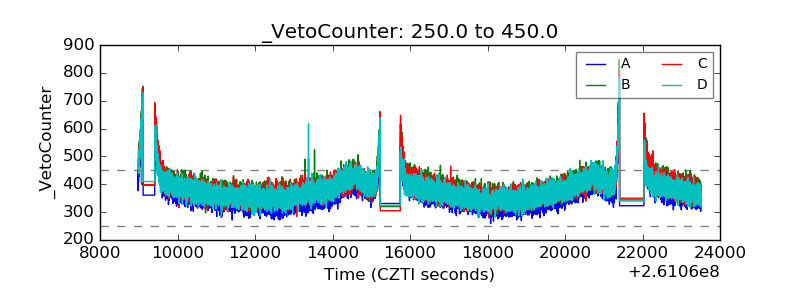 |