| Param | Original file | Final file |
|---|---|---|
| Filename | modeM0/AS1T02_040T01_9000002030_13701cztM0_level2.evt | modeM0/AS1T02_040T01_9000002030_13701cztM0_level2_quad_clean.evt |
| Size (bytes) | 541,549,440 | 96,557,760 |
| Size | 516.5 MB | 92.1 MB |
| Events in quadrant A | 3,704,755 | 610,933 |
| Events in quadrant B | 4,213,250 | 651,715 |
| Events in quadrant C | 3,620,307 | 587,842 |
| Events in quadrant D | 4,355,373 | 553,451 |
| Mode SS | |||
|---|---|---|---|
| Quadrant | BADHDUFLAG | Total packets | Discarded packets |
| A | 0 | 152 | 0 |
| B | 0 | 152 | 0 |
| C | 0 | 152 | 0 |
| D | 0 | 152 | 0 |
| Mode M0 | |||
|---|---|---|---|
| Quadrant | BADHDUFLAG | Total packets | Discarded packets |
| A | 0 | 15697 | 3 |
| B | 0 | 17066 | 2 |
| C | 0 | 15313 | 2 |
| D | 0 | 17893 | 2 |
| Mode M9 | |||
|---|---|---|---|
| Quadrant | BADHDUFLAG | Total packets | Discarded packets |
| A | 0 | 14 | 0 |
| B | 0 | 13 | 0 |
| C | 0 | 13 | 0 |
| D | 0 | 13 | 0 |
| Quadrant | Total seconds | Saturated seconds | Saturation percentage |
|---|---|---|---|
| A | 7474 | 84 | 1.123896% |
| B | 7474 | 172 | 2.301311% |
| C | 7474 | 58 | 0.776024% |
| D | 7474 | 132 | 1.766123% |
Noise dominated data is calculated using 1-second bins in cleaned event files. If a bin has >2000 counts, and if more than 50% of those come from <1% of pixels, then it is considered to be noise-dominated and hence unusable.
| Quadrant | # 1 sec bins | Bins with >0 counts | Bins with >2000 counts | High rate bins dominated by noise | Noise dominated (total time) | Noise dominated (detector-on time) | Marked lightcurve |
|---|---|---|---|---|---|---|---|
| A | 8935 | 7477 | 4 | 4 | 0.04% | 0.05% | 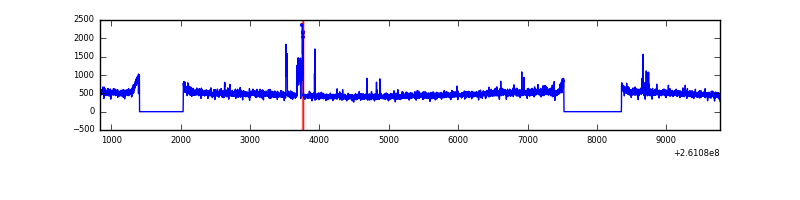 |
| B | 8935 | 7477 | 38 | 38 | 0.43% | 0.51% | 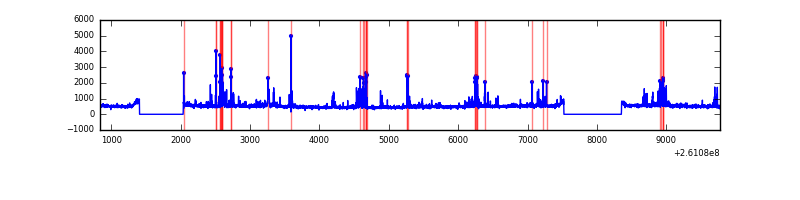 |
| C | 8935 | 7477 | 0 | 0 | 0.00% | 0.00% | 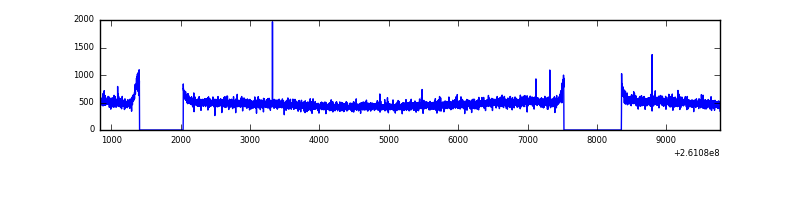 |
| D | 8935 | 7477 | 53 | 53 | 0.59% | 0.71% | 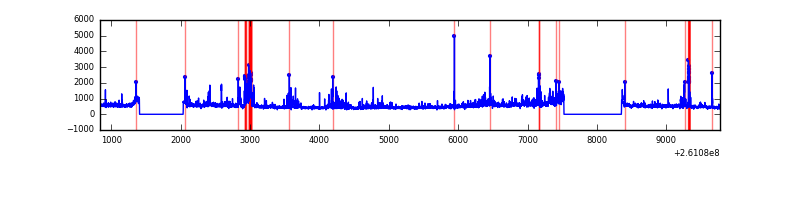 |
Top three noisy pixels from each quadrant. If the there are fewer than three noisy pixels in the level2.evt file, extra rows are filled as -1
| Pixel properties | Quadrant properties | ||||||
|---|---|---|---|---|---|---|---|
| Quadrant | DetID | PixID | Counts | Sigma | Mean | Median | Sigma |
| A | 11 | 29 | 97334 | 507.07 | 927 | 906 | 190.2 |
| A | 15 | 69 | 18376 | 91.87 | 927 | 906 | 190.2 |
| A | 1 | 162 | 15864 | 78.66 | 927 | 906 | 190.2 |
| B | 0 | 219 | 344822 | 1927.93 | 936 | 919 | 178.4 |
| B | 4 | 48 | 175404 | 978.17 | 936 | 919 | 178.4 |
| B | 12 | 111 | 20481 | 109.67 | 936 | 919 | 178.4 |
| C | 3 | 233 | 129593 | 618.67 | 893 | 900 | 208.0 |
| C | 14 | 234 | 7389 | 31.19 | 893 | 900 | 208.0 |
| C | 13 | 61 | 6376 | 26.33 | 893 | 900 | 208.0 |
| D | 1 | 52 | 397915 | 1855.84 | 883 | 859 | 213.9 |
| D | 5 | 222 | 273010 | 1272.04 | 883 | 859 | 213.9 |
| D | 8 | 195 | 117217 | 543.86 | 883 | 859 | 213.9 |
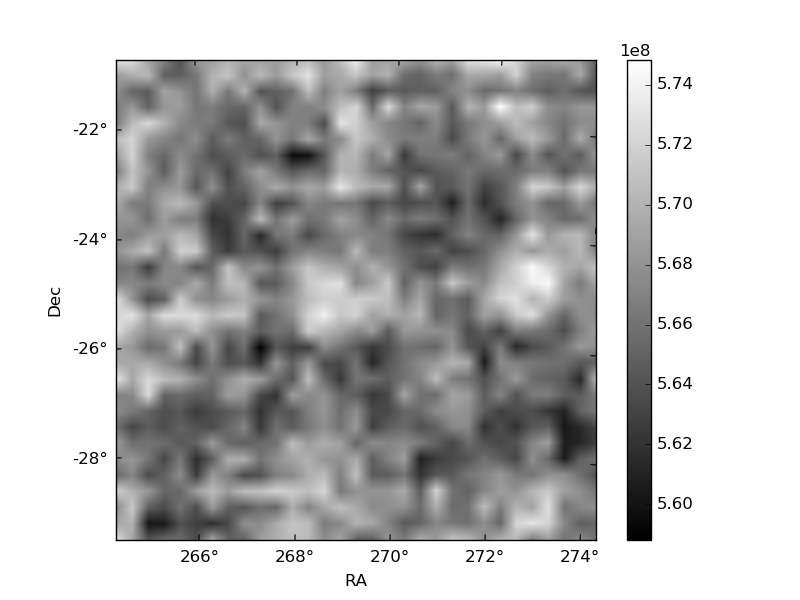
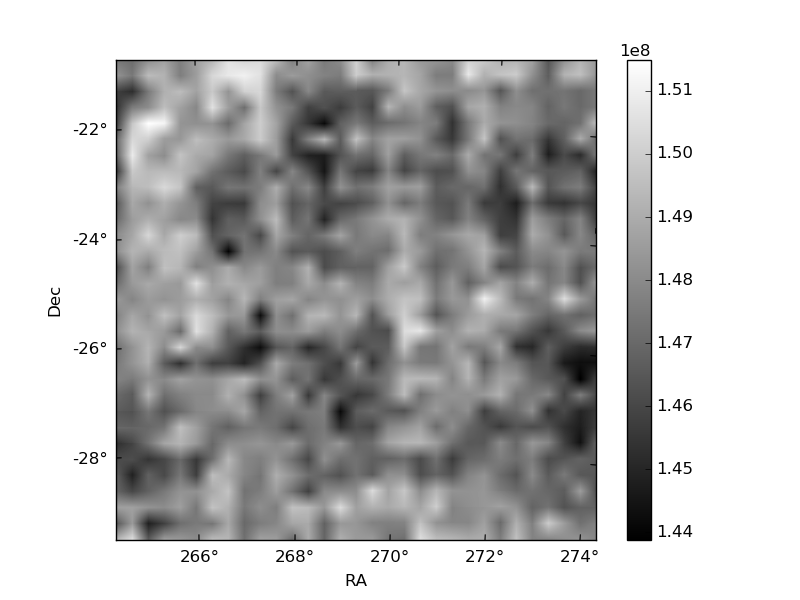
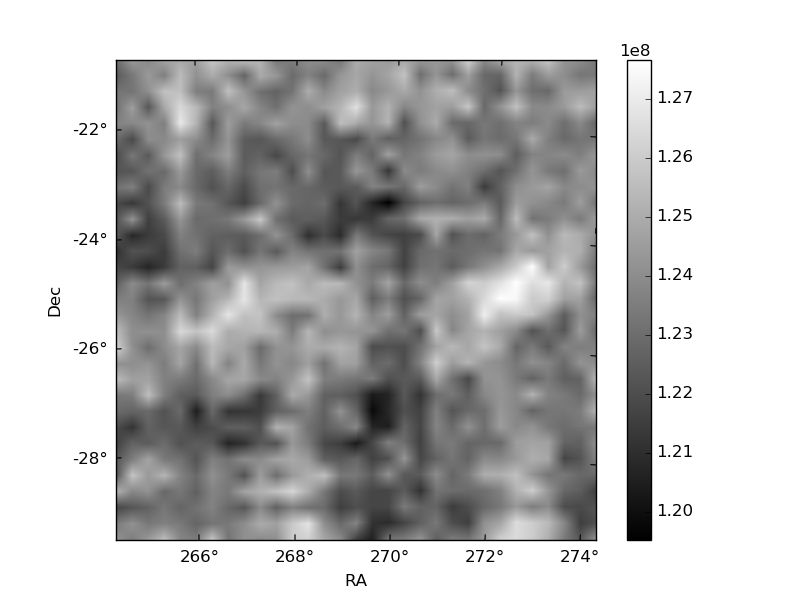
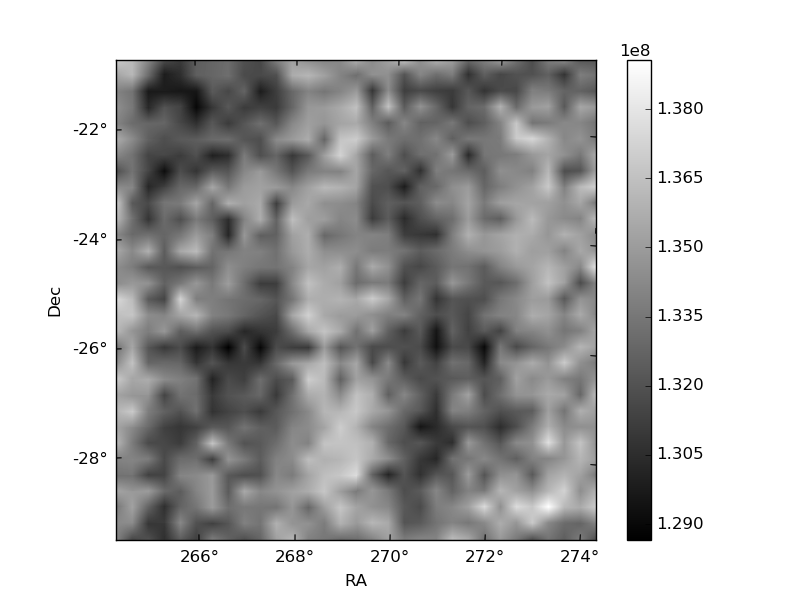
Histogram calculated using DETX and DETY for each event in the final _common_clean file
| Quadrant A | 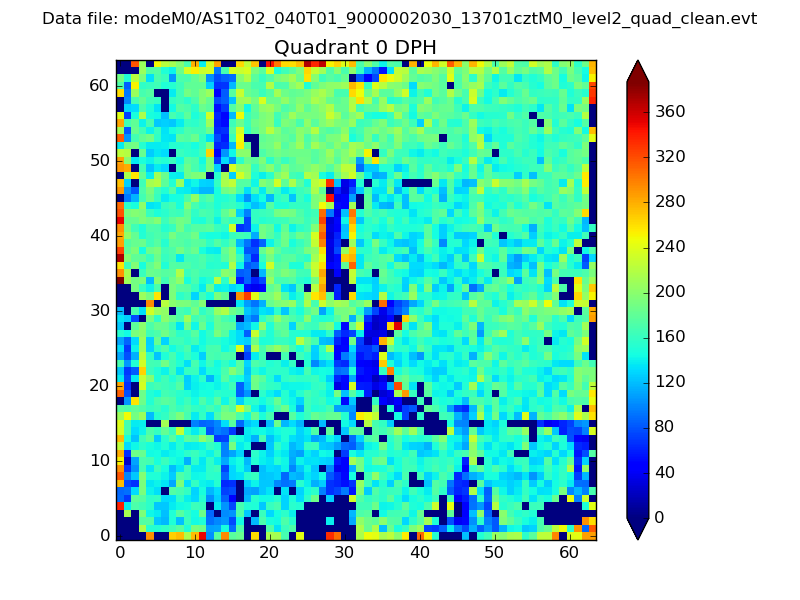 |
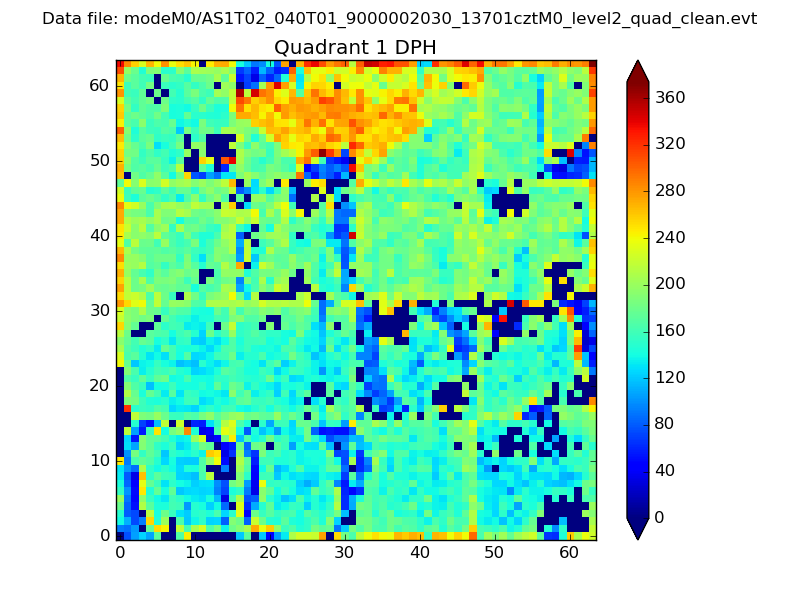 |
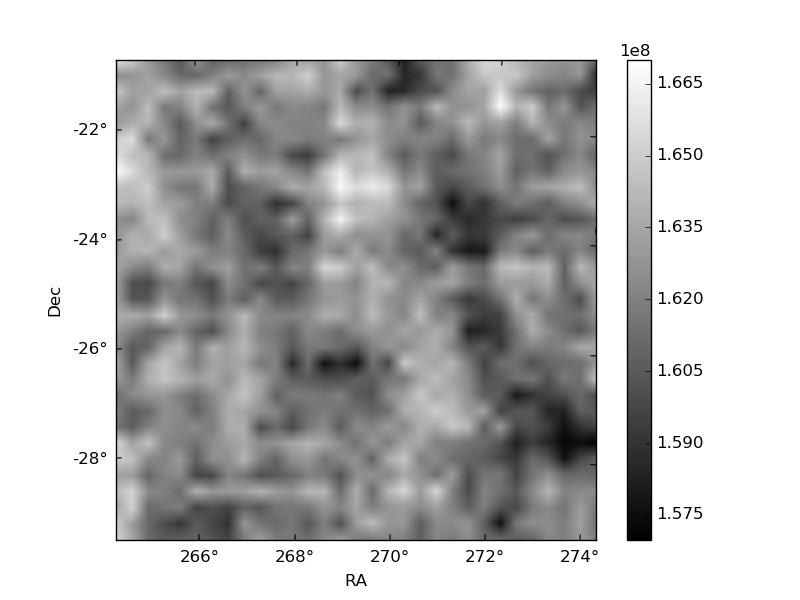
Quadrant B |
|---|---|---|---|
| Quadrant D | 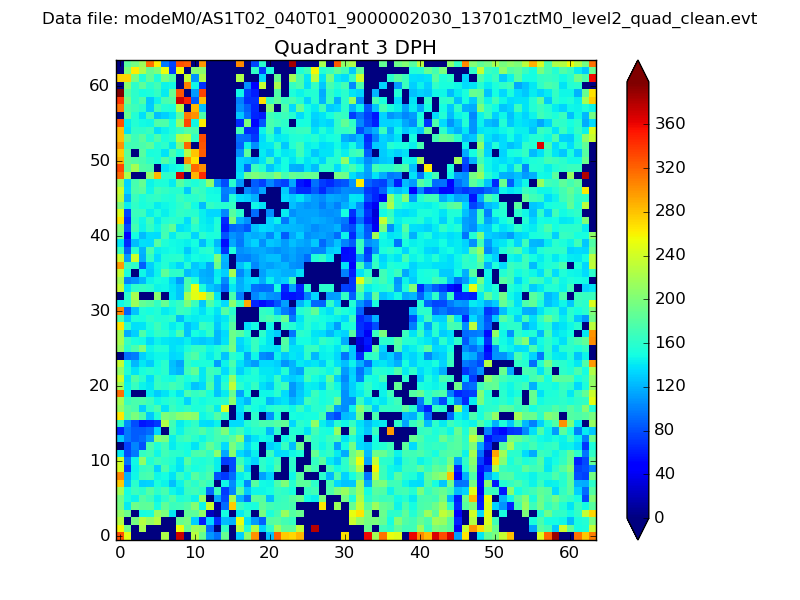 |
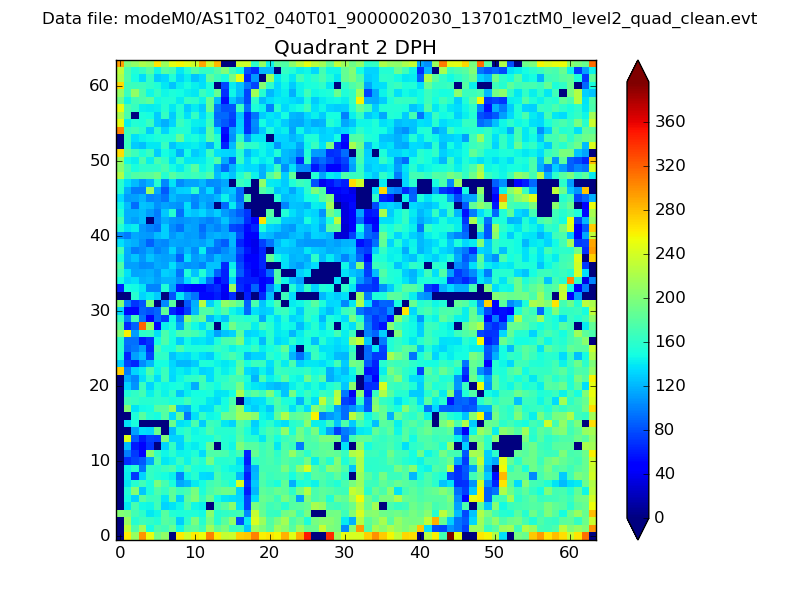 |
Quadrant C |
| Plot type | Count rate plots | Images |
|---|---|---|
| Comparison with Poisson distribution Blue bars denote a histogram of data divided into 1 sec bins. Red curve is a Poisson curve with rate = median count rate of data. |
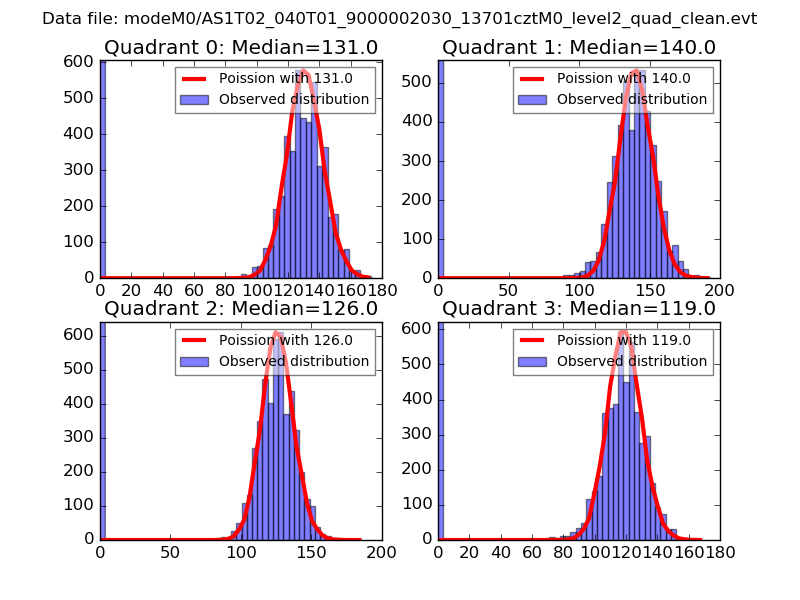 |
 |
| Quadrant-wise count rates Data is divided into 100 sec bins |
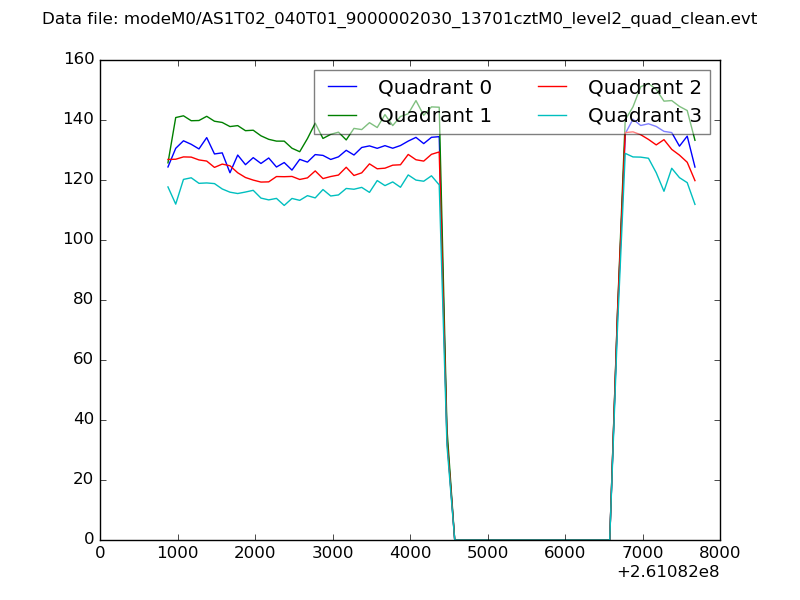 |
|
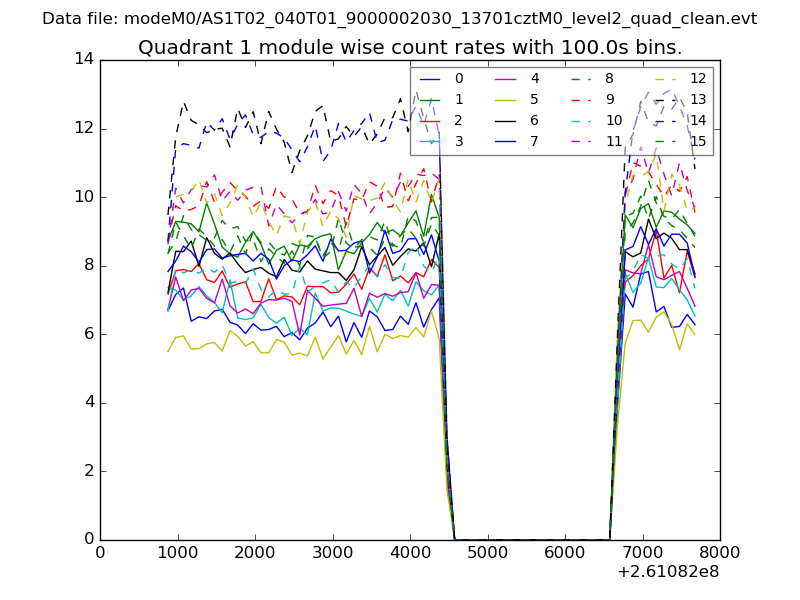
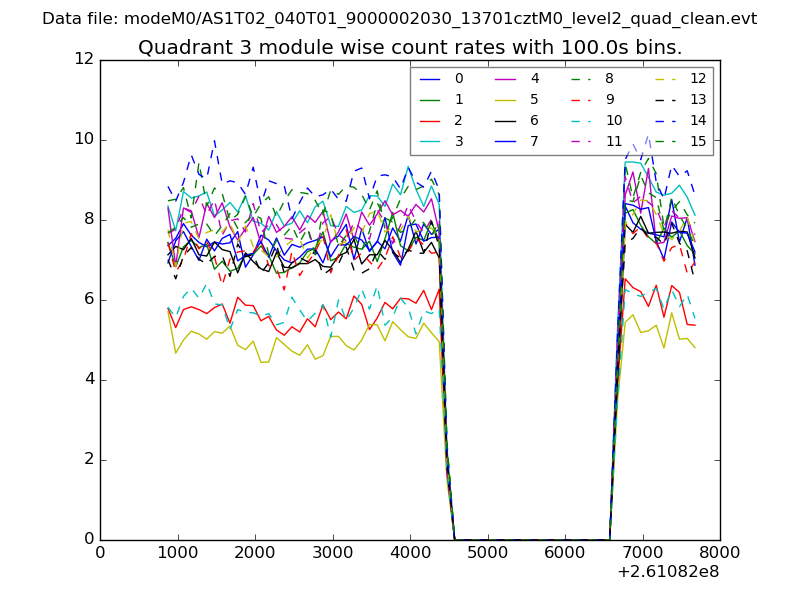
| Module-wise count rates for Quadrant A Data is divided into 100 sec bins |
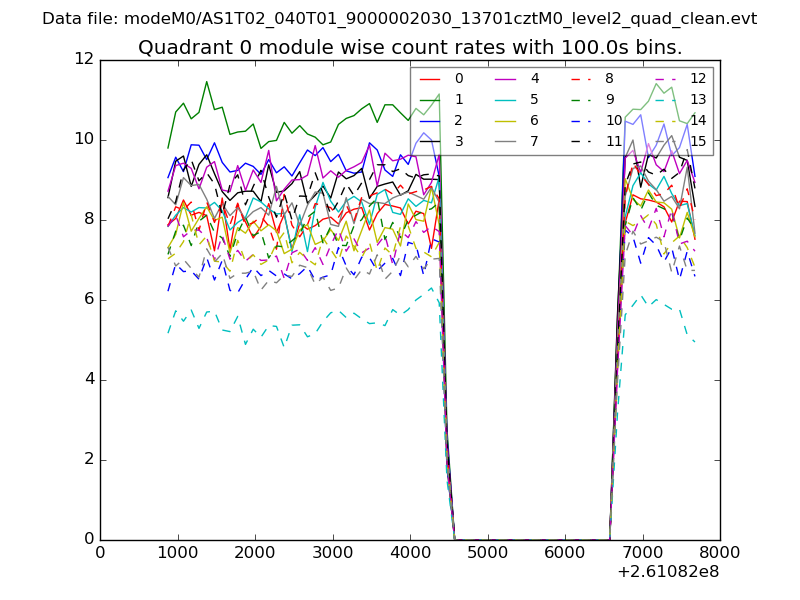 |
 |
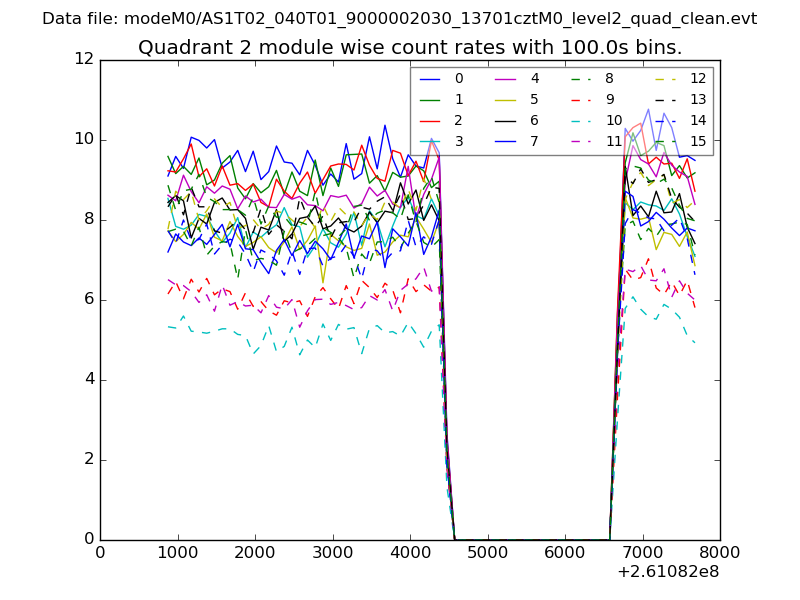
| Module-wise count rates for Quadrant B Data is divided into 100 sec bins |
 |
 |
| Module-wise count rates for Quadrant C Data is divided into 100 sec bins |
 |
 |
| Module-wise count rates for Quadrant D Data is divided into 100 sec bins |
 |
 |
| Parameter | Plot |
|---|---|
| CZT HV Monitor | 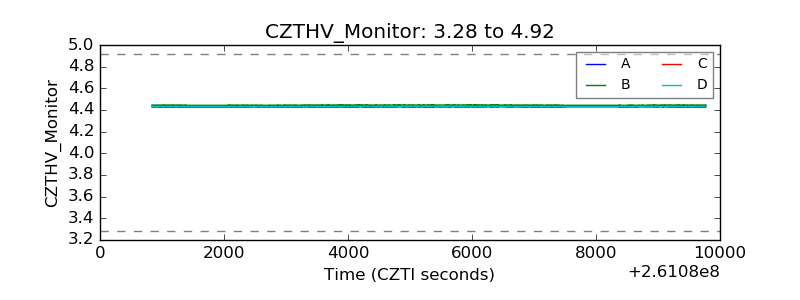 |
| D_VDD | 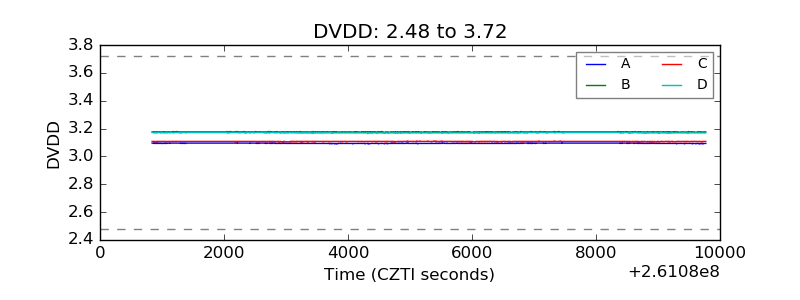 |
| Temperature 1 | 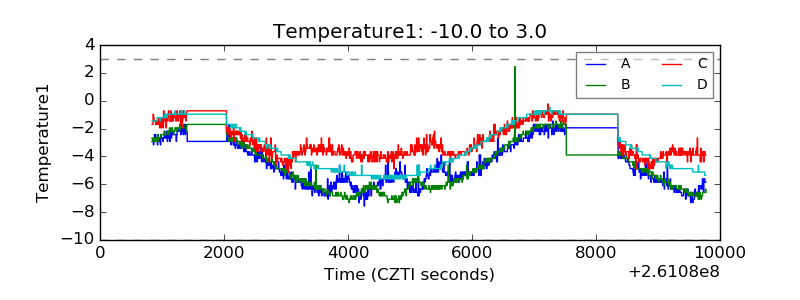 |
| Veto HV Monitor | 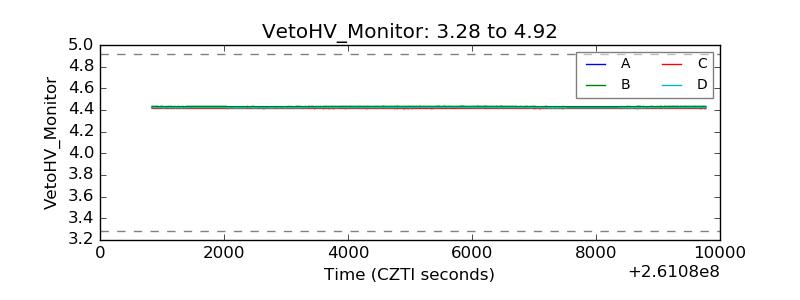 |
| Veto LLD |  |
| Alpha Counter | 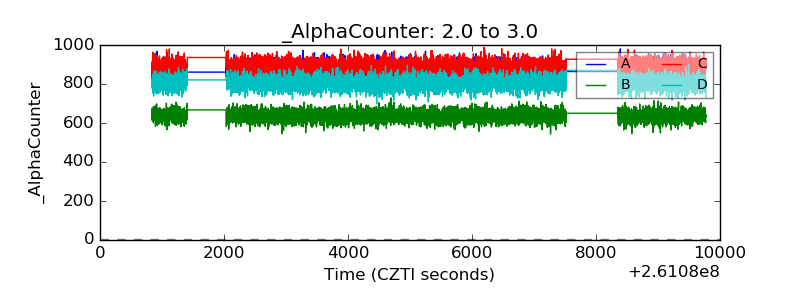 |
| _CPM_Rate | 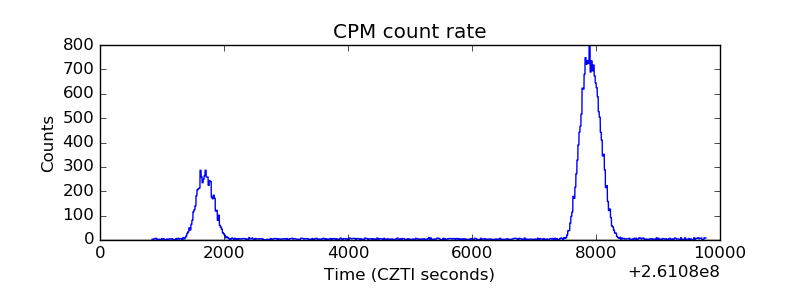 |
| CZT Counter | 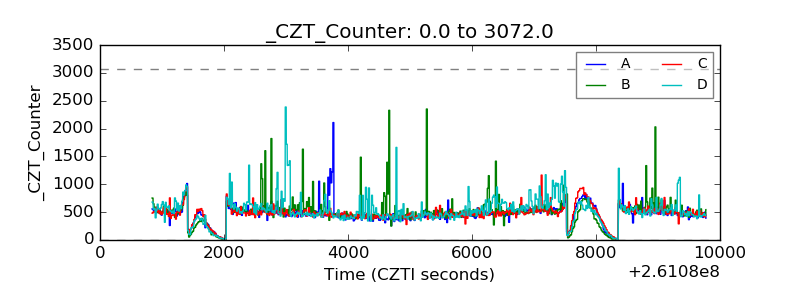 |
| +2.5 Volts monitor |  |
| +5 Volts monitor |  |
| _ROLL_ROT |  |
| _Roll_DEC | 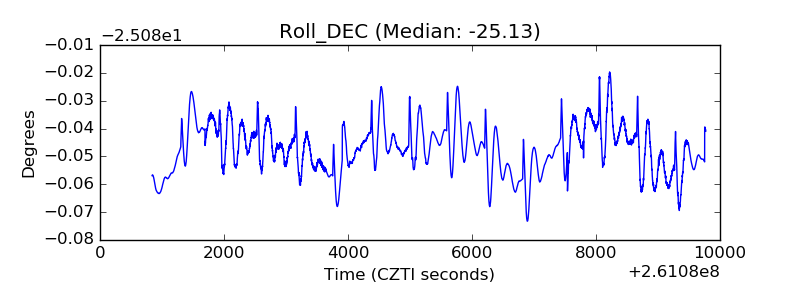 |
| _Roll_RA | 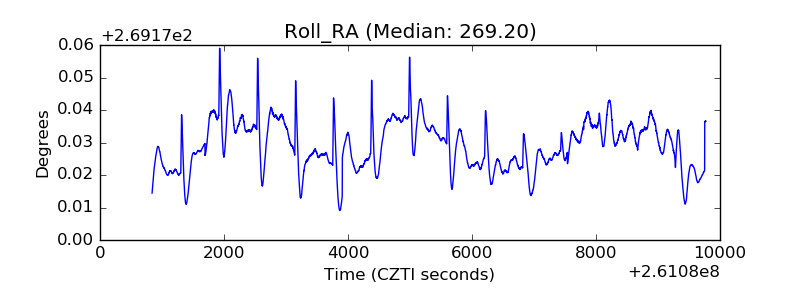 |
| Veto Counter | 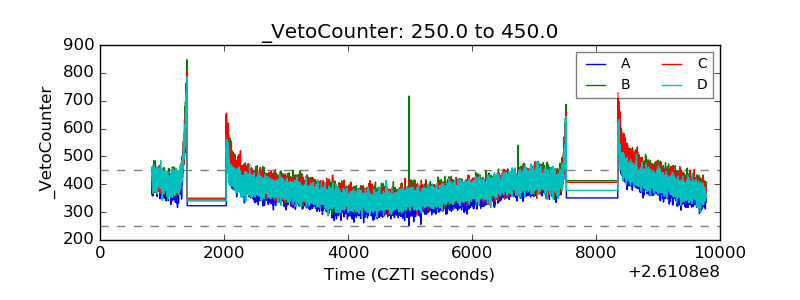 |