| Param | Original file | Final file |
|---|---|---|
| Filename | modeM0/AS1T02_040T01_9000002030_13702cztM0_level2.evt | modeM0/AS1T02_040T01_9000002030_13702cztM0_level2_quad_clean.evt |
| Size (bytes) | 469,972,800 | 102,110,400 |
| Size | 448.2 MB | 97.4 MB |
| Events in quadrant A | 3,179,723 | 666,471 |
| Events in quadrant B | 3,563,511 | 716,416 |
| Events in quadrant C | 3,242,943 | 645,459 |
| Events in quadrant D | 3,797,791 | 602,993 |
| Mode SS | |||
|---|---|---|---|
| Quadrant | BADHDUFLAG | Total packets | Discarded packets |
| A | 0 | 134 | 0 |
| B | 0 | 134 | 0 |
| C | 0 | 134 | 0 |
| D | 0 | 134 | 0 |
| Mode M0 | |||
|---|---|---|---|
| Quadrant | BADHDUFLAG | Total packets | Discarded packets |
| A | 0 | 13662 | 3 |
| B | 0 | 14807 | 2 |
| C | 0 | 13611 | 2 |
| D | 0 | 15726 | 2 |
| Mode M9 | |||
|---|---|---|---|
| Quadrant | BADHDUFLAG | Total packets | Discarded packets |
| A | 0 | 13 | 0 |
| B | 0 | 13 | 0 |
| C | 0 | 13 | 0 |
| D | 0 | 14 | 0 |
| Quadrant | Total seconds | Saturated seconds | Saturation percentage |
|---|---|---|---|
| A | 6615 | 26 | 0.393046% |
| B | 6615 | 86 | 1.300076% |
| C | 6615 | 23 | 0.347695% |
| D | 6615 | 110 | 1.662887% |
Noise dominated data is calculated using 1-second bins in cleaned event files. If a bin has >2000 counts, and if more than 50% of those come from <1% of pixels, then it is considered to be noise-dominated and hence unusable.
| Quadrant | # 1 sec bins | Bins with >0 counts | Bins with >2000 counts | High rate bins dominated by noise | Noise dominated (total time) | Noise dominated (detector-on time) | Marked lightcurve |
|---|---|---|---|---|---|---|---|
| A | 7616 | 6617 | 5 | 5 | 0.07% | 0.08% | 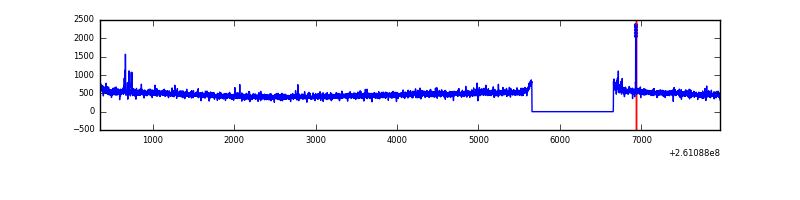 |
| B | 7616 | 6617 | 12 | 12 | 0.16% | 0.18% | 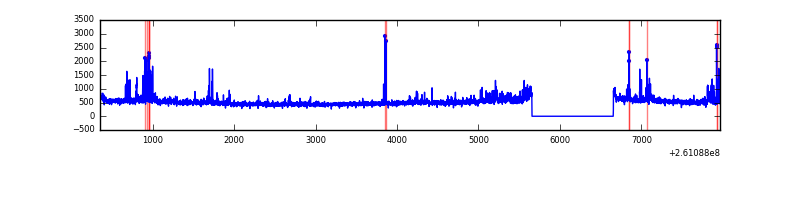 |
| C | 7616 | 6617 | 0 | 0 | 0.00% | 0.00% | 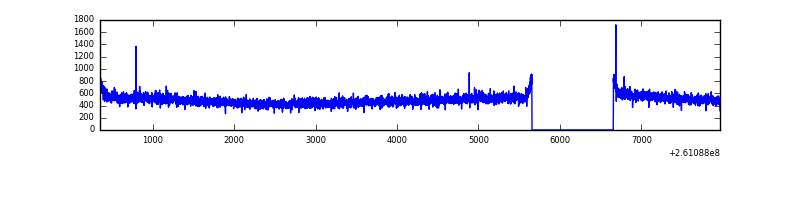 |
| D | 7616 | 6617 | 82 | 82 | 1.08% | 1.24% | 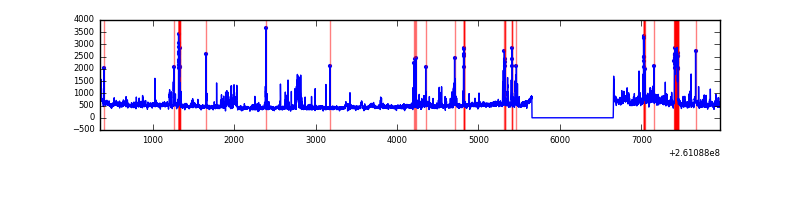 |
Top three noisy pixels from each quadrant. If the there are fewer than three noisy pixels in the level2.evt file, extra rows are filled as -1
| Pixel properties | Quadrant properties | ||||||
|---|---|---|---|---|---|---|---|
| Quadrant | DetID | PixID | Counts | Sigma | Mean | Median | Sigma |
| A | 15 | 69 | 27115 | 157.09 | 817 | 799 | 167.5 |
| A | 0 | 226 | 7172 | 38.04 | 817 | 799 | 167.5 |
| A | 1 | 162 | 6841 | 36.07 | 817 | 799 | 167.5 |
| B | 0 | 219 | 157616 | 981.29 | 833 | 816 | 159.8 |
| B | 0 | 189 | 52295 | 322.17 | 833 | 816 | 159.8 |
| B | 8 | 250 | 46754 | 287.49 | 833 | 816 | 159.8 |
| C | 3 | 233 | 144532 | 779.46 | 793 | 799 | 184.4 |
| C | 13 | 61 | 5651 | 26.31 | 793 | 799 | 184.4 |
| C | 14 | 234 | 4071 | 17.74 | 793 | 799 | 184.4 |
| D | 5 | 222 | 315897 | 1538.62 | 767 | 754 | 204.8 |
| D | 13 | 122 | 276437 | 1345.96 | 767 | 754 | 204.8 |
| D | 1 | 52 | 77516 | 374.77 | 767 | 754 | 204.8 |
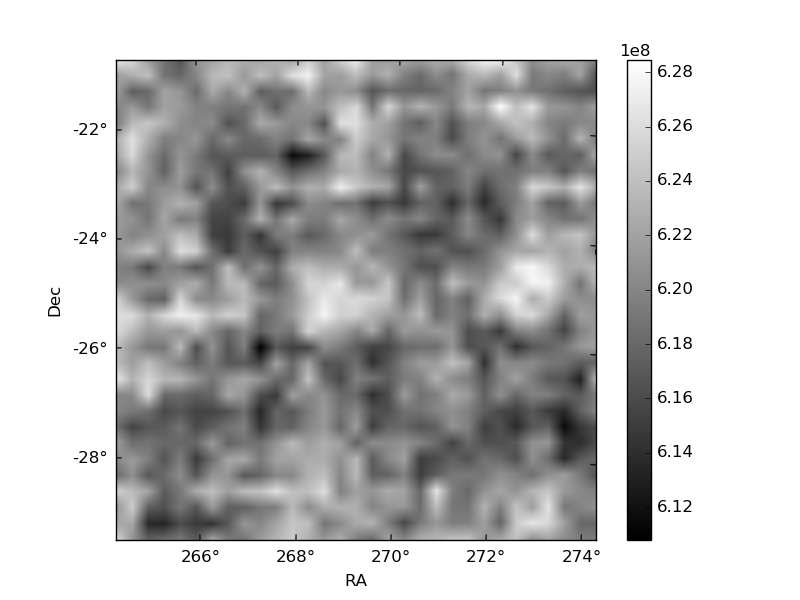
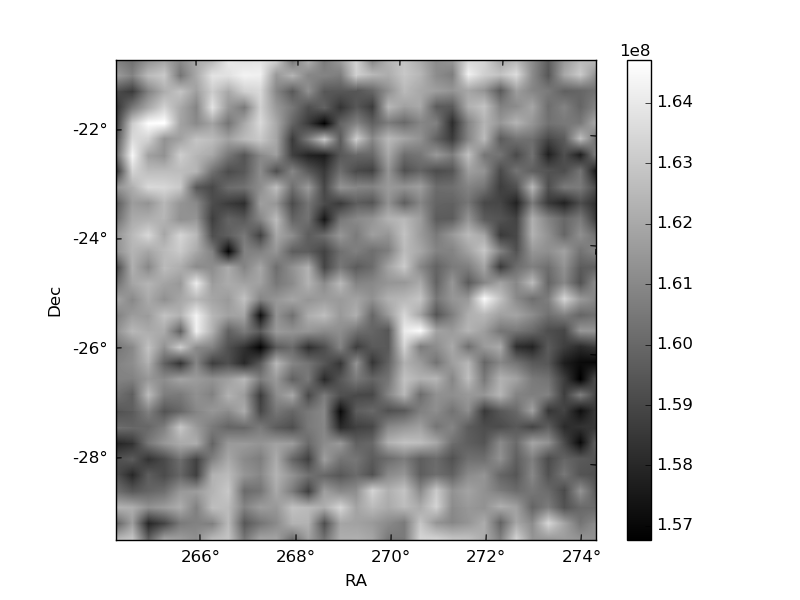
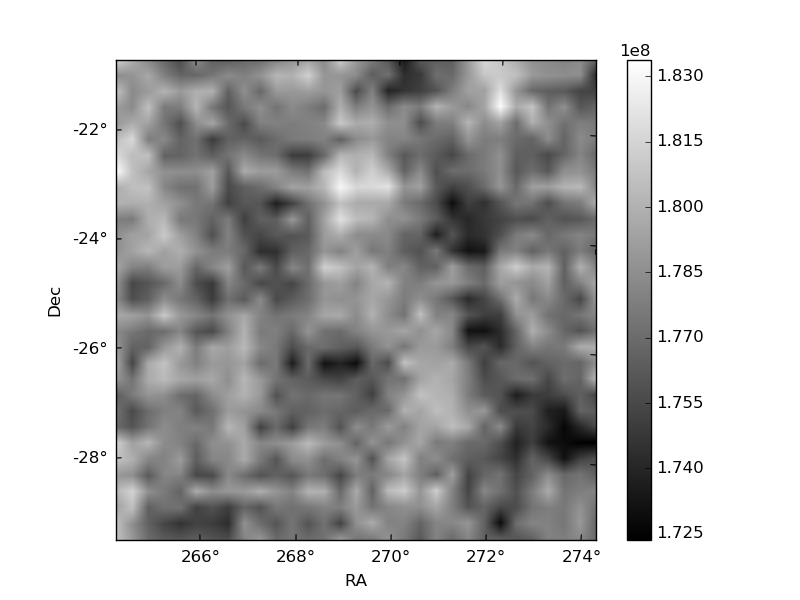
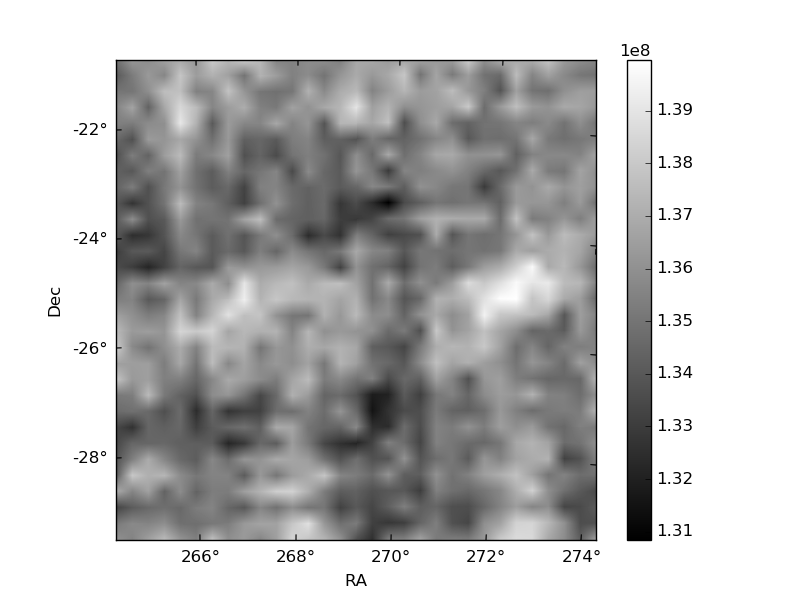
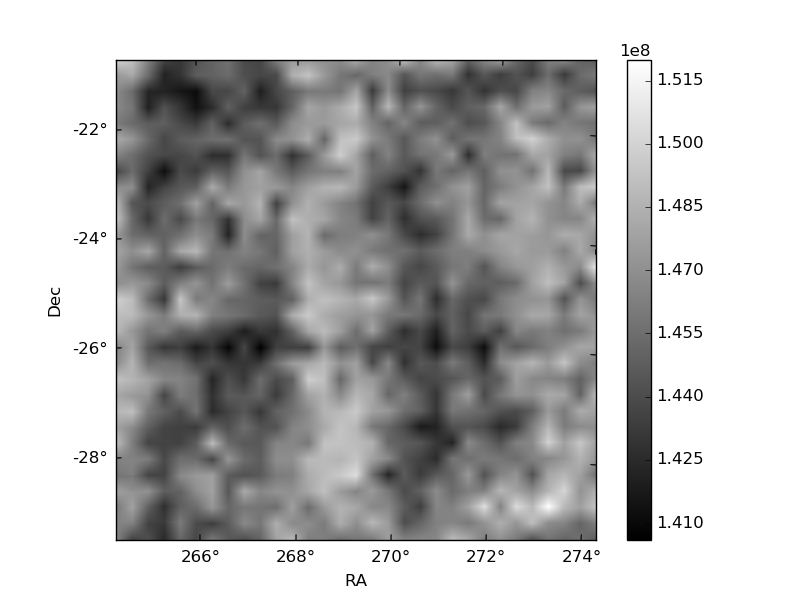
Histogram calculated using DETX and DETY for each event in the final _common_clean file
| Quadrant A | 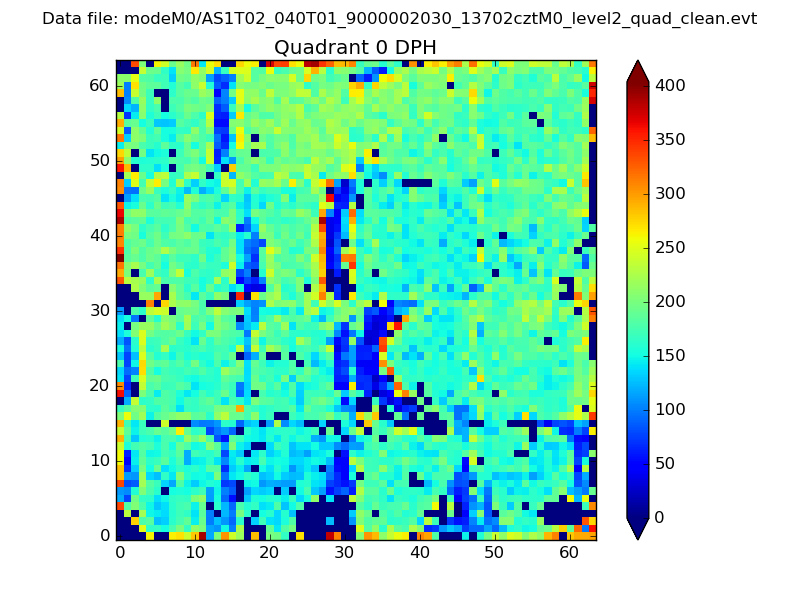 |
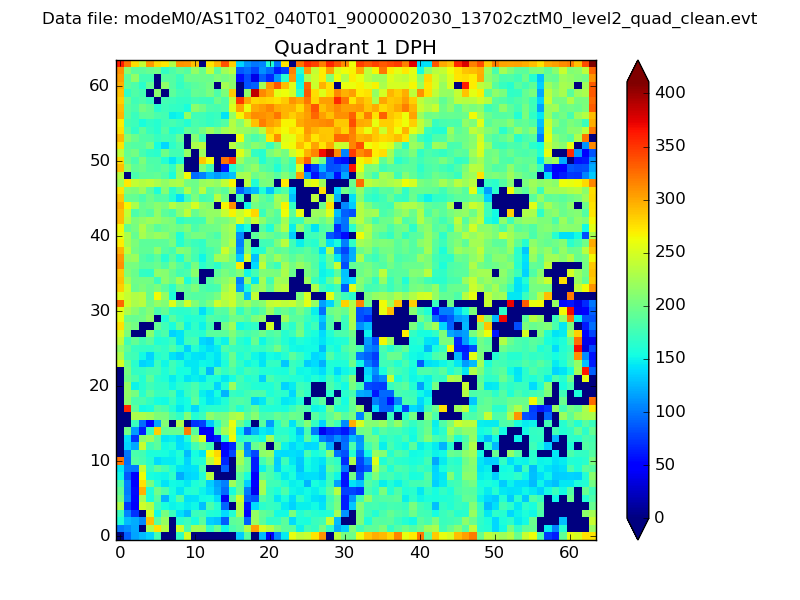 |
Quadrant B |
|---|---|---|---|
| Quadrant D | 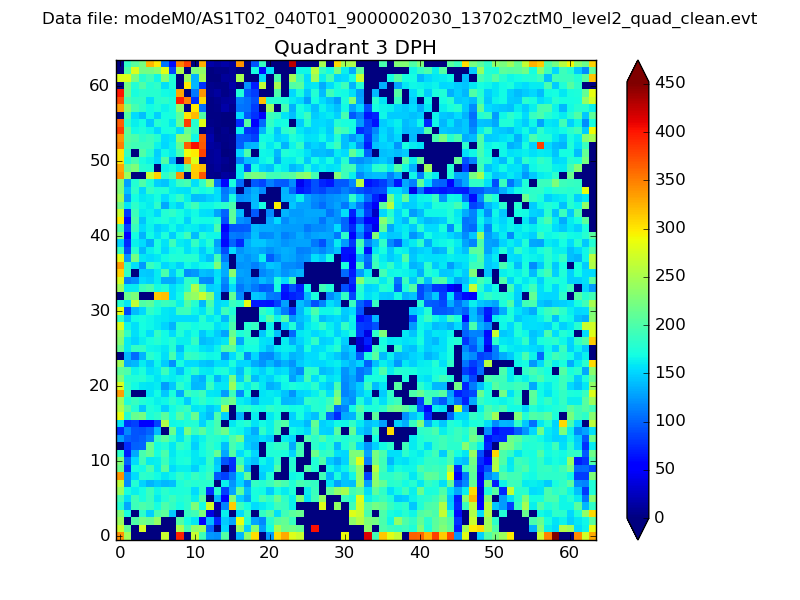 |
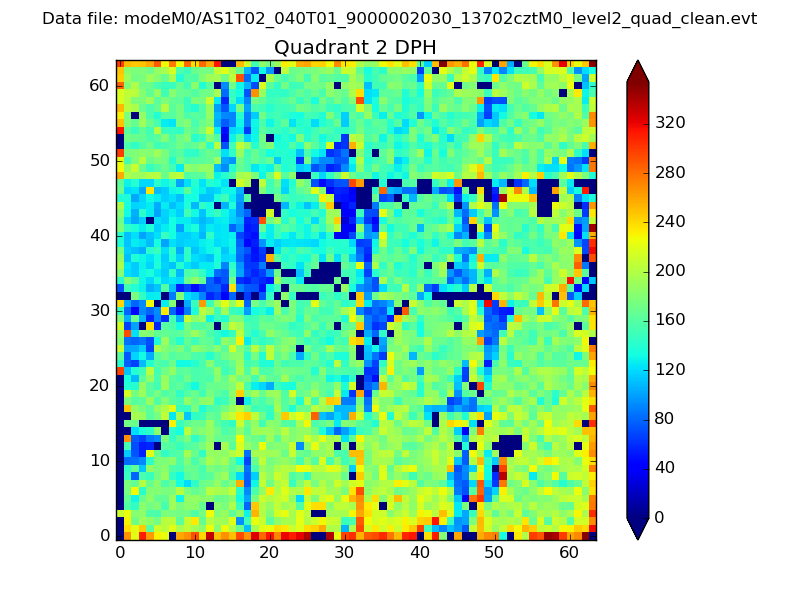 |
Quadrant C |
| Plot type | Count rate plots | Images |
|---|---|---|
| Comparison with Poisson distribution Blue bars denote a histogram of data divided into 1 sec bins. Red curve is a Poisson curve with rate = median count rate of data. |
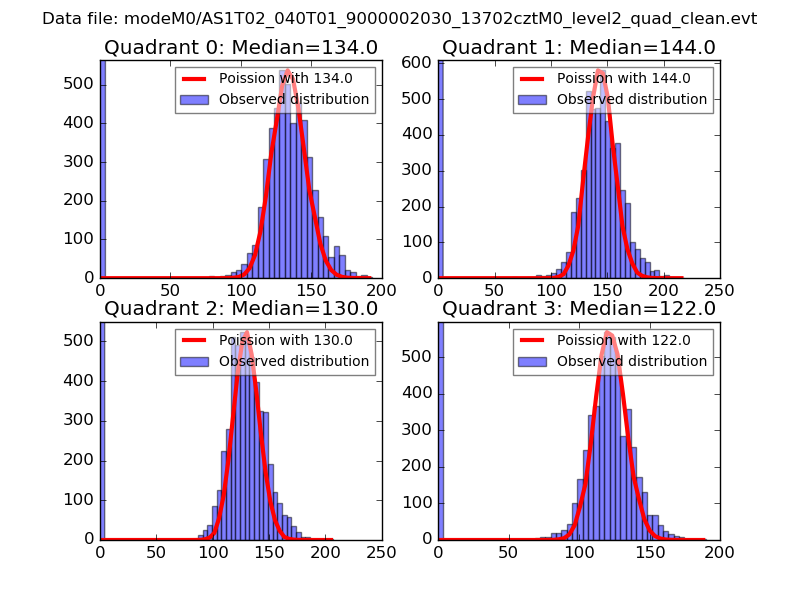 |
 |
| Quadrant-wise count rates Data is divided into 100 sec bins |
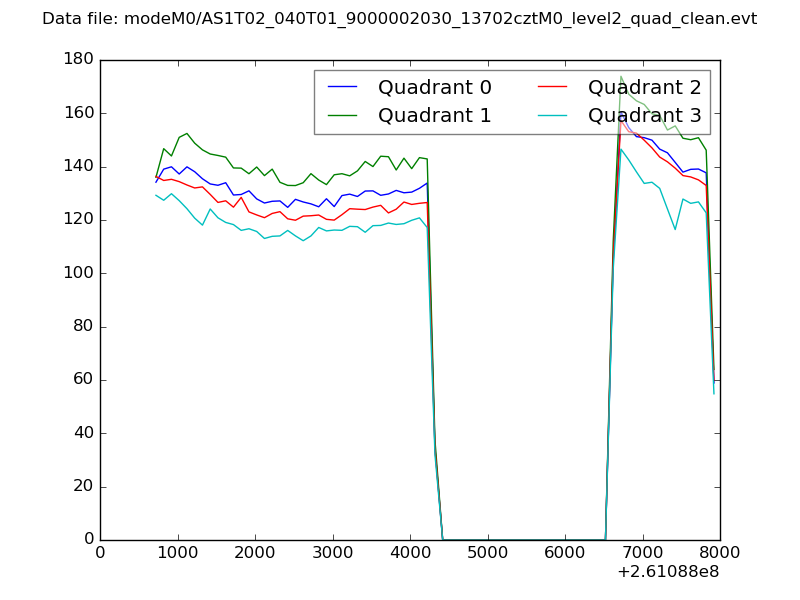 |
|
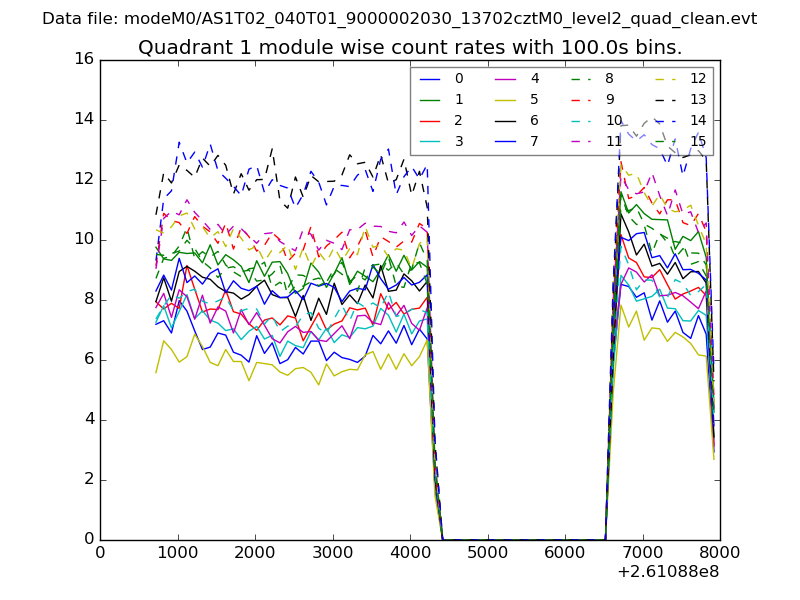
| Module-wise count rates for Quadrant A Data is divided into 100 sec bins |
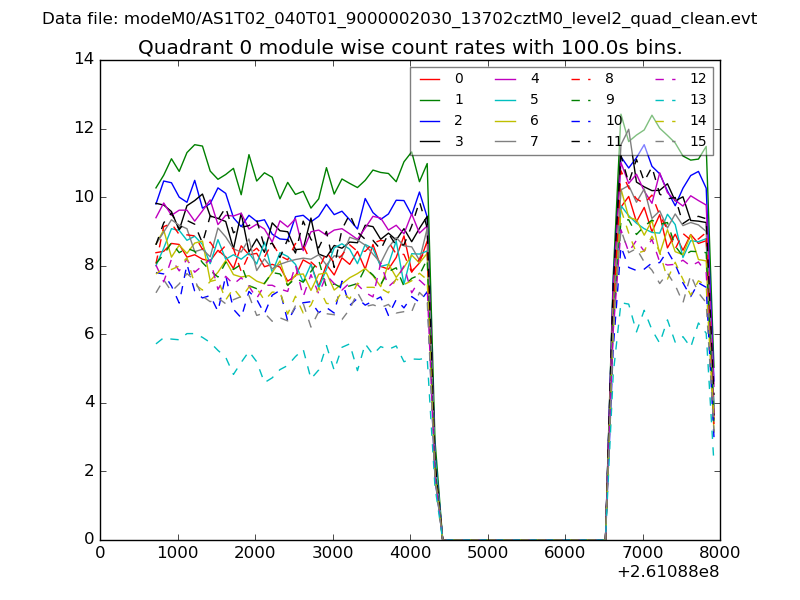 |
 |
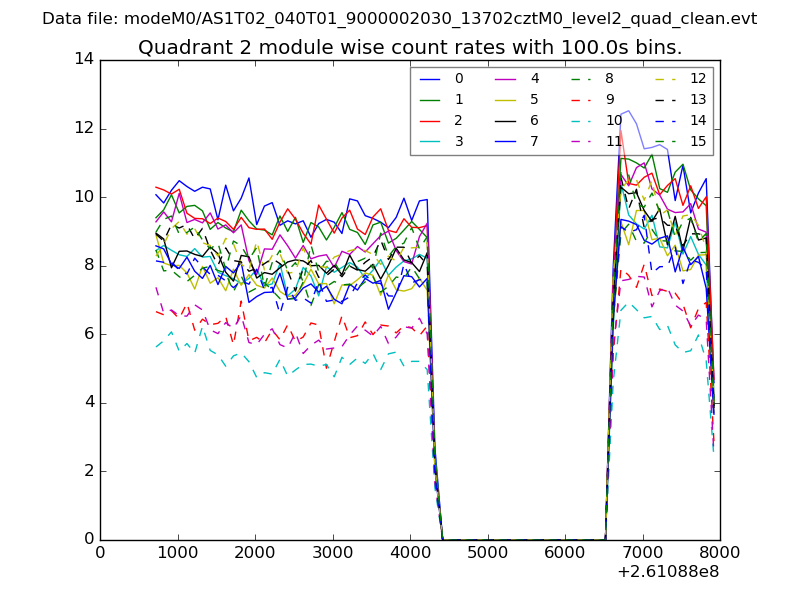
| Module-wise count rates for Quadrant B Data is divided into 100 sec bins |
 |
 |
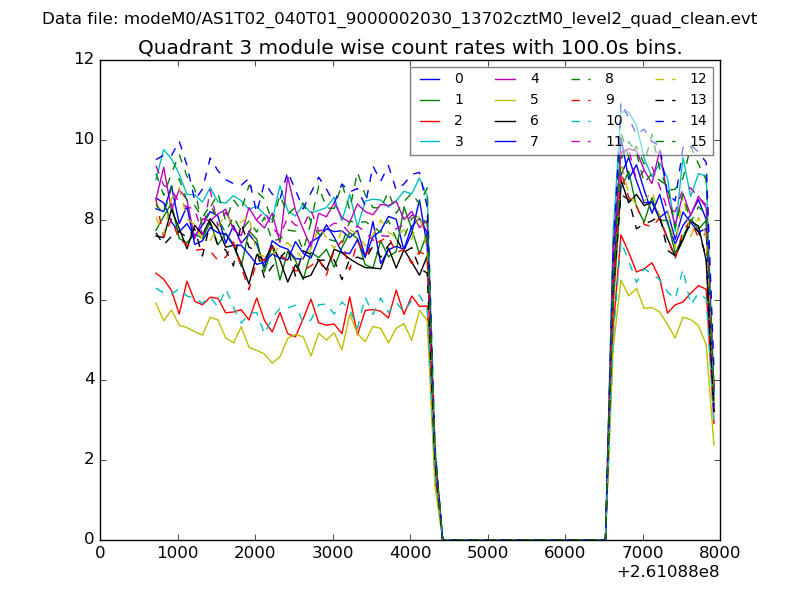
| Module-wise count rates for Quadrant C Data is divided into 100 sec bins |
 |
 |
| Module-wise count rates for Quadrant D Data is divided into 100 sec bins |
 |
 |
| Parameter | Plot |
|---|---|
| CZT HV Monitor | 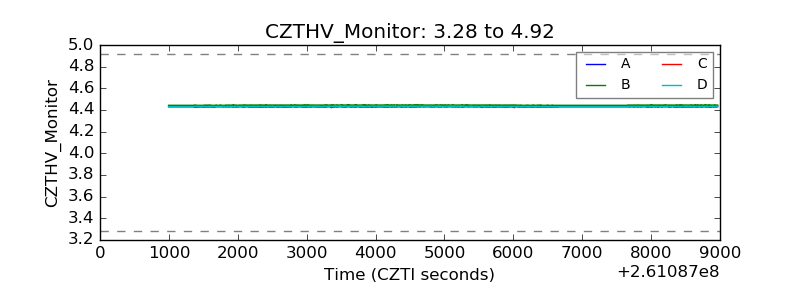 |
| D_VDD | 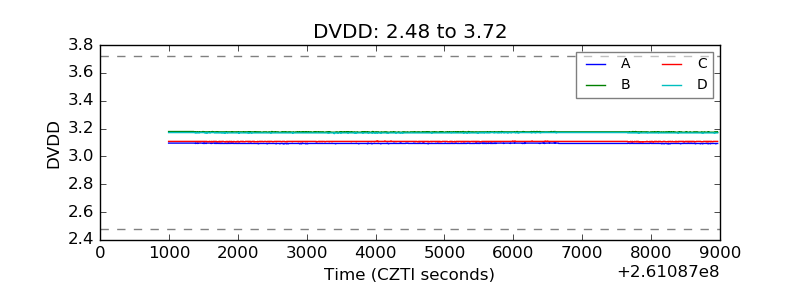 |
| Temperature 1 | 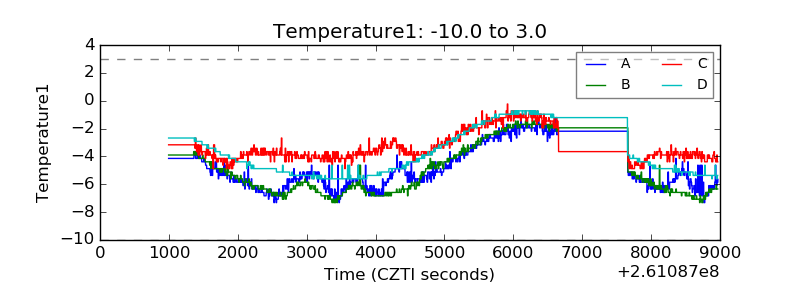 |
| Veto HV Monitor | 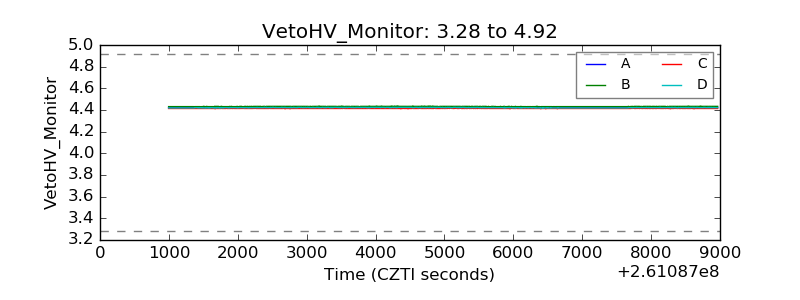 |
| Veto LLD | 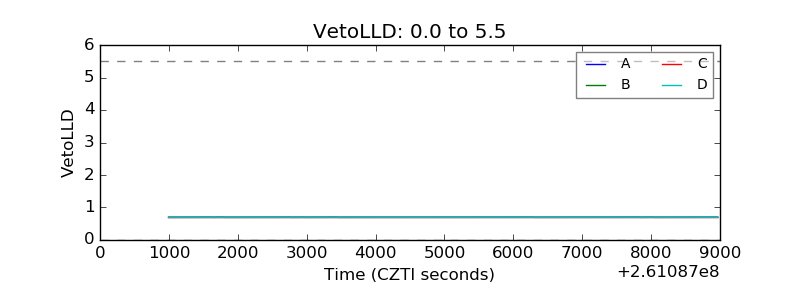 |
| Alpha Counter | 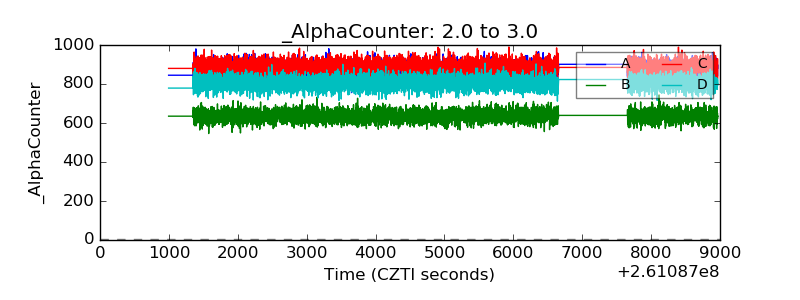 |
| _CPM_Rate | 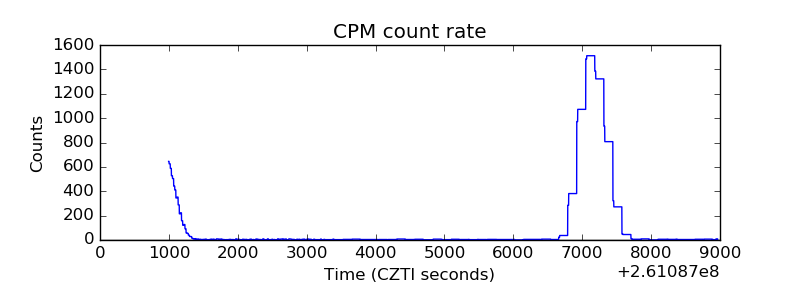 |
| CZT Counter | 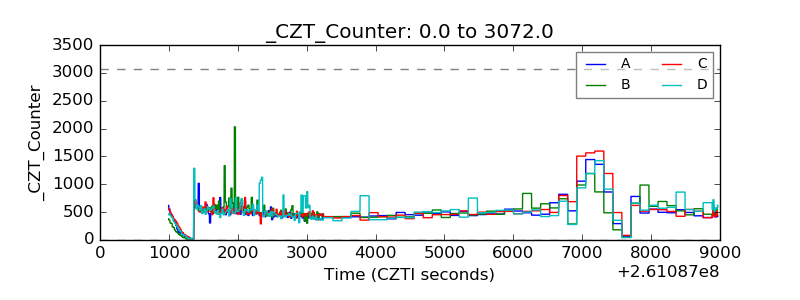 |
| +2.5 Volts monitor |  |
| +5 Volts monitor |  |
| _ROLL_ROT | 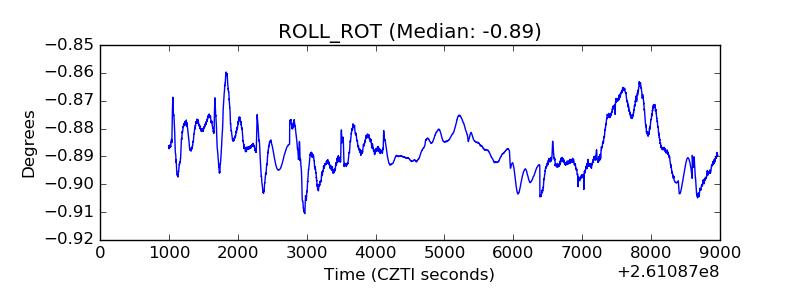 |
| _Roll_DEC | 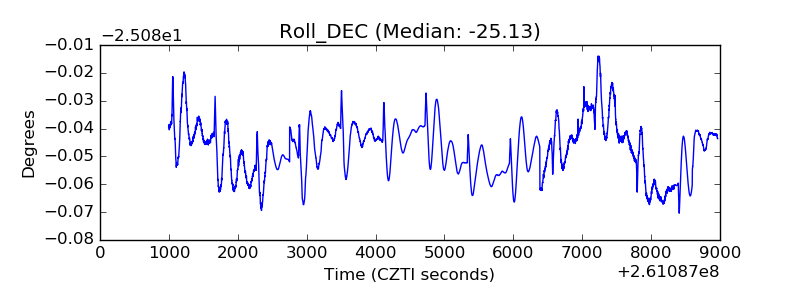 |
| _Roll_RA | 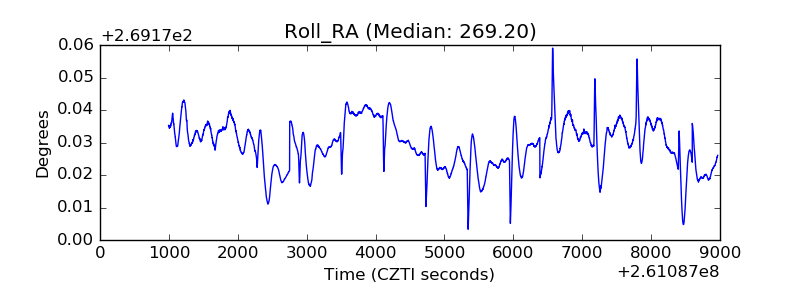 |
| Veto Counter | 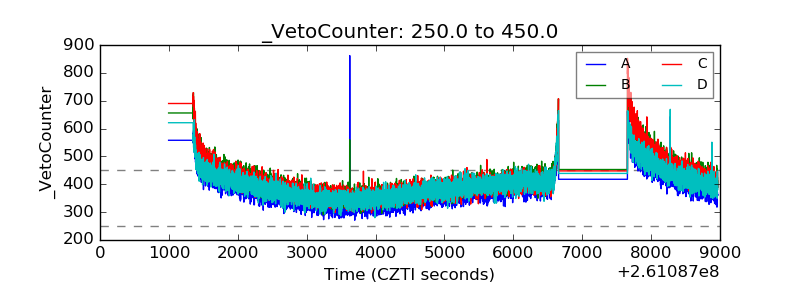 |