| Param | Original file | Final file |
|---|---|---|
| Filename | modeM0/AS1T02_040T01_9000002030_13704cztM0_level2.evt | modeM0/AS1T02_040T01_9000002030_13704cztM0_level2_quad_clean.evt |
| Size (bytes) | 527,201,280 | 103,429,440 |
| Size | 502.8 MB | 98.6 MB |
| Events in quadrant A | 3,381,153 | 670,041 |
| Events in quadrant B | 3,869,390 | 725,045 |
| Events in quadrant C | 3,470,440 | 655,551 |
| Events in quadrant D | 4,780,744 | 604,222 |
| Mode SS | |||
|---|---|---|---|
| Quadrant | BADHDUFLAG | Total packets | Discarded packets |
| A | 0 | 142 | 0 |
| B | 0 | 142 | 0 |
| C | 0 | 142 | 0 |
| D | 0 | 142 | 0 |
| Mode M0 | |||
|---|---|---|---|
| Quadrant | BADHDUFLAG | Total packets | Discarded packets |
| A | 0 | 14301 | 3 |
| B | 0 | 15938 | 2 |
| C | 0 | 14342 | 2 |
| D | 0 | 18840 | 2 |
| Mode M9 | |||
|---|---|---|---|
| Quadrant | BADHDUFLAG | Total packets | Discarded packets |
| A | 0 | 21 | 0 |
| B | 0 | 21 | 0 |
| C | 0 | 21 | 0 |
| D | 0 | 21 | 0 |
| Quadrant | Total seconds | Saturated seconds | Saturation percentage |
|---|---|---|---|
| A | 6849 | 35 | 0.511024% |
| B | 6849 | 104 | 1.518470% |
| C | 6849 | 29 | 0.423419% |
| D | 6849 | 176 | 2.569718% |
Noise dominated data is calculated using 1-second bins in cleaned event files. If a bin has >2000 counts, and if more than 50% of those come from <1% of pixels, then it is considered to be noise-dominated and hence unusable.
| Quadrant | # 1 sec bins | Bins with >0 counts | Bins with >2000 counts | High rate bins dominated by noise | Noise dominated (total time) | Noise dominated (detector-on time) | Marked lightcurve |
|---|---|---|---|---|---|---|---|
| A | 8995 | 6852 | 5 | 5 | 0.06% | 0.07% | 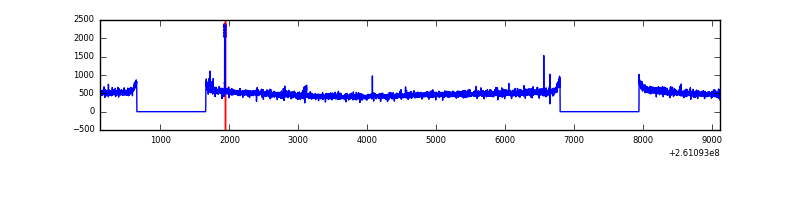 |
| B | 8995 | 6852 | 34 | 34 | 0.38% | 0.50% | 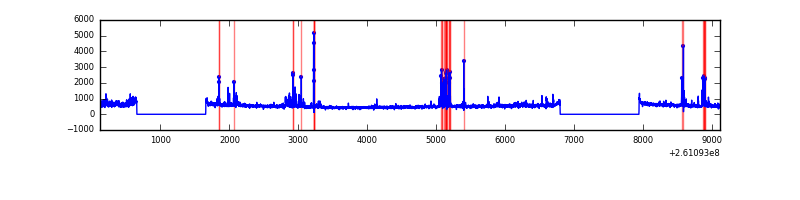 |
| C | 8995 | 6852 | 0 | 0 | 0.00% | 0.00% | 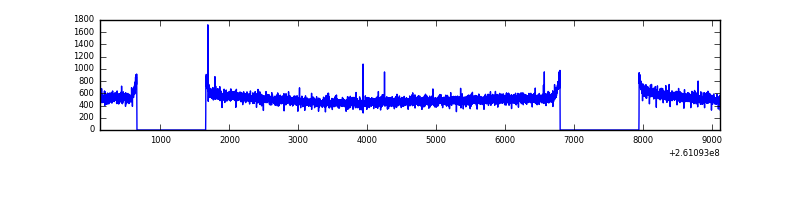 |
| D | 8995 | 6852 | 128 | 128 | 1.42% | 1.87% | 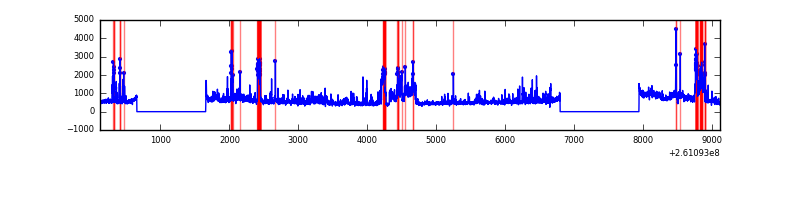 |
Top three noisy pixels from each quadrant. If the there are fewer than three noisy pixels in the level2.evt file, extra rows are filled as -1
| Pixel properties | Quadrant properties | ||||||
|---|---|---|---|---|---|---|---|
| Quadrant | DetID | PixID | Counts | Sigma | Mean | Median | Sigma |
| A | 15 | 69 | 16837 | 90.05 | 868 | 853 | 177.5 |
| A | 11 | 29 | 12271 | 64.33 | 868 | 853 | 177.5 |
| A | 1 | 162 | 11682 | 61.01 | 868 | 853 | 177.5 |
| B | 0 | 219 | 200551 | 1192.37 | 884 | 867 | 167.5 |
| B | 8 | 250 | 102017 | 604.0 | 884 | 867 | 167.5 |
| B | 0 | 189 | 43480 | 254.46 | 884 | 867 | 167.5 |
| C | 3 | 233 | 168763 | 856.87 | 846 | 852 | 196.0 |
| C | 13 | 61 | 5951 | 26.02 | 846 | 852 | 196.0 |
| C | 14 | 234 | 3514 | 13.58 | 846 | 852 | 196.0 |
| D | 13 | 122 | 1286460 | 5964.75 | 818 | 804 | 215.5 |
| D | 5 | 222 | 169924 | 784.63 | 818 | 804 | 215.5 |
| D | 1 | 52 | 96568 | 444.29 | 818 | 804 | 215.5 |
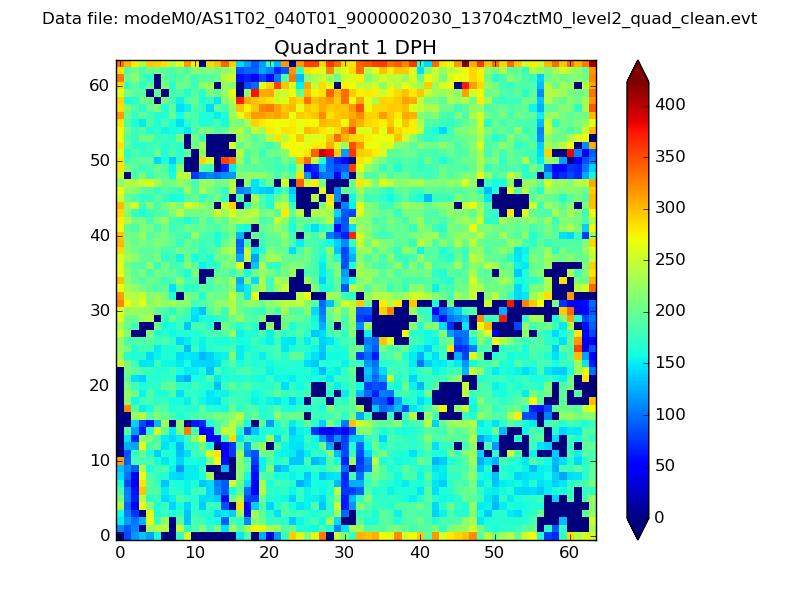
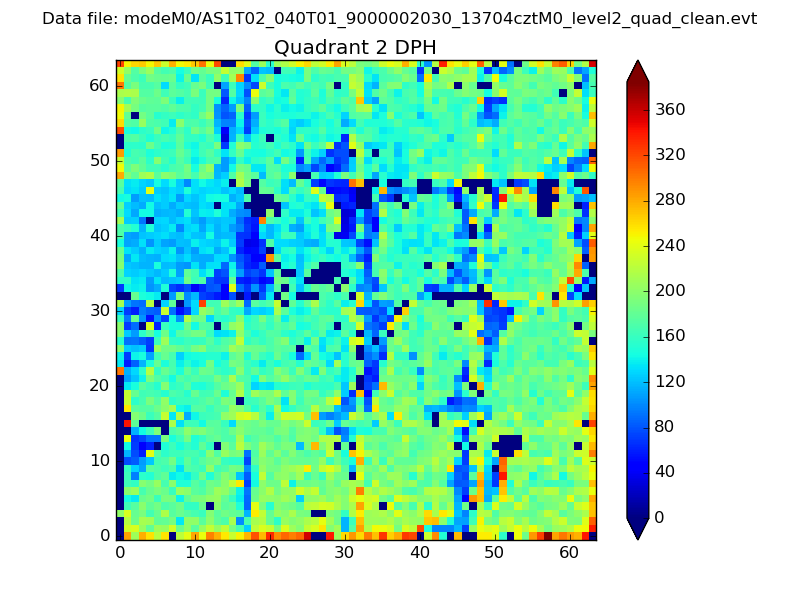
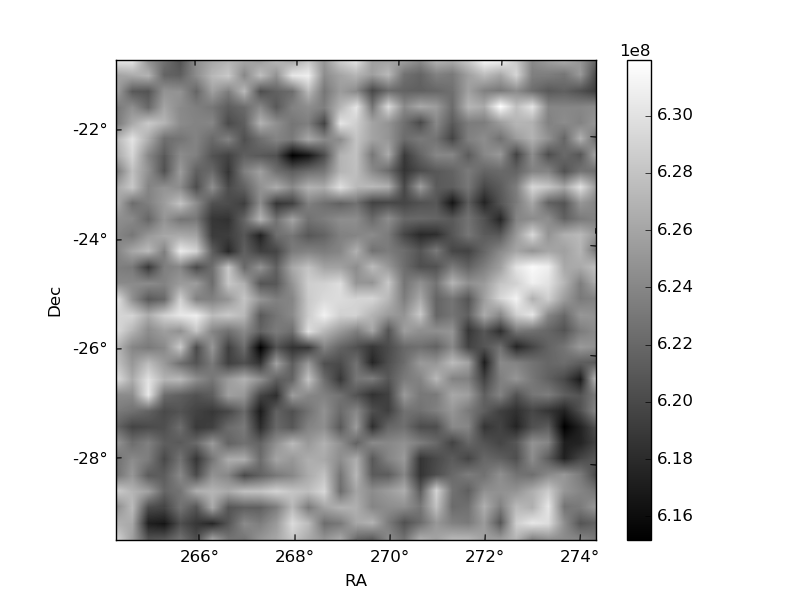
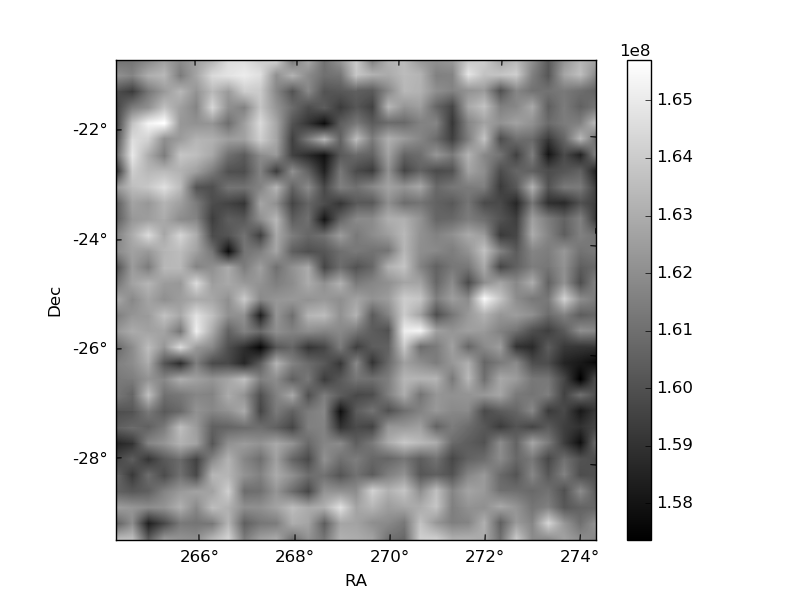
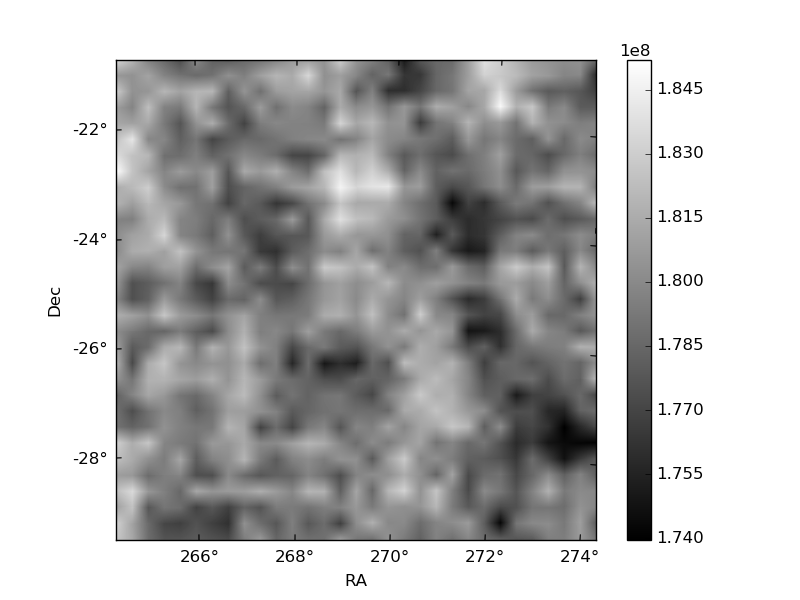
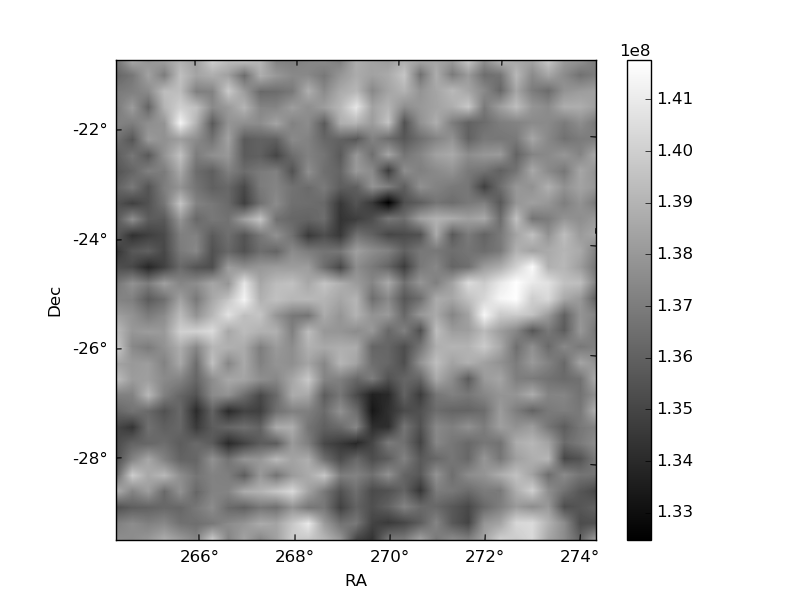
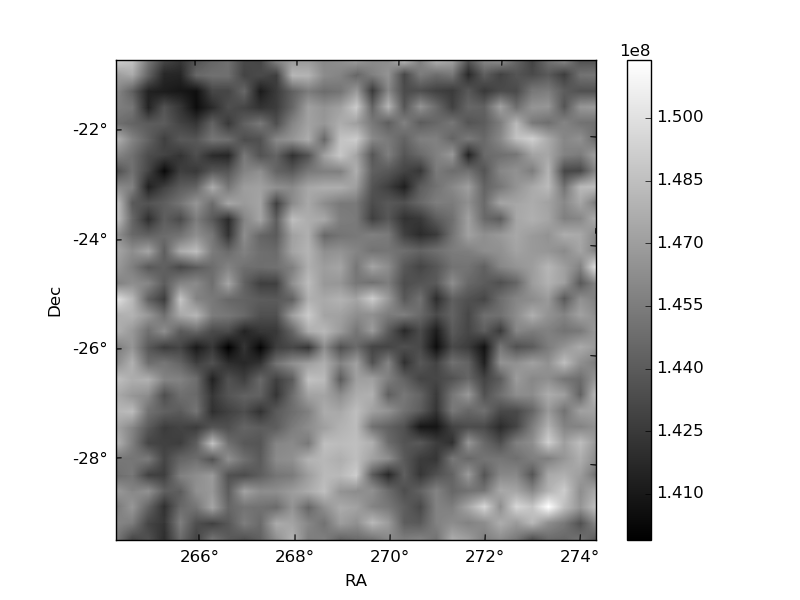
Histogram calculated using DETX and DETY for each event in the final _common_clean file
| Quadrant A |  |
 |
Quadrant B |
|---|---|---|---|
| Quadrant D | 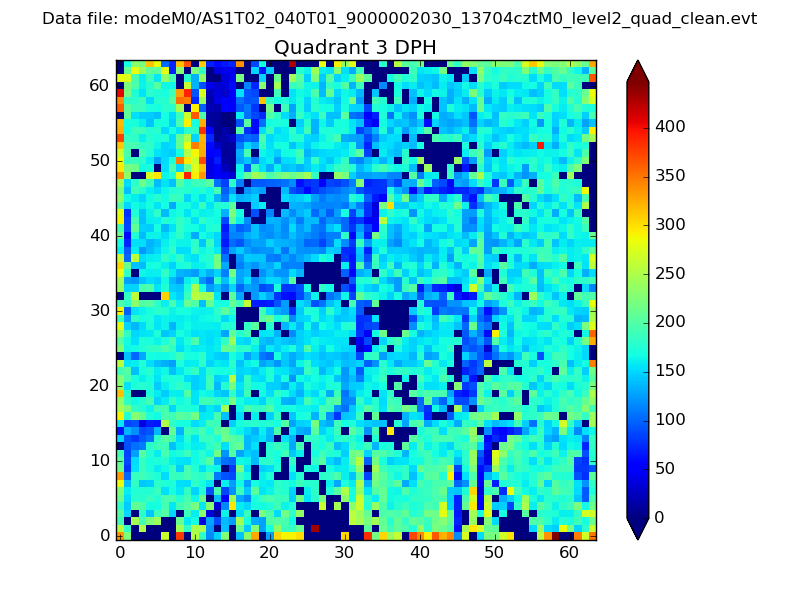 |
 |
Quadrant C |
| Plot type | Count rate plots | Images |
|---|---|---|
| Comparison with Poisson distribution Blue bars denote a histogram of data divided into 1 sec bins. Red curve is a Poisson curve with rate = median count rate of data. |
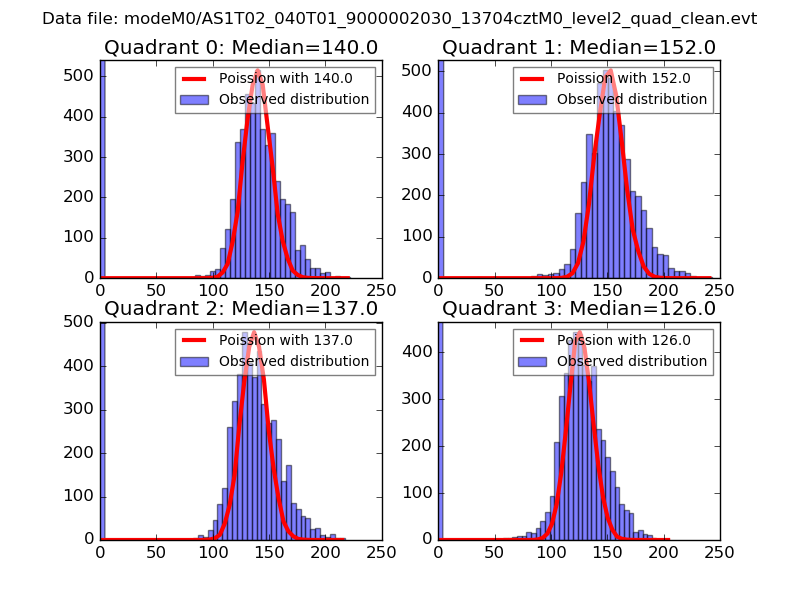 |
 |
| Quadrant-wise count rates Data is divided into 100 sec bins |
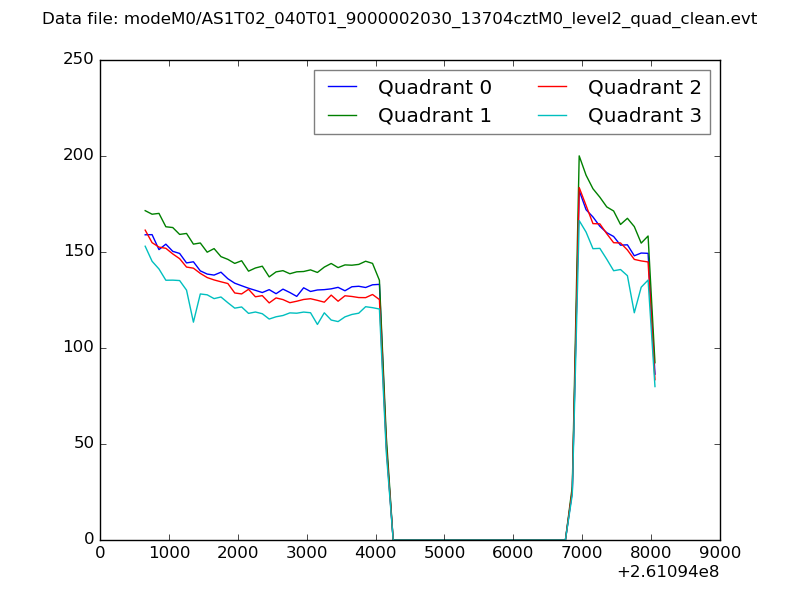 |
|
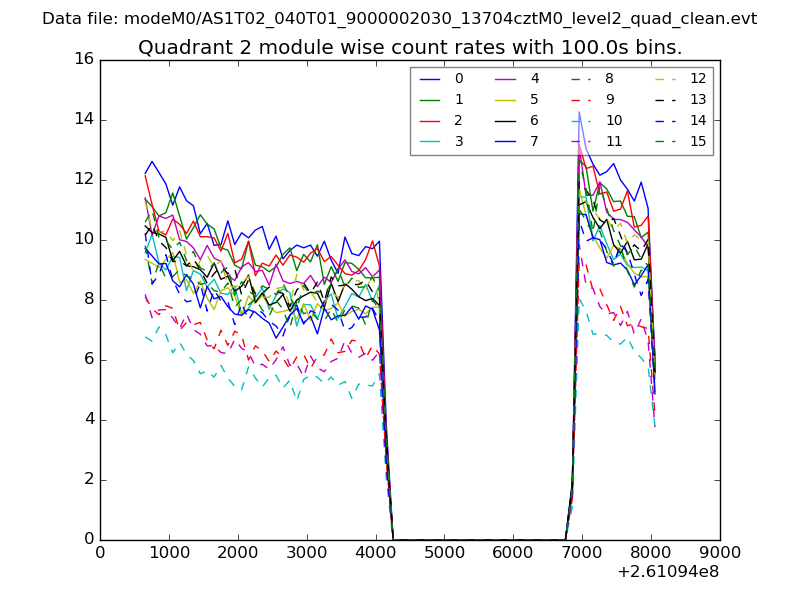
| Module-wise count rates for Quadrant A Data is divided into 100 sec bins |
 |
 |
| Module-wise count rates for Quadrant B Data is divided into 100 sec bins |
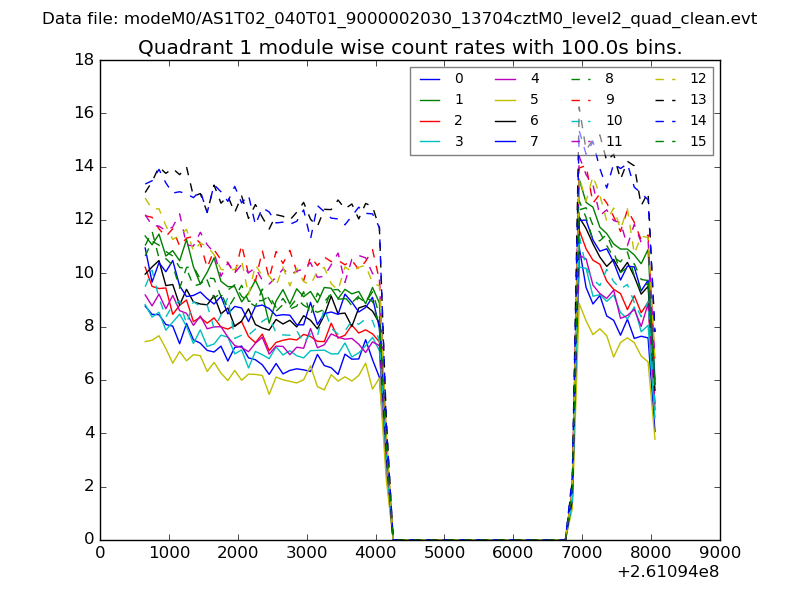 |
 |
| Module-wise count rates for Quadrant C Data is divided into 100 sec bins |
 |
 |
| Module-wise count rates for Quadrant D Data is divided into 100 sec bins |
 |
 |
| Parameter | Plot |
|---|---|
| CZT HV Monitor |  |
| D_VDD | 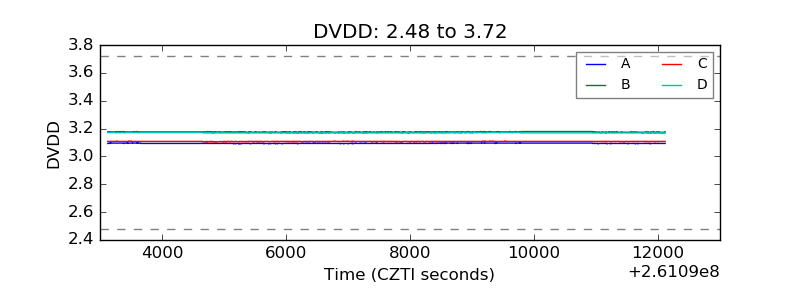 |
| Temperature 1 | 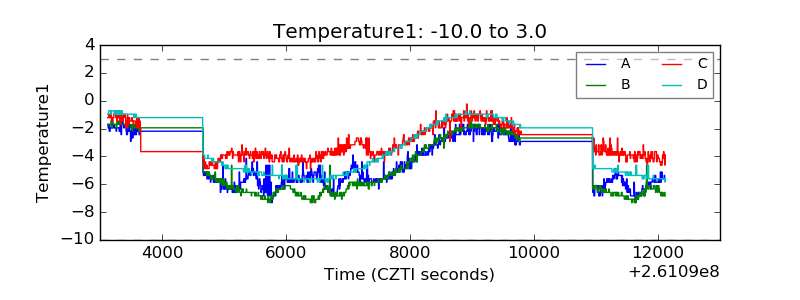 |
| Veto HV Monitor | 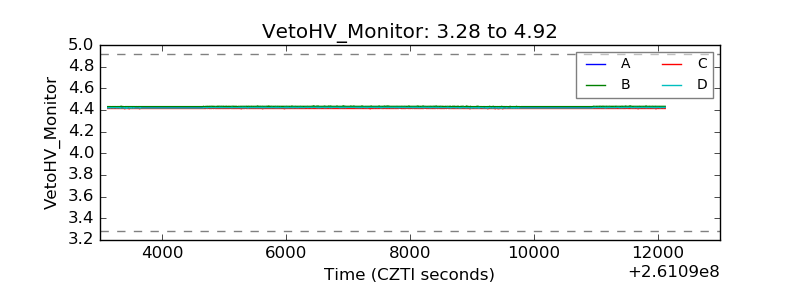 |
| Veto LLD | 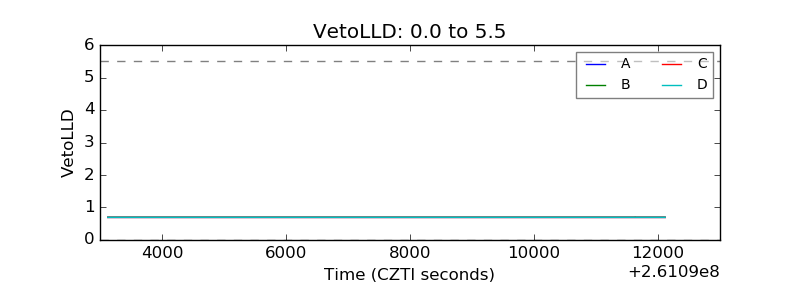 |
| Alpha Counter | 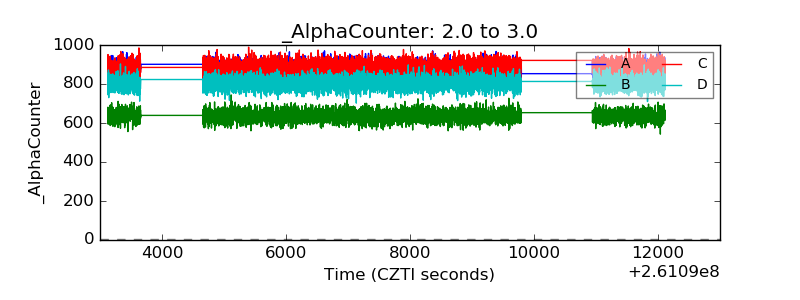 |
| _CPM_Rate | 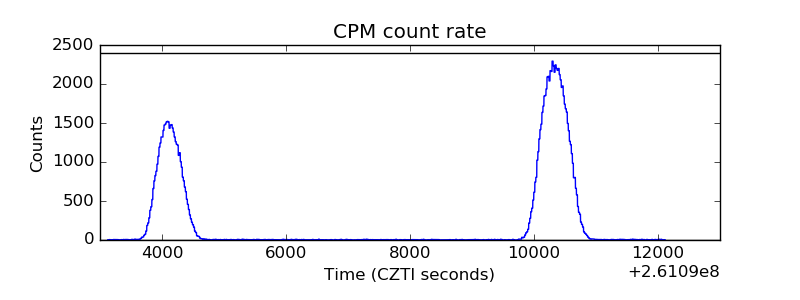 |
| CZT Counter | 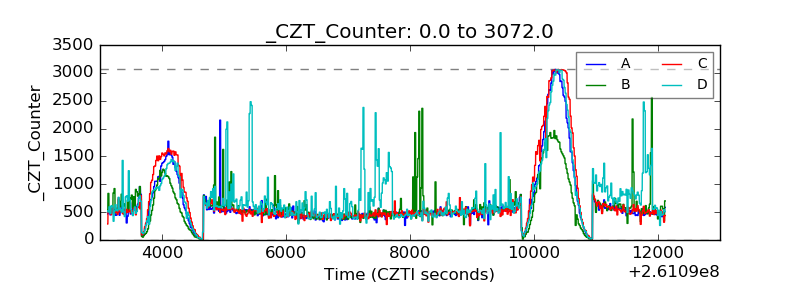 |
| +2.5 Volts monitor |  |
| +5 Volts monitor |  |
| _ROLL_ROT | 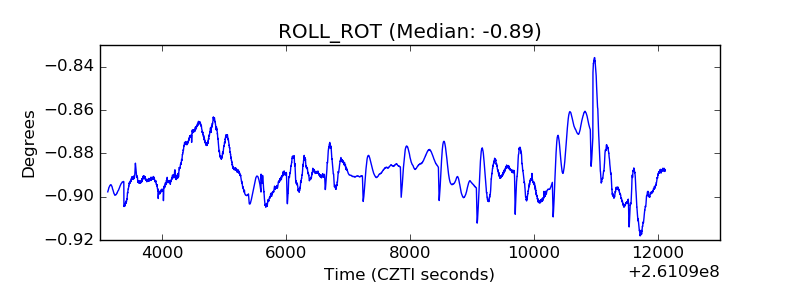 |
| _Roll_DEC | 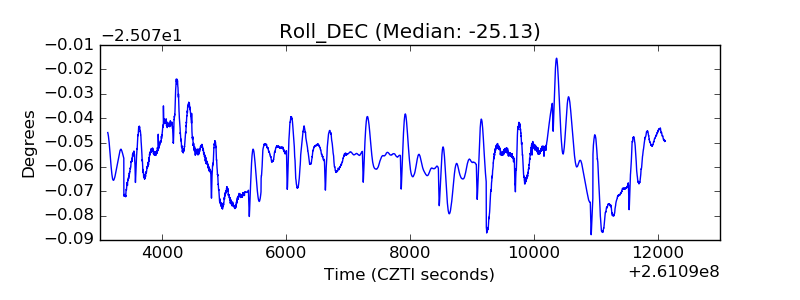 |
| _Roll_RA | 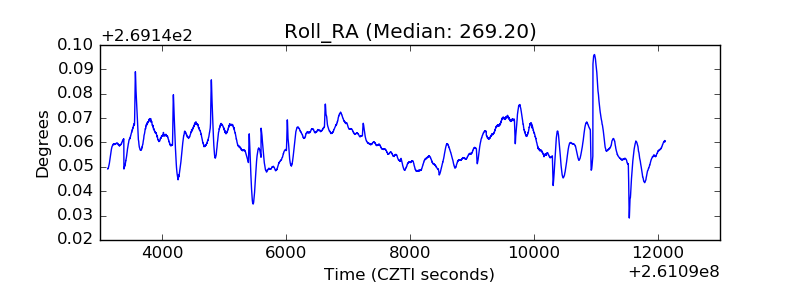 |
| Veto Counter | 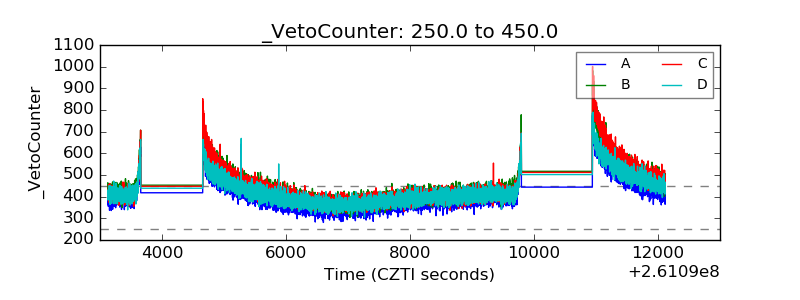 |