| Param | Original file | Final file |
|---|---|---|
| Filename | modeM0/AS1T02_040T01_9000002030_13705cztM0_level2.evt | modeM0/AS1T02_040T01_9000002030_13705cztM0_level2_quad_clean.evt |
| Size (bytes) | 261,498,240 | 65,496,960 |
| Size | 249.4 MB | 62.5 MB |
| Events in quadrant A | 1,590,942 | 443,033 |
| Events in quadrant B | 1,830,280 | 479,084 |
| Events in quadrant C | 1,640,804 | 434,368 |
| Events in quadrant D | 2,632,330 | 393,055 |
| Mode SS | |||
|---|---|---|---|
| Quadrant | BADHDUFLAG | Total packets | Discarded packets |
| A | 0 | 68 | 0 |
| B | 0 | 68 | 0 |
| C | 0 | 68 | 0 |
| D | 0 | 68 | 0 |
| Mode M0 | |||
|---|---|---|---|
| Quadrant | BADHDUFLAG | Total packets | Discarded packets |
| A | 0 | 6863 | 1 |
| B | 0 | 7576 | 1 |
| C | 0 | 6947 | 1 |
| D | 0 | 10066 | 1 |
| Mode M9 | |||
|---|---|---|---|
| Quadrant | BADHDUFLAG | Total packets | Discarded packets |
| A | 0 | 11 | 0 |
| B | 0 | 11 | 0 |
| C | 0 | 11 | 0 |
| D | 0 | 11 | 0 |
| Quadrant | Total seconds | Saturated seconds | Saturation percentage |
|---|---|---|---|
| A | 3292 | 9 | 0.273390% |
| B | 3292 | 38 | 1.154313% |
| C | 3292 | 7 | 0.212637% |
| D | 3292 | 203 | 6.166464% |
Noise dominated data is calculated using 1-second bins in cleaned event files. If a bin has >2000 counts, and if more than 50% of those come from <1% of pixels, then it is considered to be noise-dominated and hence unusable.
| Quadrant | # 1 sec bins | Bins with >0 counts | Bins with >2000 counts | High rate bins dominated by noise | Noise dominated (total time) | Noise dominated (detector-on time) | Marked lightcurve |
|---|---|---|---|---|---|---|---|
| A | 4438 | 3294 | 0 | 0 | 0.00% | 0.00% | 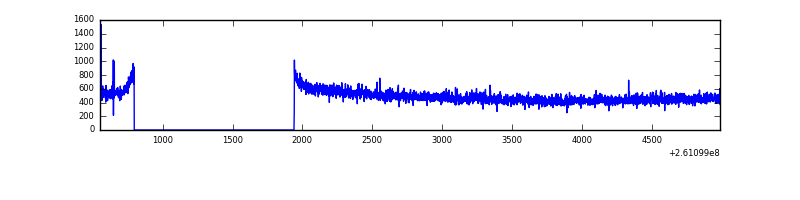 |
| B | 4438 | 3294 | 11 | 11 | 0.25% | 0.33% | 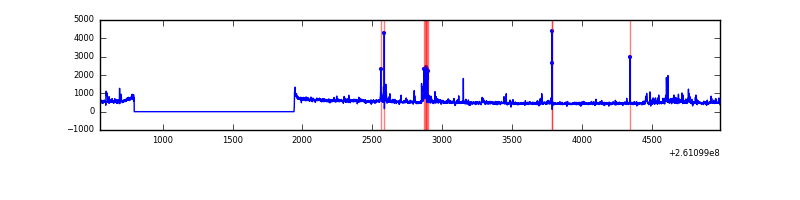 |
| C | 4438 | 3294 | 0 | 0 | 0.00% | 0.00% | 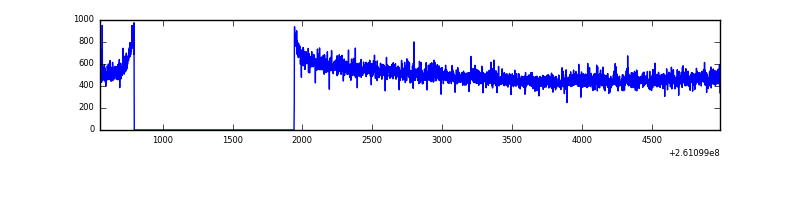 |
| D | 4438 | 3294 | 187 | 187 | 4.21% | 5.68% | 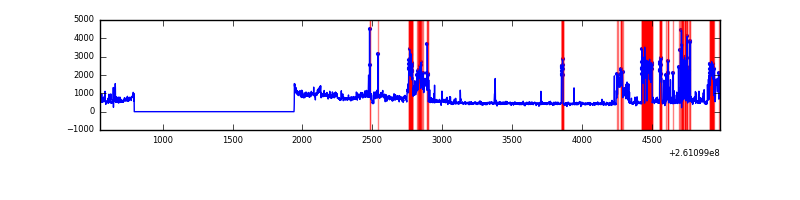 |
Top three noisy pixels from each quadrant. If the there are fewer than three noisy pixels in the level2.evt file, extra rows are filled as -1
| Pixel properties | Quadrant properties | ||||||
|---|---|---|---|---|---|---|---|
| Quadrant | DetID | PixID | Counts | Sigma | Mean | Median | Sigma |
| A | 1 | 162 | 5977 | 65.61 | 411 | 403 | 85.0 |
| A | 0 | 226 | 3628 | 37.96 | 411 | 403 | 85.0 |
| A | 12 | 194 | 3032 | 30.94 | 411 | 403 | 85.0 |
| B | 8 | 250 | 116627 | 1433.87 | 423 | 414 | 81.0 |
| B | 3 | 64 | 39288 | 479.64 | 423 | 414 | 81.0 |
| B | 0 | 219 | 13018 | 155.51 | 423 | 414 | 81.0 |
| C | 3 | 233 | 58316 | 608.72 | 406 | 409 | 95.1 |
| C | 13 | 61 | 2822 | 25.37 | 406 | 409 | 95.1 |
| C | 3 | 202 | 980 | 6.0 | 406 | 409 | 95.1 |
| D | 13 | 122 | 1086588 | 11541.38 | 388 | 378 | 94.1 |
| D | 1 | 52 | 36774 | 386.72 | 388 | 378 | 94.1 |
| D | 13 | 249 | 36008 | 378.58 | 388 | 378 | 94.1 |
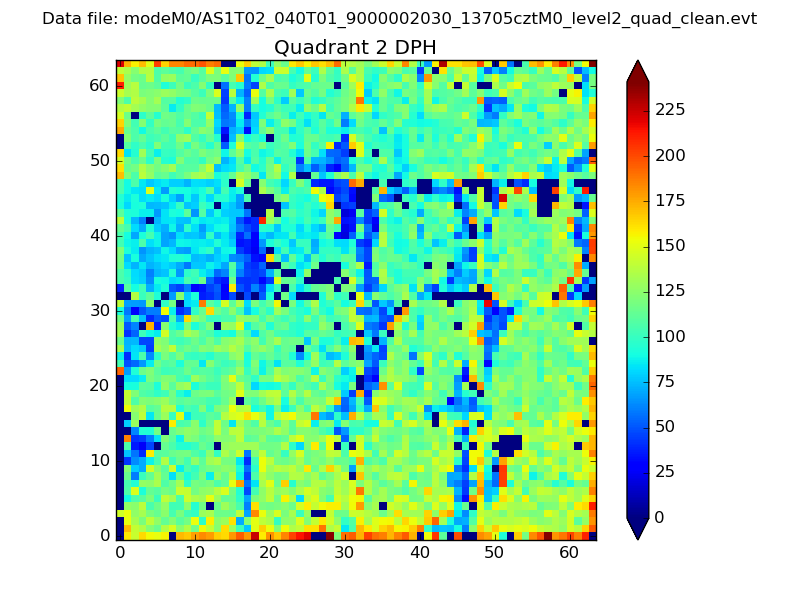
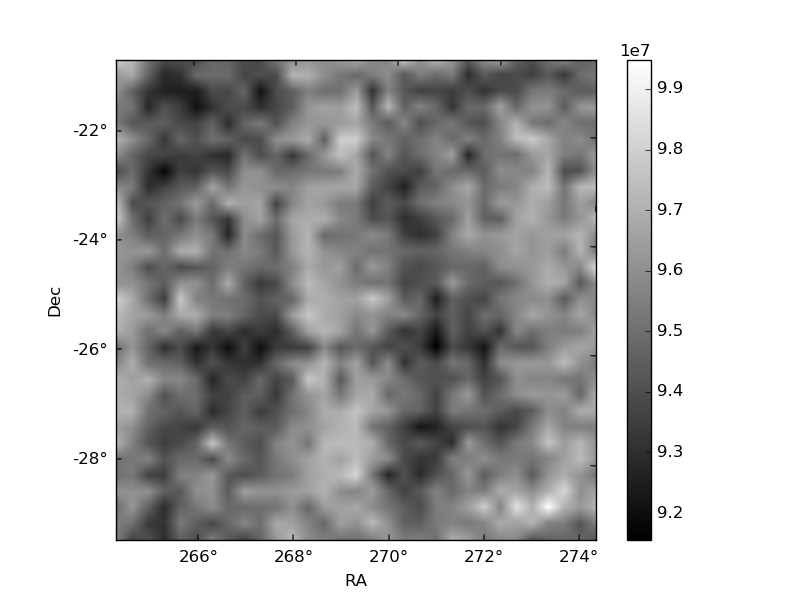
Histogram calculated using DETX and DETY for each event in the final _common_clean file
| Quadrant A | 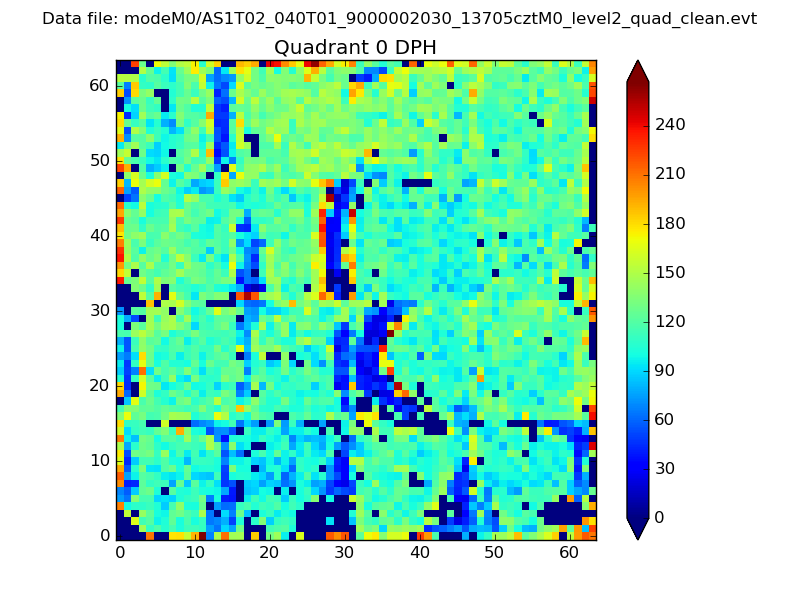 |
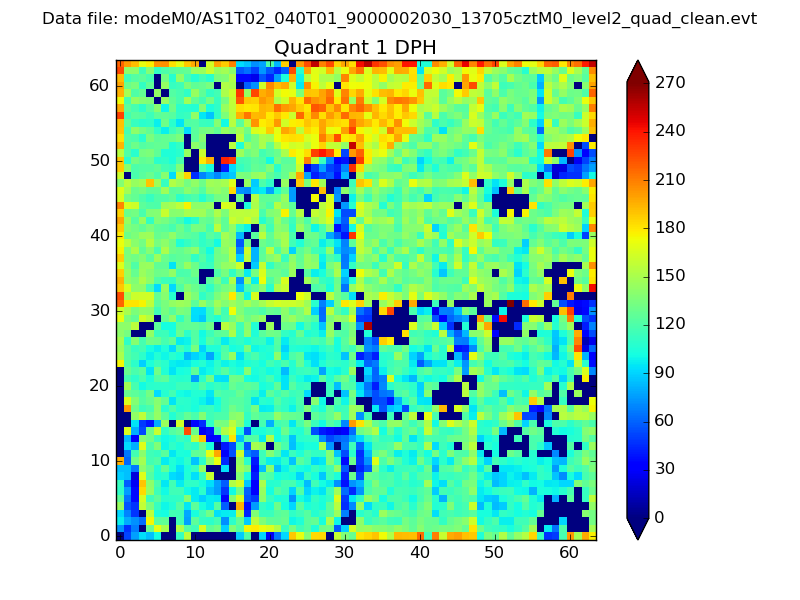 |
Quadrant B |
|---|---|---|---|
| Quadrant D | 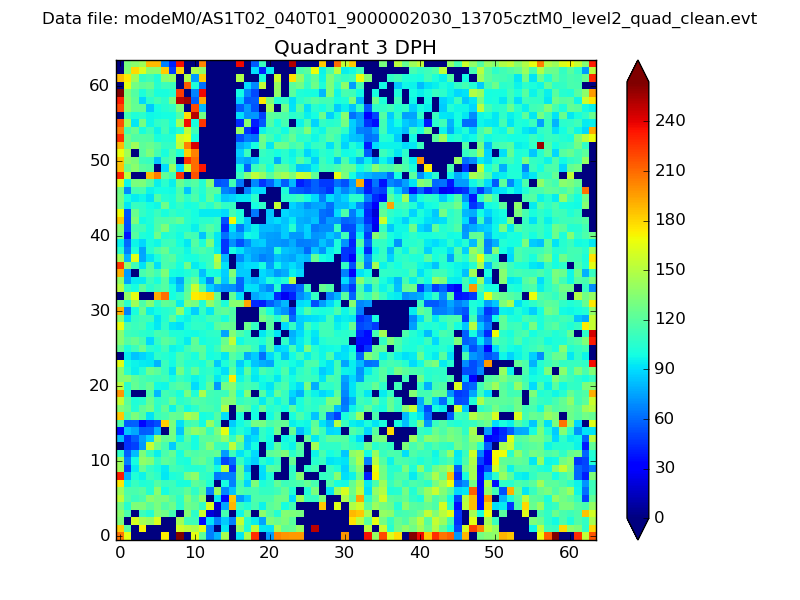 |
 |
Quadrant C |
| Plot type | Count rate plots | Images |
|---|---|---|
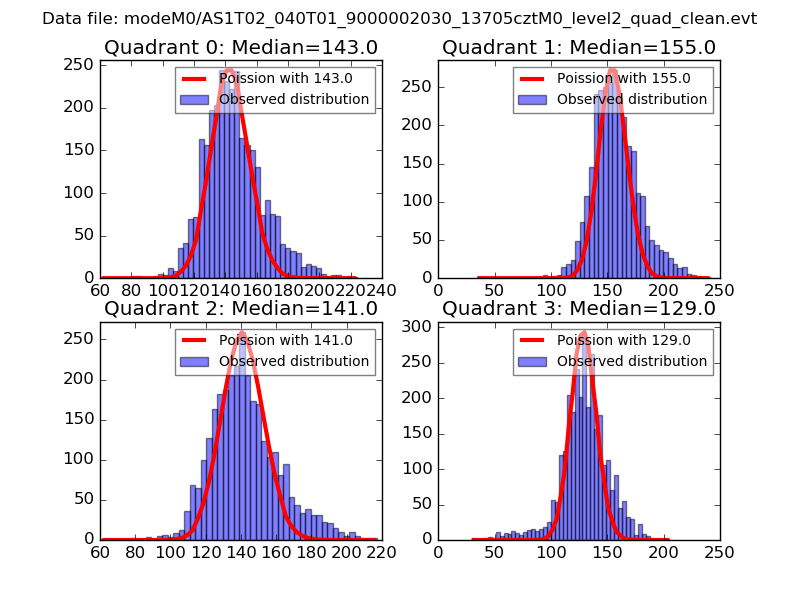
| Comparison with Poisson distribution Blue bars denote a histogram of data divided into 1 sec bins. Red curve is a Poisson curve with rate = median count rate of data. |
 |
 |
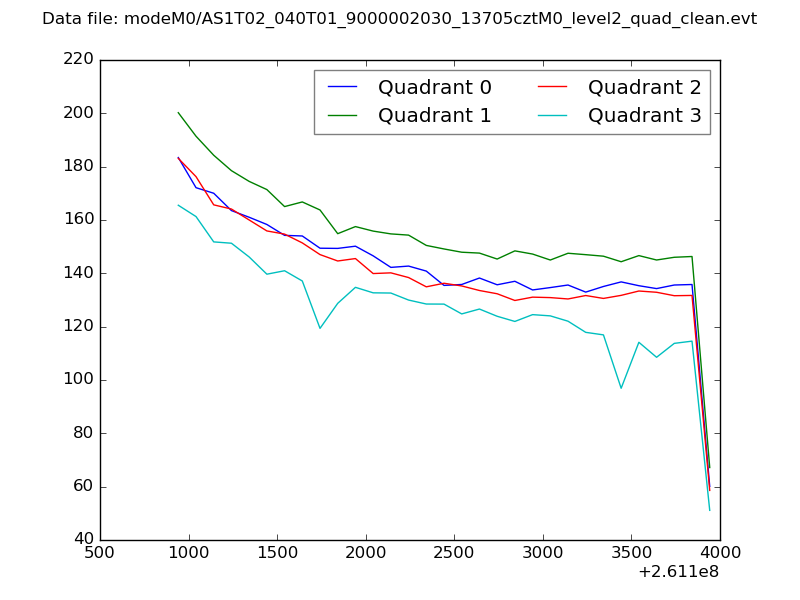
| Quadrant-wise count rates Data is divided into 100 sec bins |
 |
|
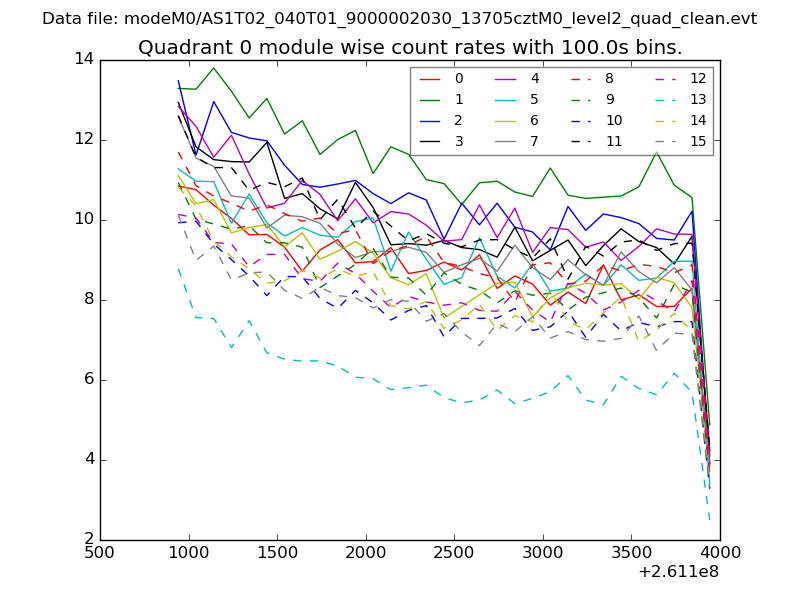
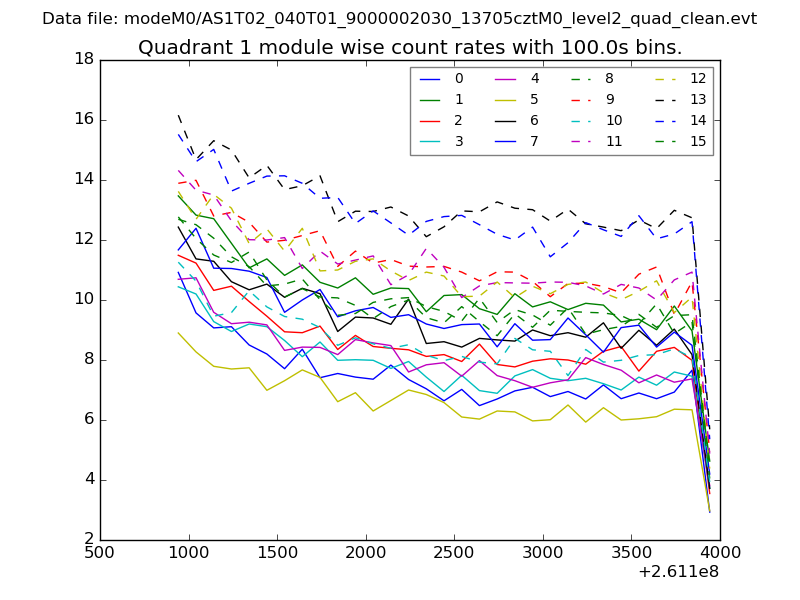
| Module-wise count rates for Quadrant A Data is divided into 100 sec bins |
 |
 |
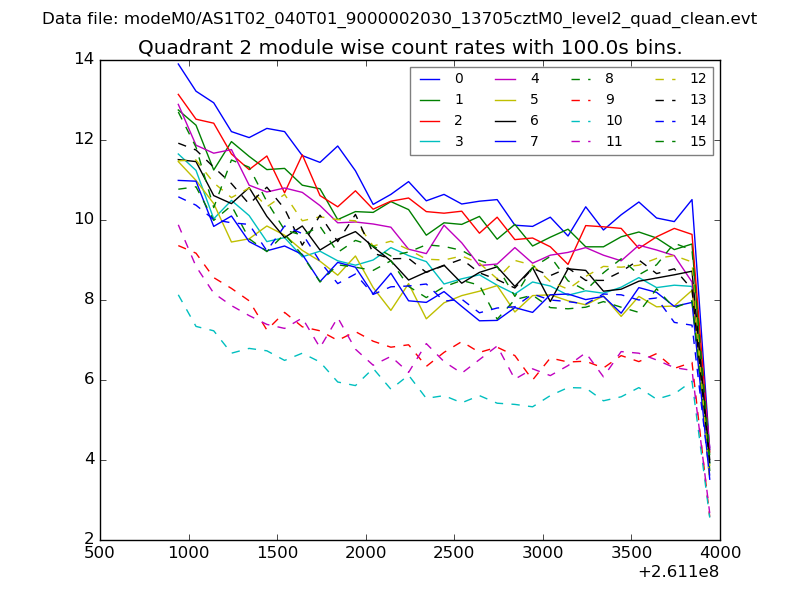
| Module-wise count rates for Quadrant B Data is divided into 100 sec bins |
 |
 |
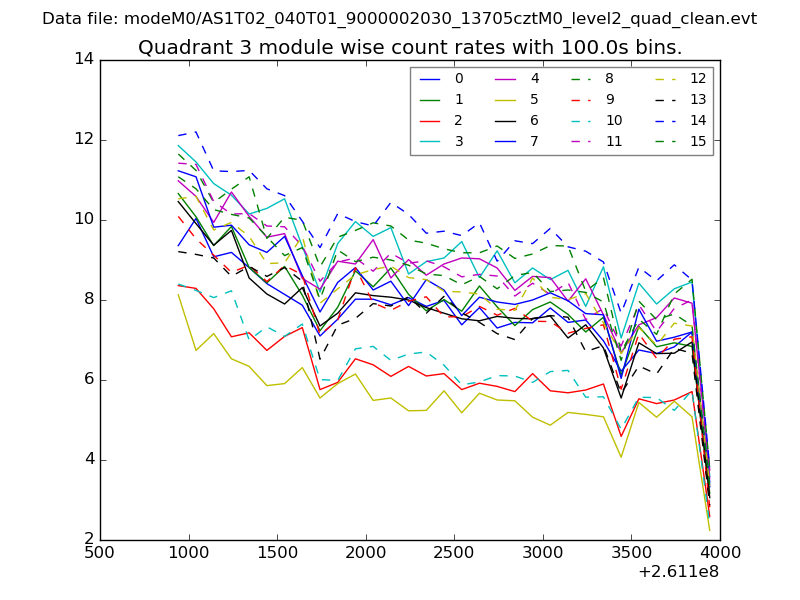
| Module-wise count rates for Quadrant C Data is divided into 100 sec bins |
 |
 |
| Module-wise count rates for Quadrant D Data is divided into 100 sec bins |
 |
 |
| Parameter | Plot |
|---|---|
| CZT HV Monitor | 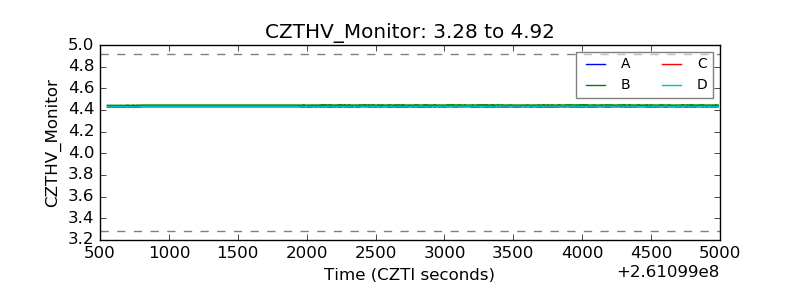 |
| D_VDD | 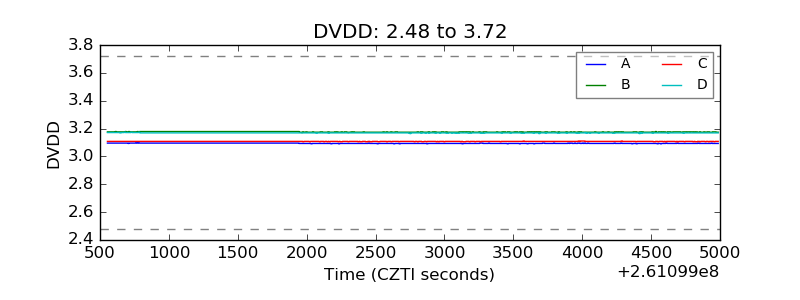 |
| Temperature 1 | 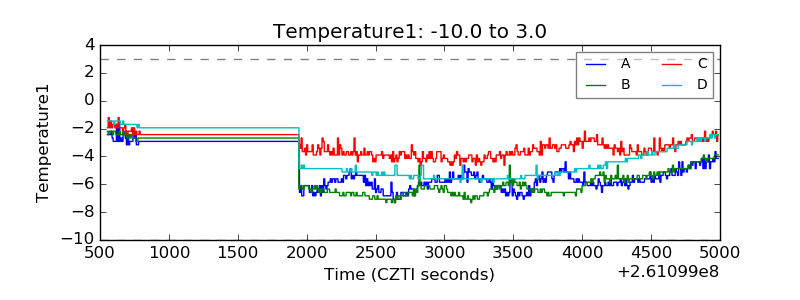 |
| Veto HV Monitor | 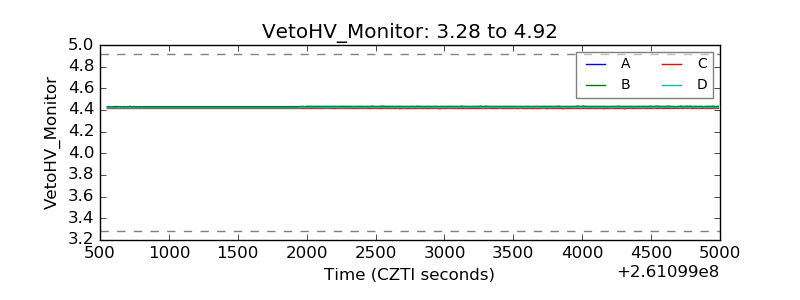 |
| Veto LLD | 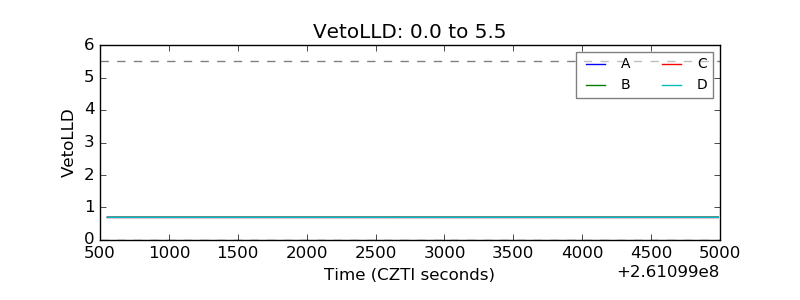 |
| Alpha Counter | 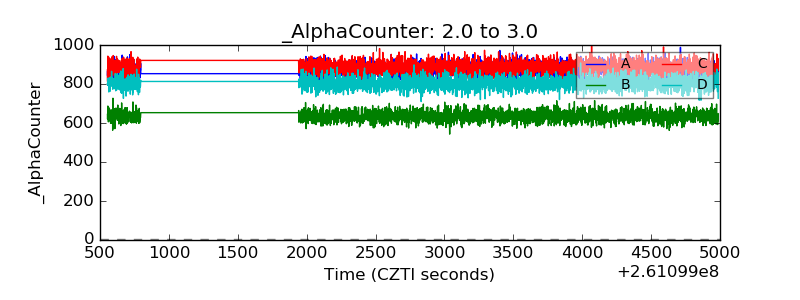 |
| _CPM_Rate | 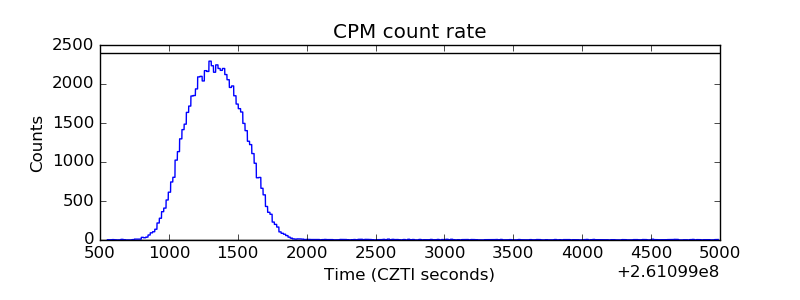 |
| CZT Counter |  |
| +2.5 Volts monitor |  |
| +5 Volts monitor |  |
| _ROLL_ROT | 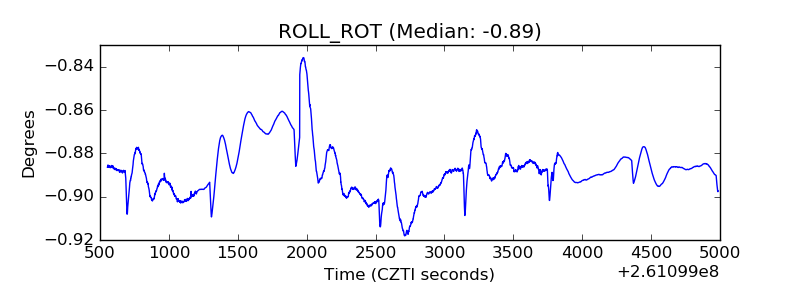 |
| _Roll_DEC | 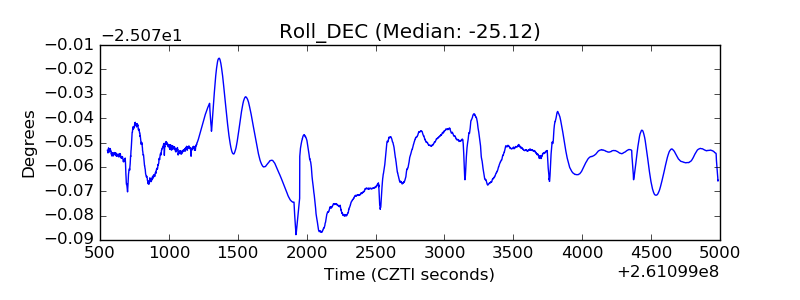 |
| _Roll_RA | 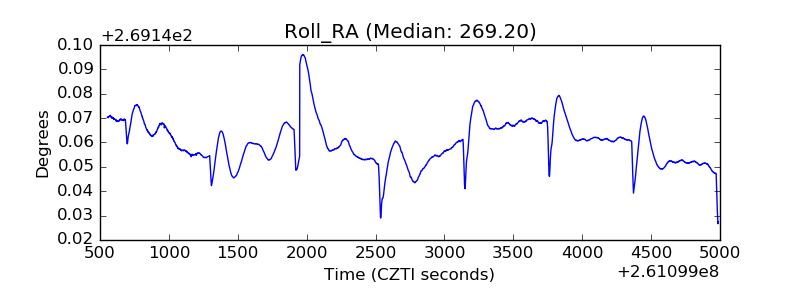 |
| Veto Counter | 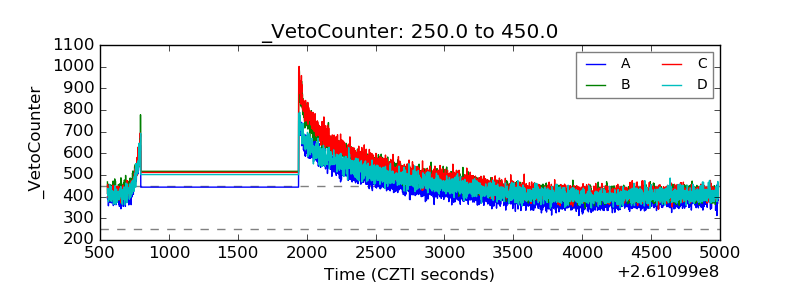 |