| Param | Original file | Final file |
|---|---|---|
| Filename | modeM0/AS1G08_036T01_9000002034cztM0_level2.fits | modeM0/AS1G08_036T01_9000002034cztM0_level2_quad_clean.evt |
| Size (bytes) | 252,020,160 | 124,879,680 |
| Size | 240.3 MB | 119.1 MB |
| Events in quadrant A | 1,573,916 | 558,252 |
| Events in quadrant B | 1,499,414 | 582,516 |
| Events in quadrant C | 1,551,796 | 515,353 |
| Events in quadrant D | 1,335,128 | 450,423 |
| Mode M9 | |||
|---|---|---|---|
| Quadrant | BADHDUFLAG | Total packets | Discarded packets |
| A | 0 | 64 | 0 |
| B | 0 | 64 | 0 |
| C | 0 | 64 | 0 |
| D | 0 | 64 | 0 |
| Mode M0 | |||
|---|---|---|---|
| Quadrant | BADHDUFLAG | Total packets | Discarded packets |
| A | 0 | 50562 | 0 |
| B | 0 | 56134 | 0 |
| C | 0 | 51060 | 0 |
| D | 0 | 58990 | 0 |
| Mode SS | |||
|---|---|---|---|
| Quadrant | BADHDUFLAG | Total packets | Discarded packets |
| A | 0 | 494 | 0 |
| B | 0 | 494 | 0 |
| C | 0 | 494 | 0 |
| D | 0 | 494 | 0 |
| Quadrant | Total seconds | Saturated seconds | Saturation percentage |
|---|---|---|---|
| A | 24324 | 136 | 0.559119% |
| B | 24324 | 265 | 1.089459% |
| C | 24324 | 104 | 0.427561% |
| D | 24324 | 435 | 1.788357% |
Noise dominated data is calculated using 1-second bins in cleaned event files. If a bin has >2000 counts, and if more than 50% of those come from <1% of pixels, then it is considered to be noise-dominated and hence unusable.
| Quadrant | # 1 sec bins | Bins with >0 counts | Bins with >2000 counts | High rate bins dominated by noise | Noise dominated (total time) | Noise dominated (detector-on time) | Marked lightcurve |
|---|---|---|---|---|---|---|---|
| A | 30629 | 24324 | 0 | 0 | 0.00% | 0.00% |  |
| B | 30629 | 24324 | 0 | 0 | 0.00% | 0.00% |  |
| C | 30629 | 24324 | 0 | 0 | 0.00% | 0.00% |  |
| D | 30629 | 24324 | 0 | 0 | 0.00% | 0.00% |  |
Top three noisy pixels from each quadrant. If the there are fewer than three noisy pixels in the level2.evt file, extra rows are filled as -1
| Pixel properties | Quadrant properties | ||||||
|---|---|---|---|---|---|---|---|
| Quadrant | DetID | PixID | Counts | Sigma | Mean | Median | Sigma |
| A | 0 | 29 | 1438 | 10.12 | 409 | 385 | 104.1 |
| A | 7 | 110 | 1249 | 8.3 | 409 | 385 | 104.1 |
| A | 9 | 19 | 1182 | 7.66 | 409 | 385 | 104.1 |
| B | 2 | 9 | 1280 | 11.34 | 395 | 379 | 79.5 |
| B | 5 | 128 | 1052 | 8.47 | 395 | 379 | 79.5 |
| B | 5 | 225 | 1037 | 8.28 | 395 | 379 | 79.5 |
| C | 1 | 81 | 1167 | 7.42 | 409 | 384 | 105.5 |
| C | 1 | 80 | 1147 | 7.23 | 409 | 384 | 105.5 |
| C | 12 | 241 | 1093 | 6.72 | 409 | 384 | 105.5 |
| D | 10 | 189 | 956 | 5.99 | 380 | 347 | 101.6 |
| D | 6 | 67 | 935 | 5.79 | 380 | 347 | 101.6 |
| D | 6 | 231 | 933 | 5.77 | 380 | 347 | 101.6 |
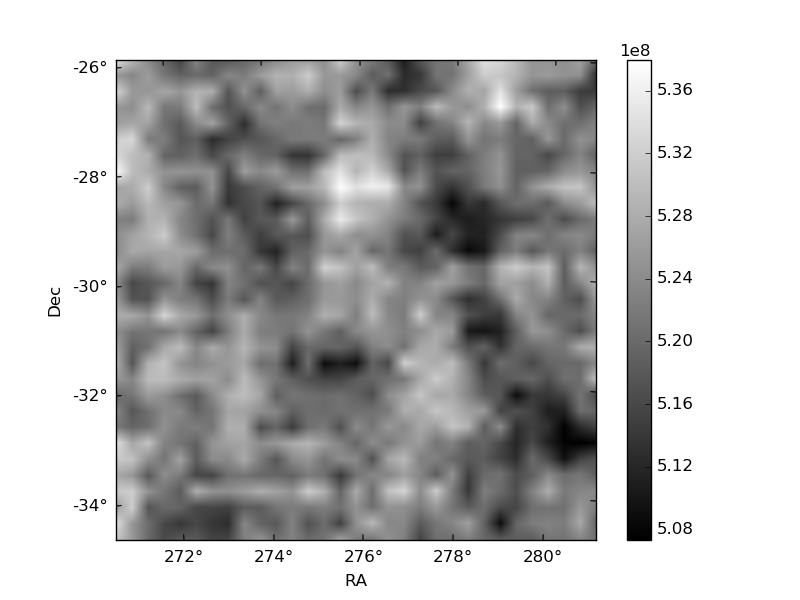
Histogram calculated using DETX and DETY for each event in the final _common_clean file
| Quadrant A |  |
 |
Quadrant B |
|---|---|---|---|
| Quadrant D |  |
 |
Quadrant C |
| Plot type | Count rate plots | Images |
|---|---|---|
| Comparison with Poisson distribution Blue bars denote a histogram of data divided into 1 sec bins. Red curve is a Poisson curve with rate = median count rate of data. |
 |
 |
| Quadrant-wise count rates Data is divided into 100 sec bins |
 |
|
| Module-wise count rates for Quadrant A Data is divided into 100 sec bins |
 |
 |
| Module-wise count rates for Quadrant B Data is divided into 100 sec bins |
 |
 |
| Module-wise count rates for Quadrant C Data is divided into 100 sec bins |
 |
 |
| Module-wise count rates for Quadrant D Data is divided into 100 sec bins |
 |
 |
| Parameter | Plot |
|---|---|
| CZT HV Monitor |  |
| D_VDD | 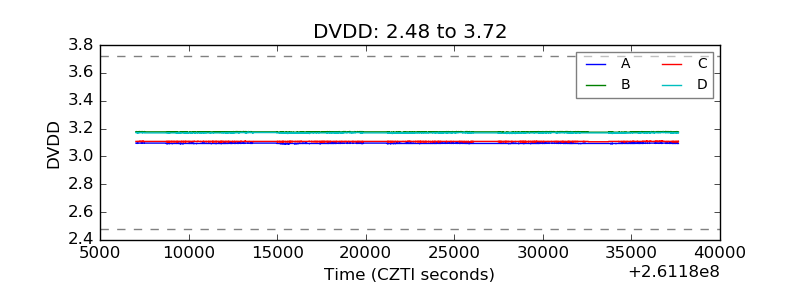 |
| Temperature 1 |  |
| Veto HV Monitor |  |
| Veto LLD |  |
| Alpha Counter |  |
| _CPM_Rate |  |
| CZT Counter |  |
| +2.5 Volts monitor | 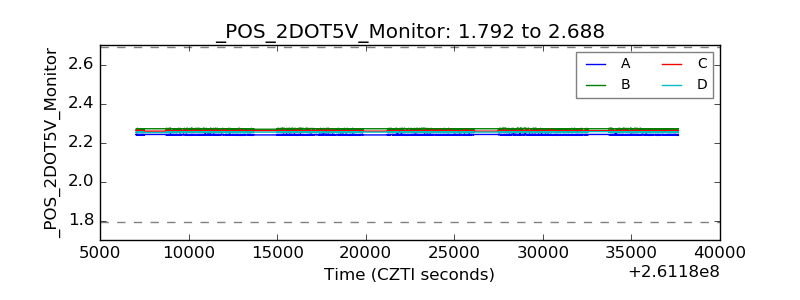 |
| +5 Volts monitor |  |
| _ROLL_ROT |  |
| _Roll_DEC |  |
| _Roll_RA |  |
| Veto Counter |  |