| Param | Original file | Final file |
|---|---|---|
| Filename | modeM0/AS1G08_036T01_9000002034_13720cztM0_level2.evt | modeM0/AS1G08_036T01_9000002034_13720cztM0_level2_quad_clean.evt |
| Size (bytes) | 517,824,000 | 109,203,840 |
| Size | 493.8 MB | 104.1 MB |
| Events in quadrant A | 3,259,963 | 723,308 |
| Events in quadrant B | 3,492,546 | 760,346 |
| Events in quadrant C | 3,379,713 | 710,210 |
| Events in quadrant D | 5,105,552 | 656,266 |
| Mode M9 | |||
|---|---|---|---|
| Quadrant | BADHDUFLAG | Total packets | Discarded packets |
| A | 0 | 20 | 0 |
| B | 0 | 20 | 0 |
| C | 0 | 20 | 0 |
| D | 0 | 21 | 0 |
| Mode M0 | |||
|---|---|---|---|
| Quadrant | BADHDUFLAG | Total packets | Discarded packets |
| A | 0 | 13734 | 3 |
| B | 0 | 14412 | 2 |
| C | 0 | 13968 | 2 |
| D | 0 | 19482 | 2 |
| Mode SS | |||
|---|---|---|---|
| Quadrant | BADHDUFLAG | Total packets | Discarded packets |
| A | 0 | 132 | 0 |
| B | 0 | 132 | 0 |
| C | 0 | 132 | 0 |
| D | 0 | 132 | 0 |
| Quadrant | Total seconds | Saturated seconds | Saturation percentage |
|---|---|---|---|
| A | 6561 | 20 | 0.304832% |
| B | 6561 | 37 | 0.563938% |
| C | 6561 | 12 | 0.182899% |
| D | 6561 | 295 | 4.496266% |
Noise dominated data is calculated using 1-second bins in cleaned event files. If a bin has >2000 counts, and if more than 50% of those come from <1% of pixels, then it is considered to be noise-dominated and hence unusable.
| Quadrant | # 1 sec bins | Bins with >0 counts | Bins with >2000 counts | High rate bins dominated by noise | Noise dominated (total time) | Noise dominated (detector-on time) | Marked lightcurve |
|---|---|---|---|---|---|---|---|
| A | 7847 | 6563 | 0 | 0 | 0.00% | 0.00% | 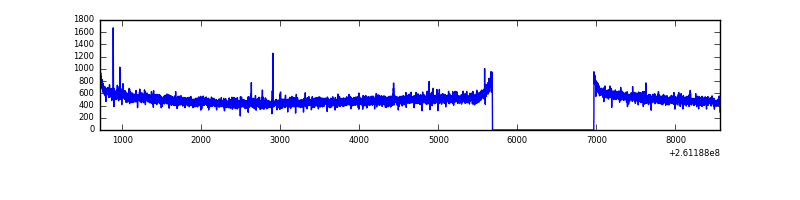 |
| B | 7847 | 6563 | 2 | 2 | 0.03% | 0.03% | 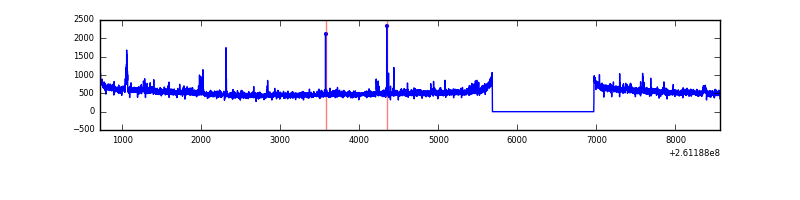 |
| C | 7847 | 6563 | 0 | 0 | 0.00% | 0.00% | 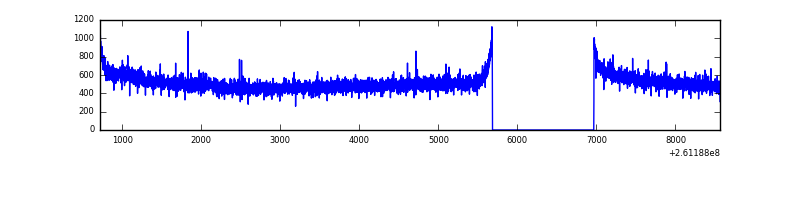 |
| D | 7847 | 6563 | 229 | 229 | 2.92% | 3.49% | 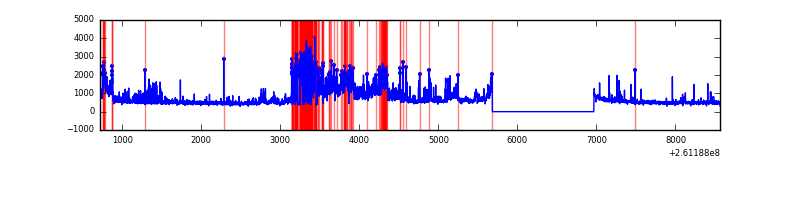 |
Top three noisy pixels from each quadrant. If the there are fewer than three noisy pixels in the level2.evt file, extra rows are filled as -1
| Pixel properties | Quadrant properties | ||||||
|---|---|---|---|---|---|---|---|
| Quadrant | DetID | PixID | Counts | Sigma | Mean | Median | Sigma |
| A | 0 | 226 | 7347 | 38.37 | 845 | 830 | 169.8 |
| A | 12 | 194 | 6354 | 32.52 | 845 | 830 | 169.8 |
| A | 1 | 162 | 5346 | 26.59 | 845 | 830 | 169.8 |
| B | 10 | 244 | 40978 | 254.12 | 858 | 839 | 158.0 |
| B | 8 | 250 | 28417 | 174.59 | 858 | 839 | 158.0 |
| B | 0 | 219 | 24049 | 146.94 | 858 | 839 | 158.0 |
| C | 3 | 233 | 116942 | 603.61 | 836 | 843 | 192.3 |
| C | 13 | 61 | 5972 | 26.67 | 836 | 843 | 192.3 |
| C | 12 | 4 | 3071 | 11.58 | 836 | 843 | 192.3 |
| D | 5 | 222 | 1777971 | 9314.22 | 809 | 788 | 190.8 |
| D | 8 | 195 | 171989 | 897.26 | 809 | 788 | 190.8 |
| D | 10 | 157 | 51282 | 264.64 | 809 | 788 | 190.8 |
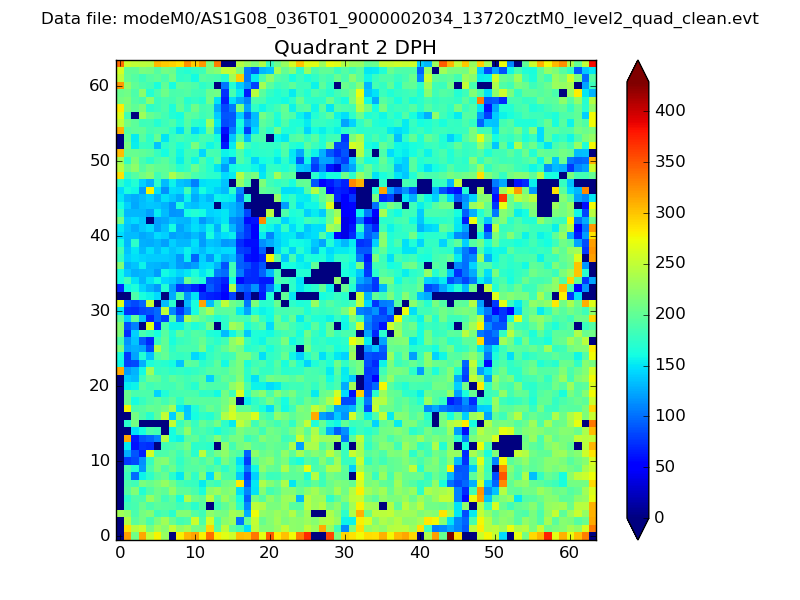
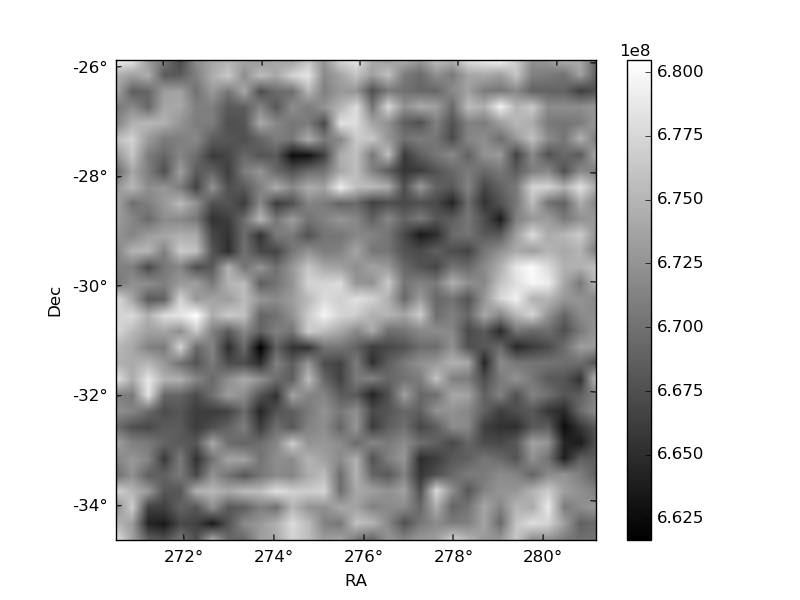
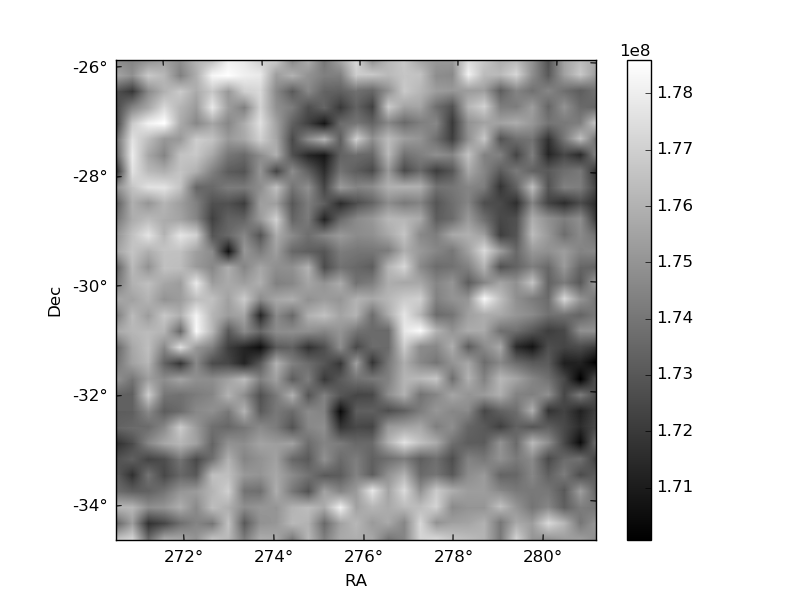
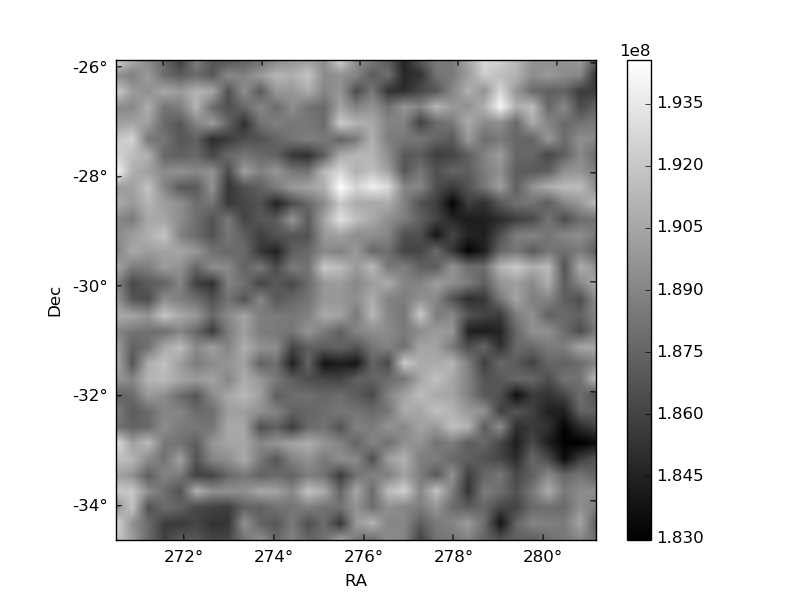
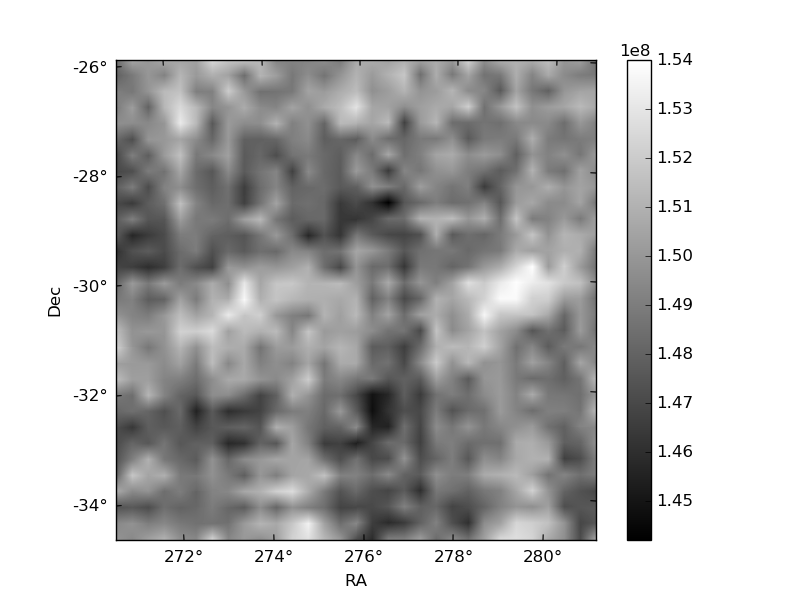
Histogram calculated using DETX and DETY for each event in the final _common_clean file
| Quadrant A | 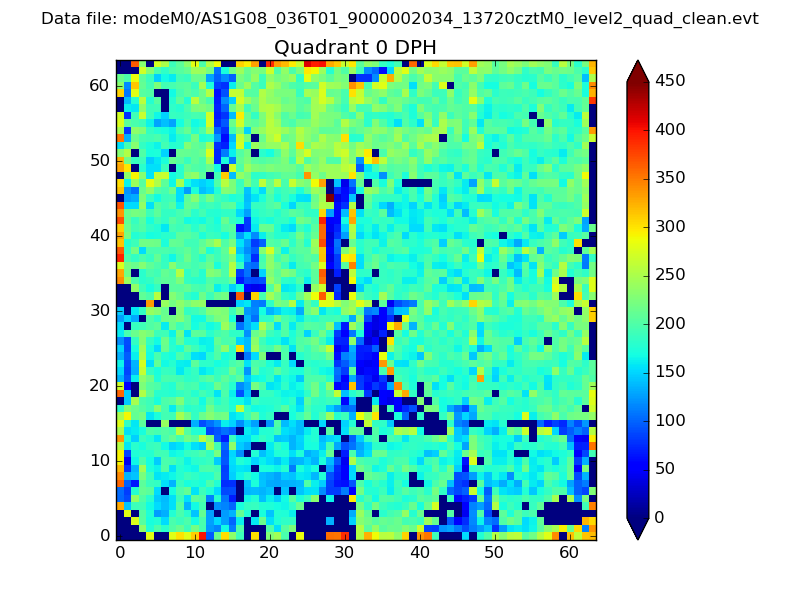 |
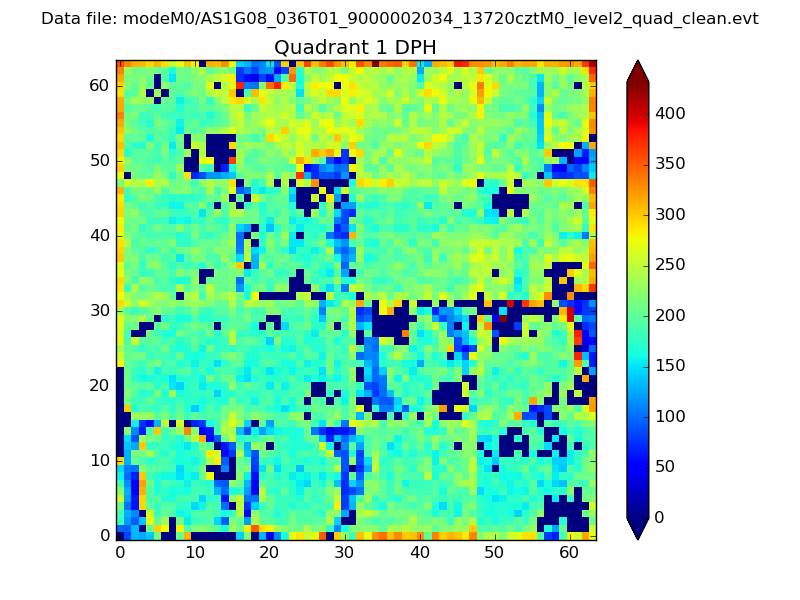 |
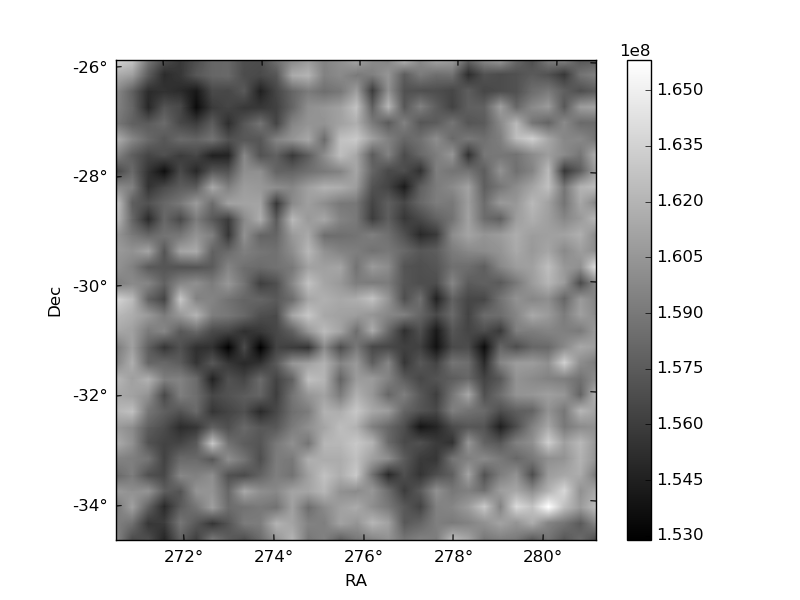
Quadrant B |
|---|---|---|---|
| Quadrant D | 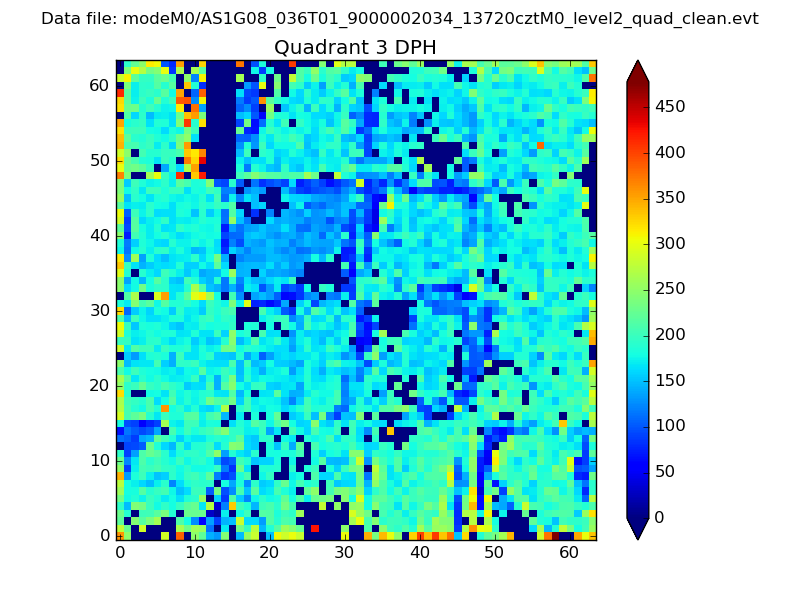 |
 |
Quadrant C |
| Plot type | Count rate plots | Images |
|---|---|---|
| Comparison with Poisson distribution Blue bars denote a histogram of data divided into 1 sec bins. Red curve is a Poisson curve with rate = median count rate of data. |
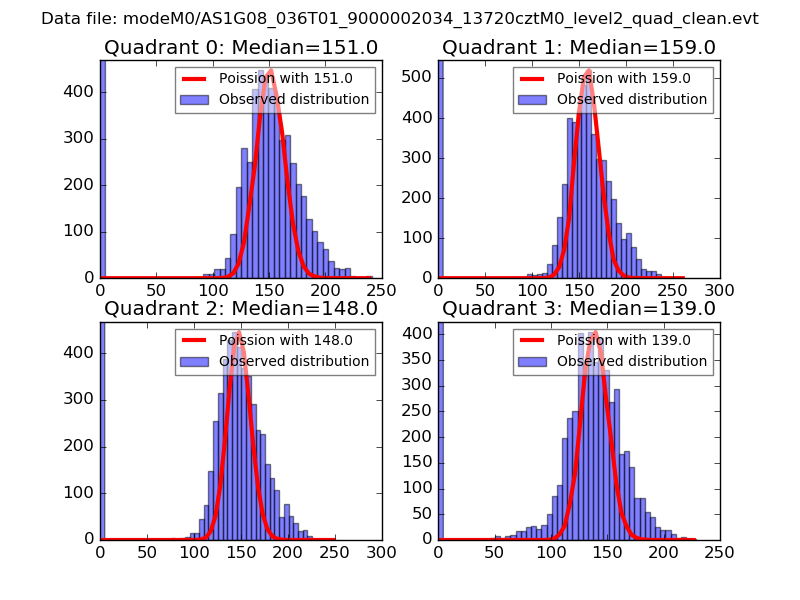 |
 |
| Quadrant-wise count rates Data is divided into 100 sec bins |
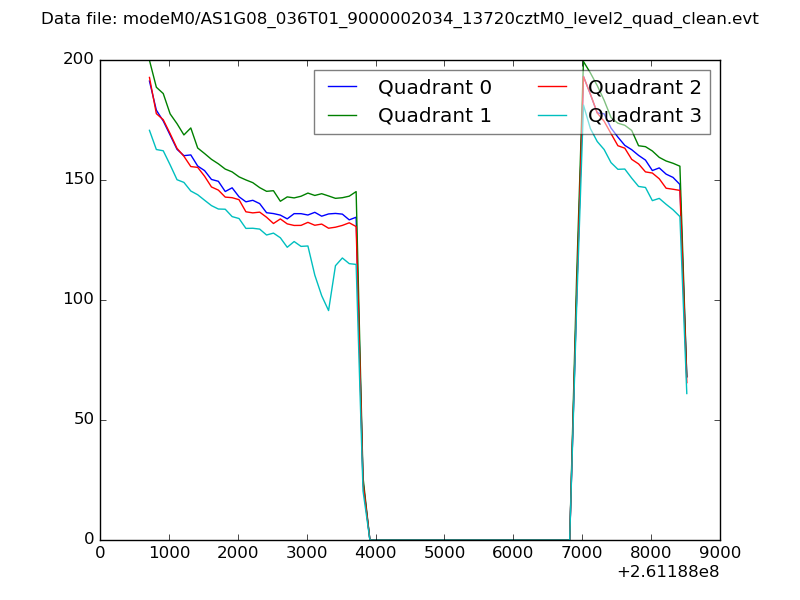 |
|
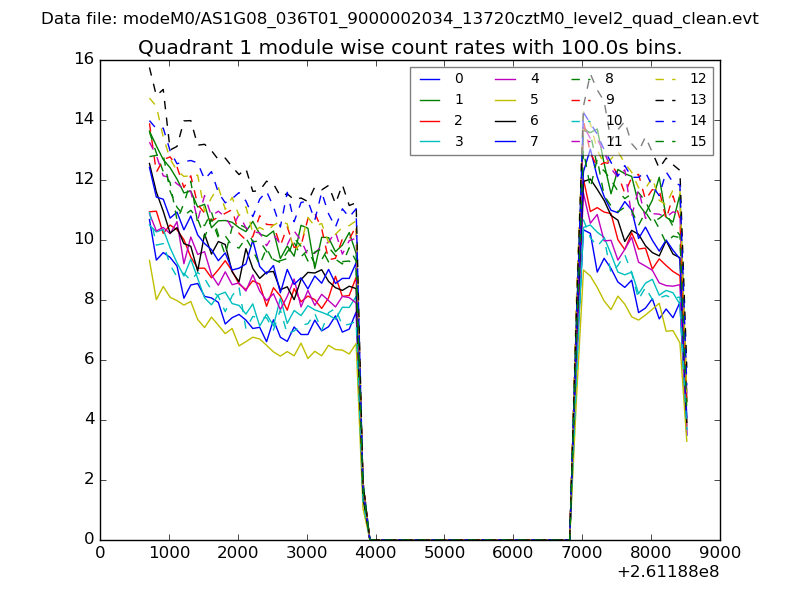
| Module-wise count rates for Quadrant A Data is divided into 100 sec bins |
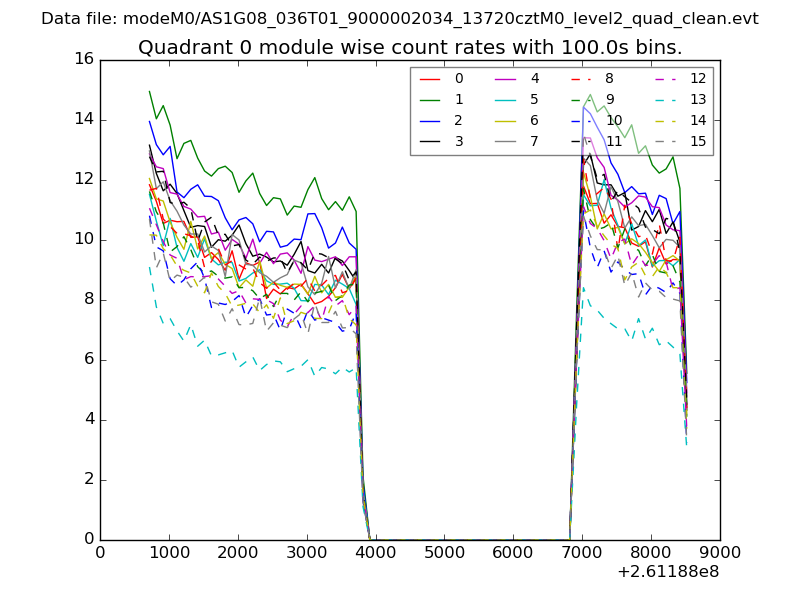 |
 |
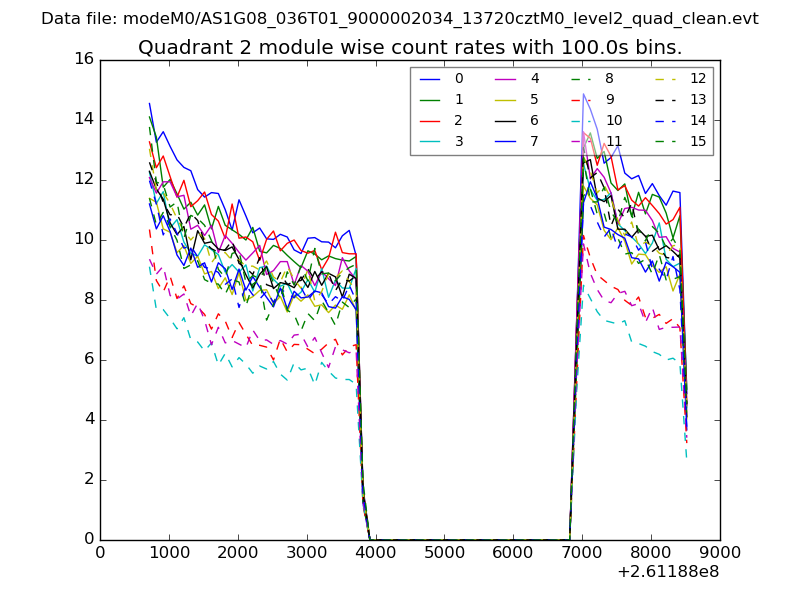
| Module-wise count rates for Quadrant B Data is divided into 100 sec bins |
 |
 |
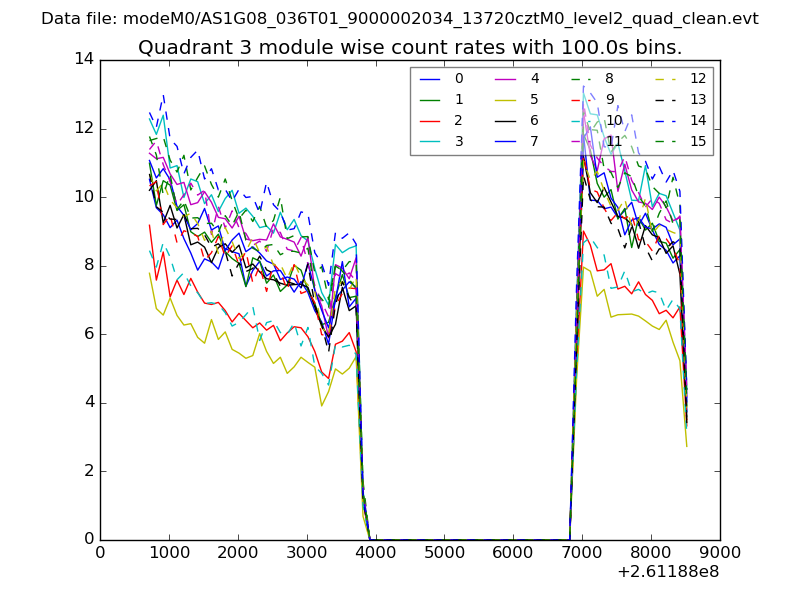
| Module-wise count rates for Quadrant C Data is divided into 100 sec bins |
 |
 |
| Module-wise count rates for Quadrant D Data is divided into 100 sec bins |
 |
 |
| Parameter | Plot |
|---|---|
| CZT HV Monitor | 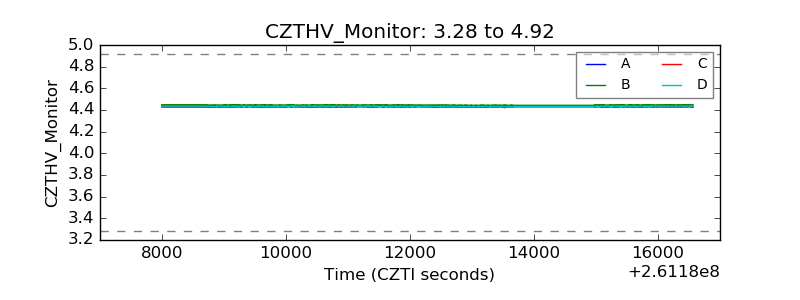 |
| D_VDD | 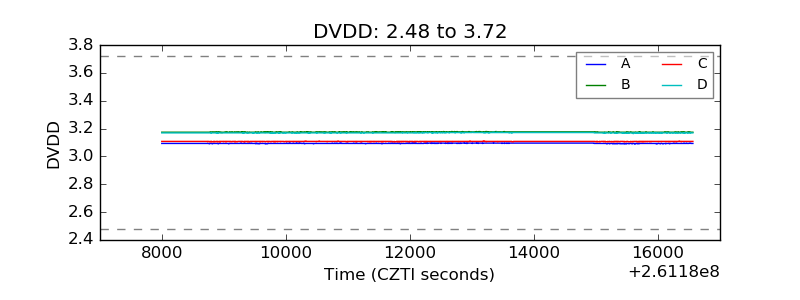 |
| Temperature 1 | 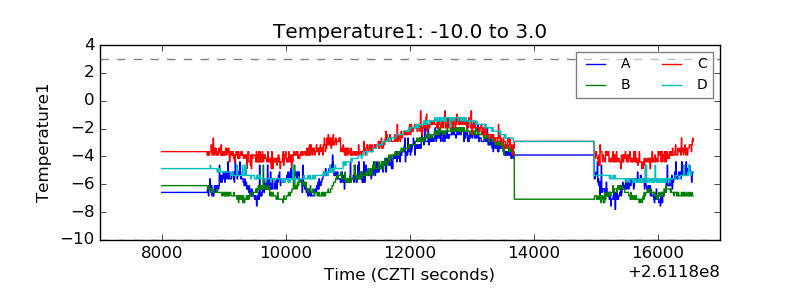 |
| Veto HV Monitor | 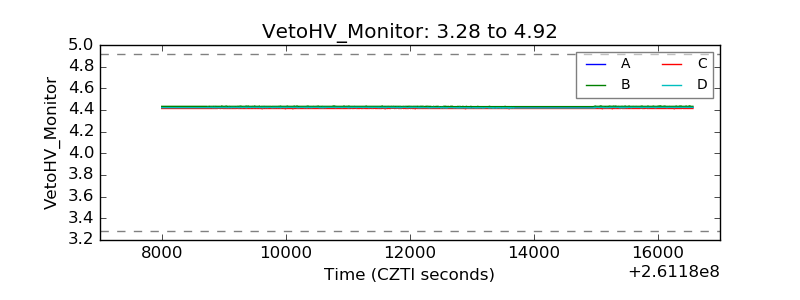 |
| Veto LLD | 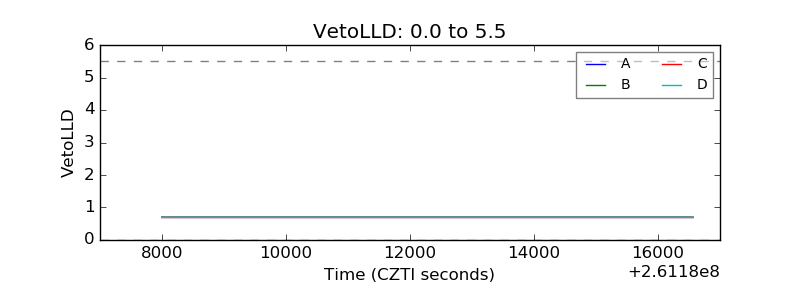 |
| Alpha Counter | 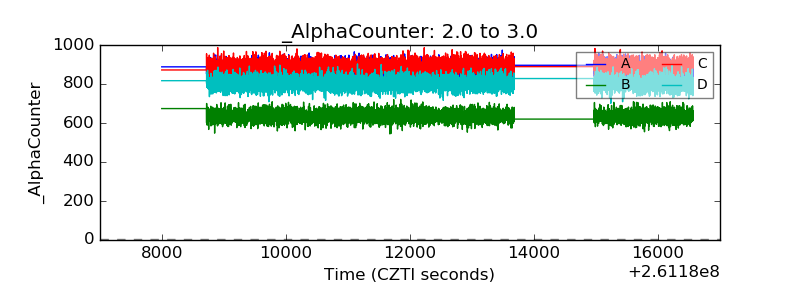 |
| _CPM_Rate | 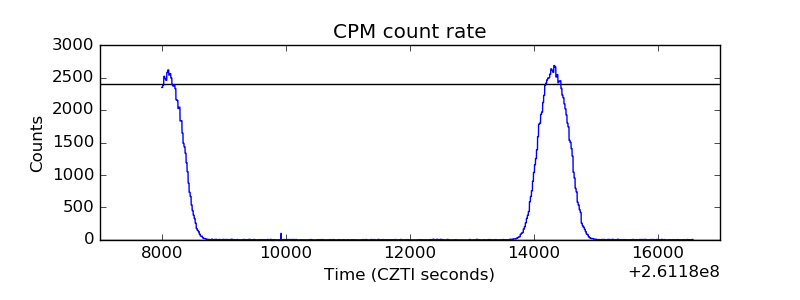 |
| CZT Counter | 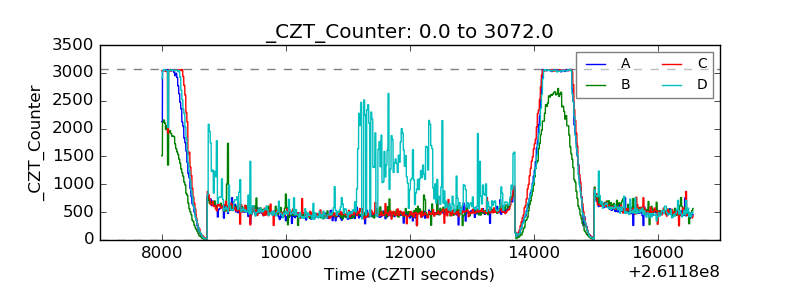 |
| +2.5 Volts monitor |  |
| +5 Volts monitor |  |
| _ROLL_ROT | 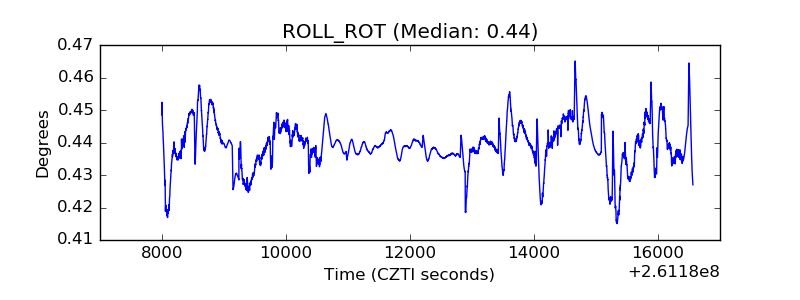 |
| _Roll_DEC | 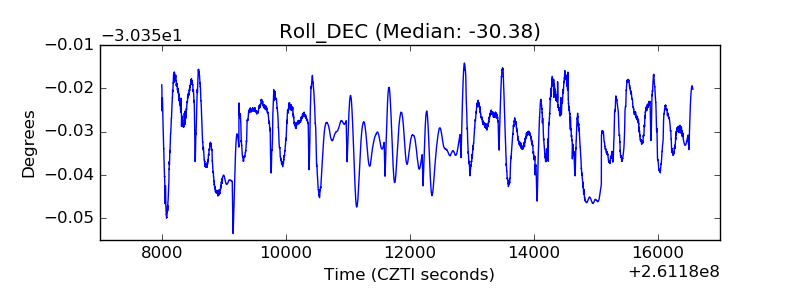 |
| _Roll_RA | 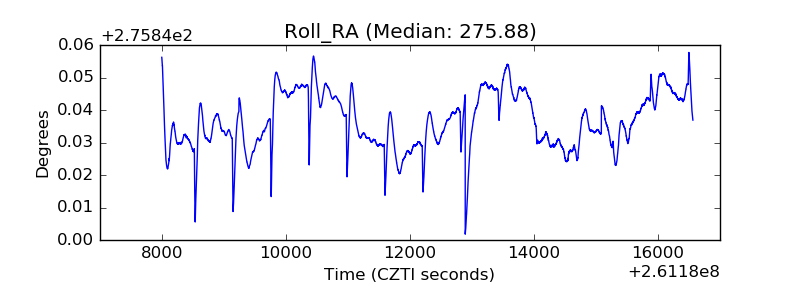 |
| Veto Counter | 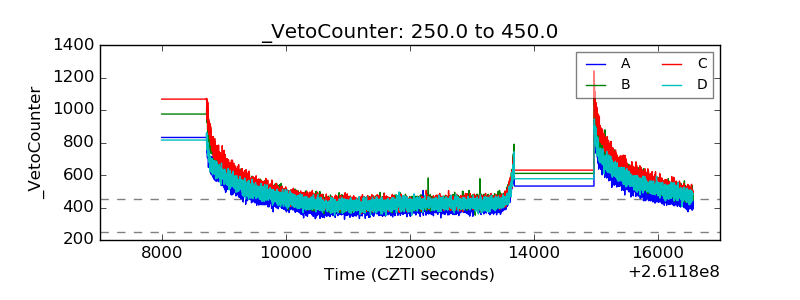 |