| Param | Original file | Final file |
|---|---|---|
| Filename | modeM0/AS1G08_036T01_9000002034_13721cztM0_level2.evt | modeM0/AS1G08_036T01_9000002034_13721cztM0_level2_quad_clean.evt |
| Size (bytes) | 471,516,480 | 105,384,960 |
| Size | 449.7 MB | 100.5 MB |
| Events in quadrant A | 3,304,127 | 695,186 |
| Events in quadrant B | 3,600,830 | 721,271 |
| Events in quadrant C | 3,427,760 | 679,736 |
| Events in quadrant D | 3,503,965 | 640,194 |
| Mode M9 | |||
|---|---|---|---|
| Quadrant | BADHDUFLAG | Total packets | Discarded packets |
| A | 0 | 15 | 0 |
| B | 0 | 15 | 0 |
| C | 0 | 15 | 0 |
| D | 0 | 16 | 0 |
| Mode M0 | |||
|---|---|---|---|
| Quadrant | BADHDUFLAG | Total packets | Discarded packets |
| A | 0 | 13706 | 3 |
| B | 0 | 14624 | 2 |
| C | 0 | 13978 | 2 |
| D | 0 | 14430 | 2 |
| Mode SS | |||
|---|---|---|---|
| Quadrant | BADHDUFLAG | Total packets | Discarded packets |
| A | 0 | 132 | 0 |
| B | 0 | 132 | 0 |
| C | 0 | 132 | 0 |
| D | 0 | 132 | 0 |
| Quadrant | Total seconds | Saturated seconds | Saturation percentage |
|---|---|---|---|
| A | 6531 | 19 | 0.290920% |
| B | 6531 | 34 | 0.520594% |
| C | 6531 | 20 | 0.306232% |
| D | 6531 | 25 | 0.382790% |
Noise dominated data is calculated using 1-second bins in cleaned event files. If a bin has >2000 counts, and if more than 50% of those come from <1% of pixels, then it is considered to be noise-dominated and hence unusable.
| Quadrant | # 1 sec bins | Bins with >0 counts | Bins with >2000 counts | High rate bins dominated by noise | Noise dominated (total time) | Noise dominated (detector-on time) | Marked lightcurve |
|---|---|---|---|---|---|---|---|
| A | 7877 | 6533 | 0 | 0 | 0.00% | 0.00% | 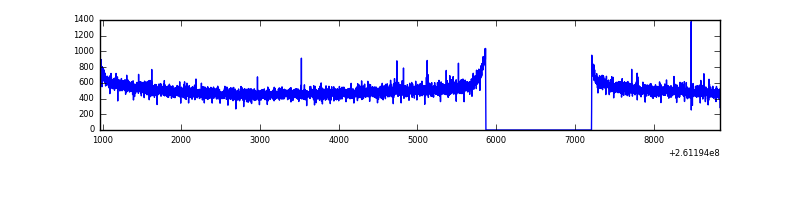 |
| B | 7877 | 6533 | 2 | 2 | 0.03% | 0.03% | 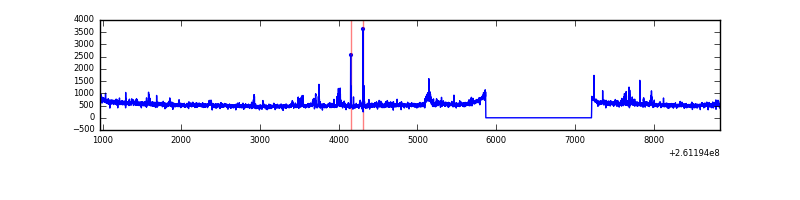 |
| C | 7877 | 6533 | 2 | 2 | 0.03% | 0.03% | 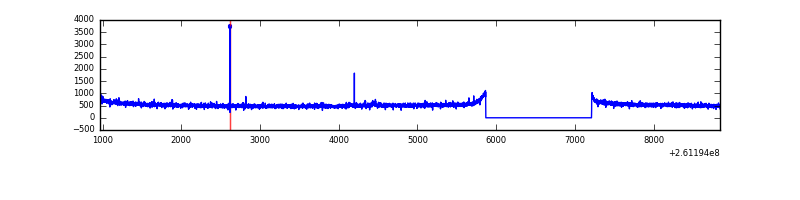 |
| D | 7877 | 6533 | 12 | 12 | 0.15% | 0.18% | 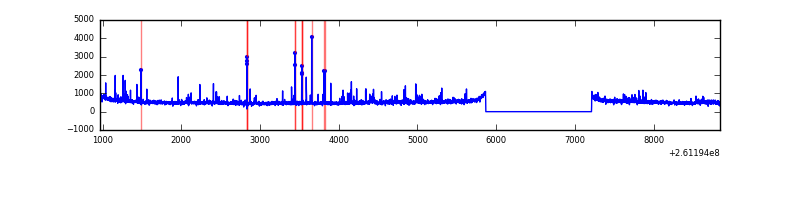 |
Top three noisy pixels from each quadrant. If the there are fewer than three noisy pixels in the level2.evt file, extra rows are filled as -1
| Pixel properties | Quadrant properties | ||||||
|---|---|---|---|---|---|---|---|
| Quadrant | DetID | PixID | Counts | Sigma | Mean | Median | Sigma |
| A | 0 | 226 | 7504 | 38.87 | 859 | 841 | 171.4 |
| A | 12 | 194 | 6387 | 32.35 | 859 | 841 | 171.4 |
| A | 3 | 137 | 4822 | 23.22 | 859 | 841 | 171.4 |
| B | 10 | 244 | 96511 | 600.54 | 865 | 847 | 159.3 |
| B | 8 | 250 | 53189 | 328.58 | 865 | 847 | 159.3 |
| B | 0 | 219 | 22933 | 138.65 | 865 | 847 | 159.3 |
| C | 3 | 233 | 116064 | 591.96 | 846 | 852 | 194.6 |
| C | 4 | 254 | 11624 | 55.35 | 846 | 852 | 194.6 |
| C | 13 | 61 | 5916 | 26.02 | 846 | 852 | 194.6 |
| D | 8 | 195 | 125164 | 584.76 | 828 | 812 | 212.7 |
| D | 5 | 222 | 102933 | 480.22 | 828 | 812 | 212.7 |
| D | 1 | 52 | 48390 | 223.73 | 828 | 812 | 212.7 |
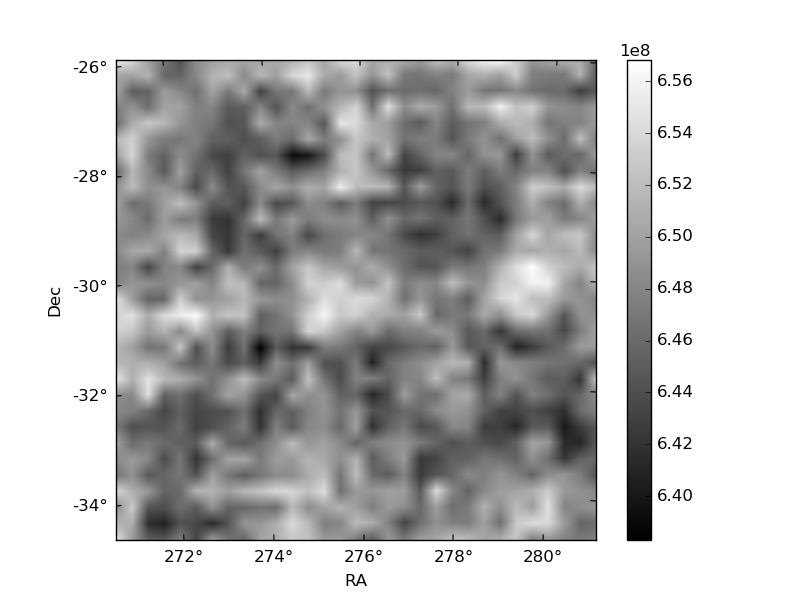
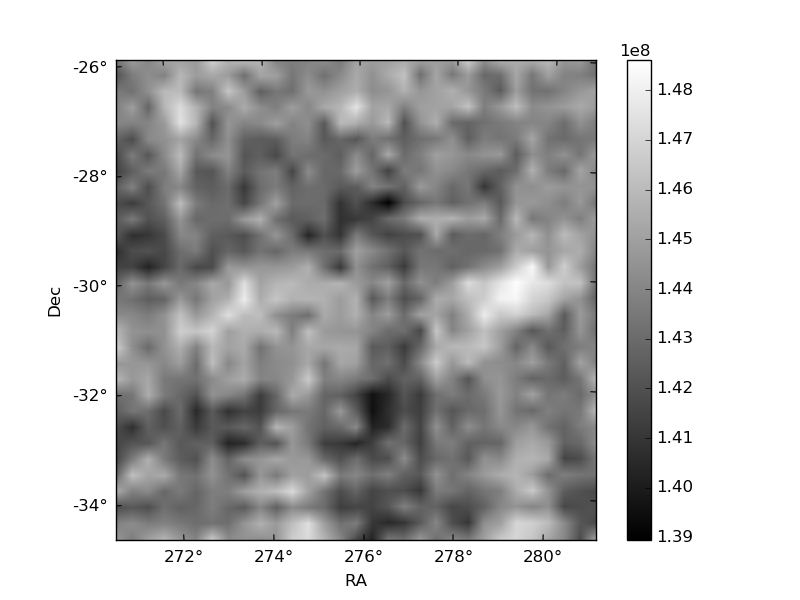
Histogram calculated using DETX and DETY for each event in the final _common_clean file
| Quadrant A | 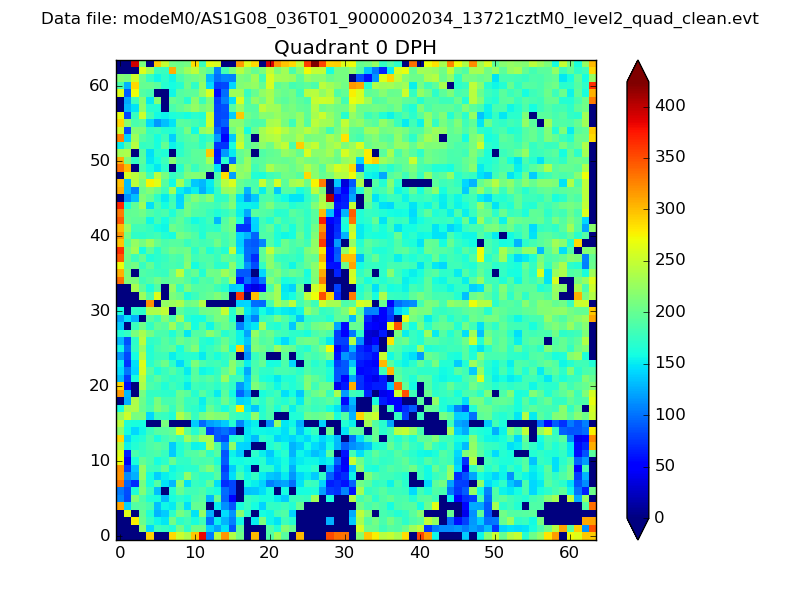 |
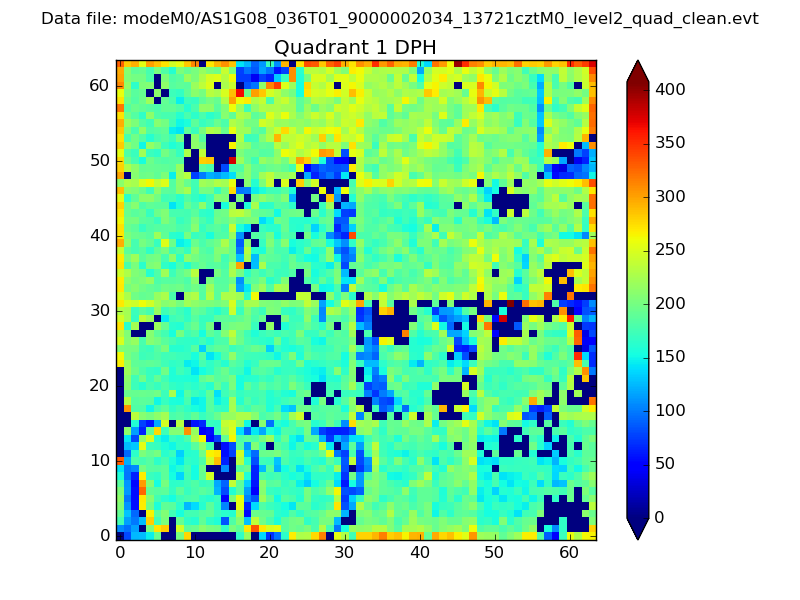 |
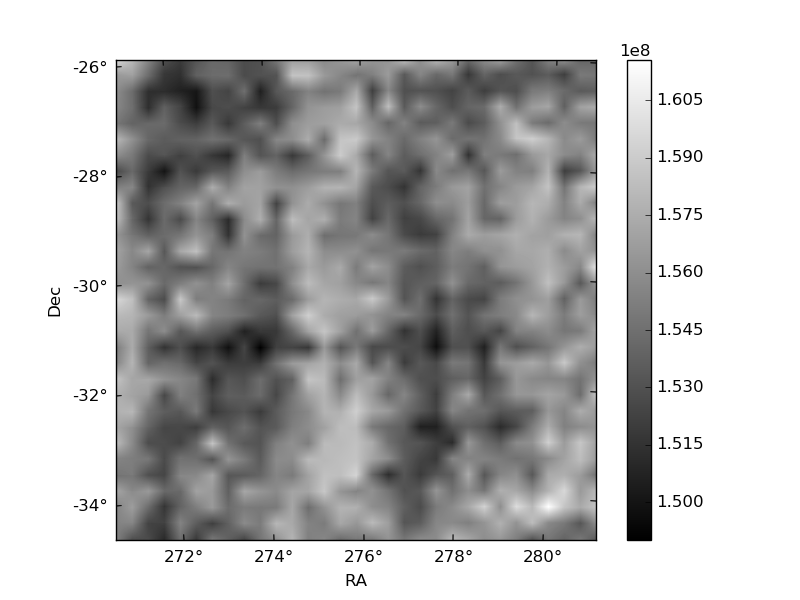
Quadrant B |
|---|---|---|---|
| Quadrant D | 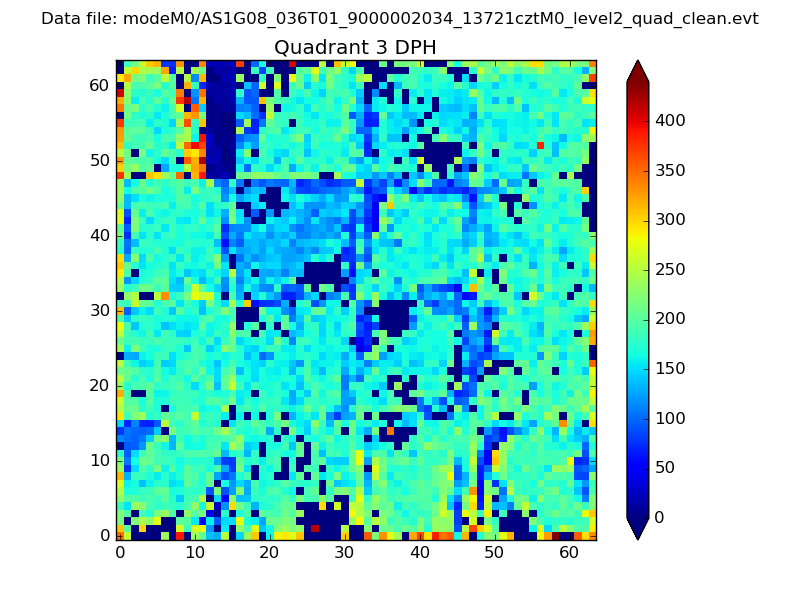 |
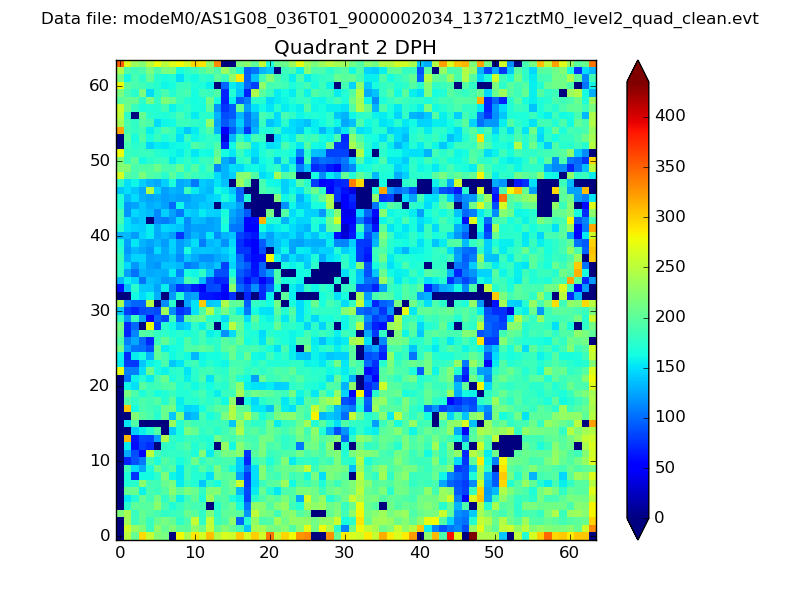 |
Quadrant C |
| Plot type | Count rate plots | Images |
|---|---|---|
| Comparison with Poisson distribution Blue bars denote a histogram of data divided into 1 sec bins. Red curve is a Poisson curve with rate = median count rate of data. |
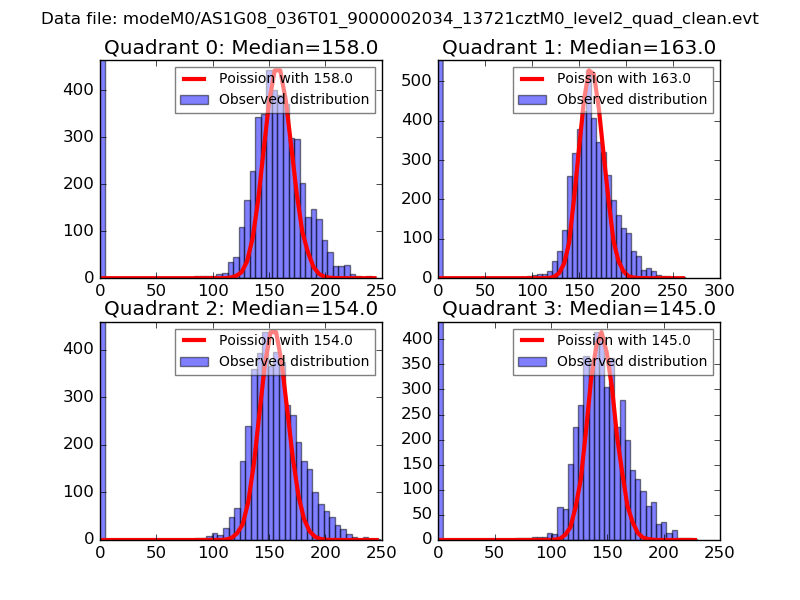 |
 |
| Quadrant-wise count rates Data is divided into 100 sec bins |
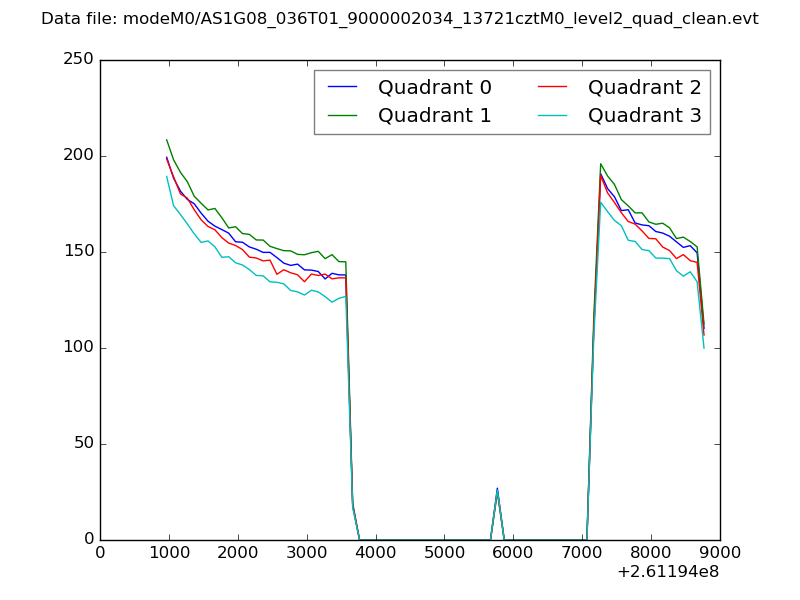 |
|
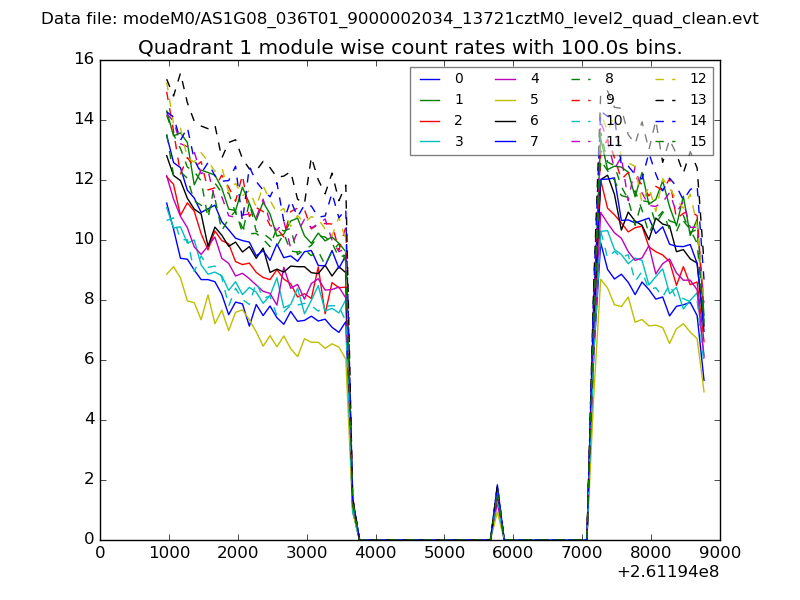
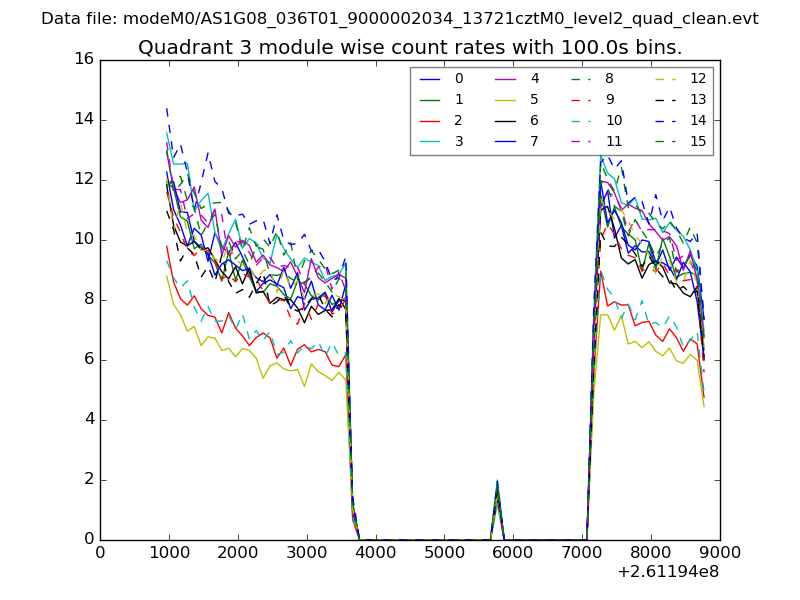
| Module-wise count rates for Quadrant A Data is divided into 100 sec bins |
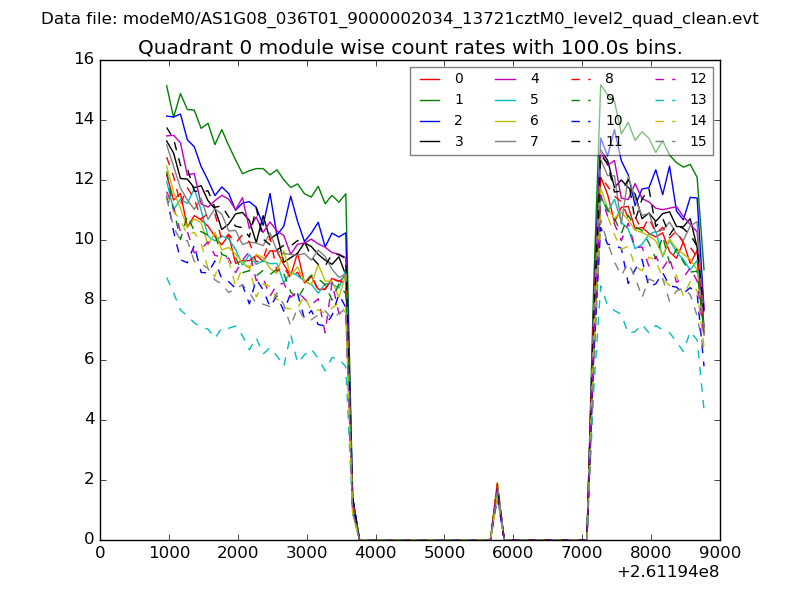 |
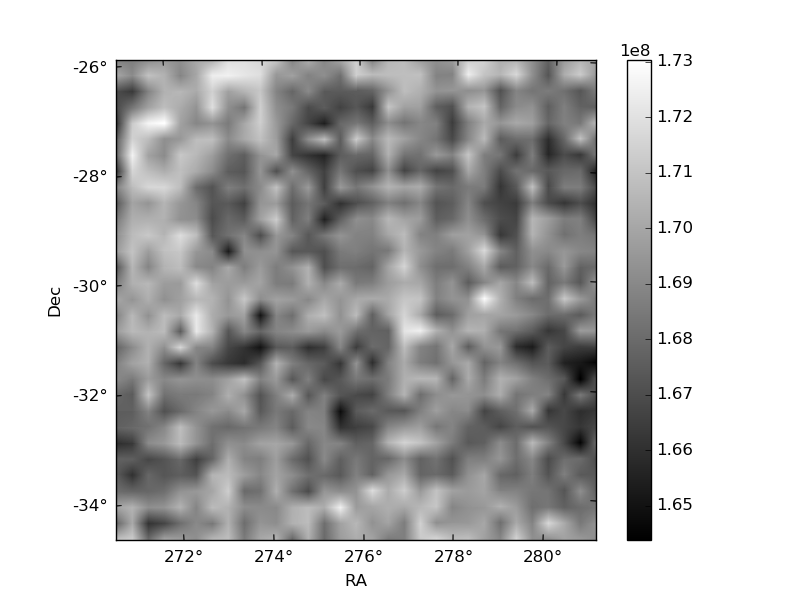 |
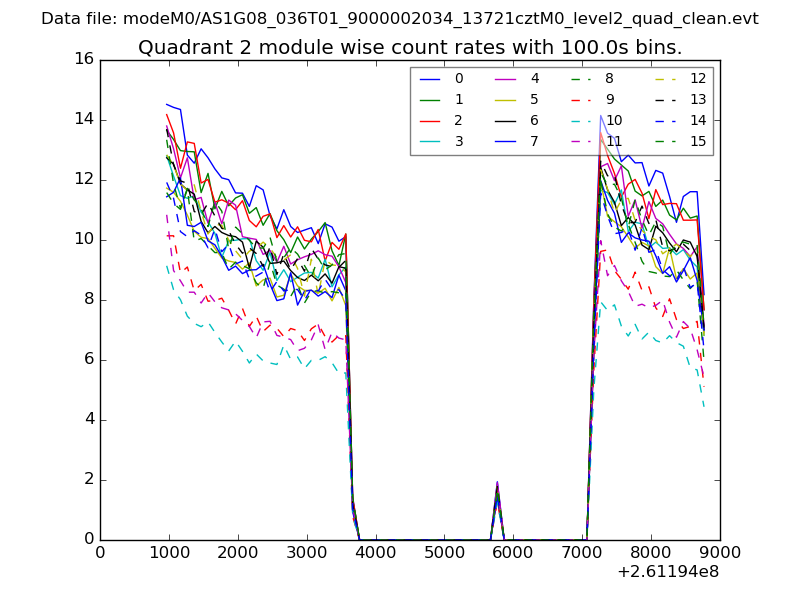
| Module-wise count rates for Quadrant B Data is divided into 100 sec bins |
 |
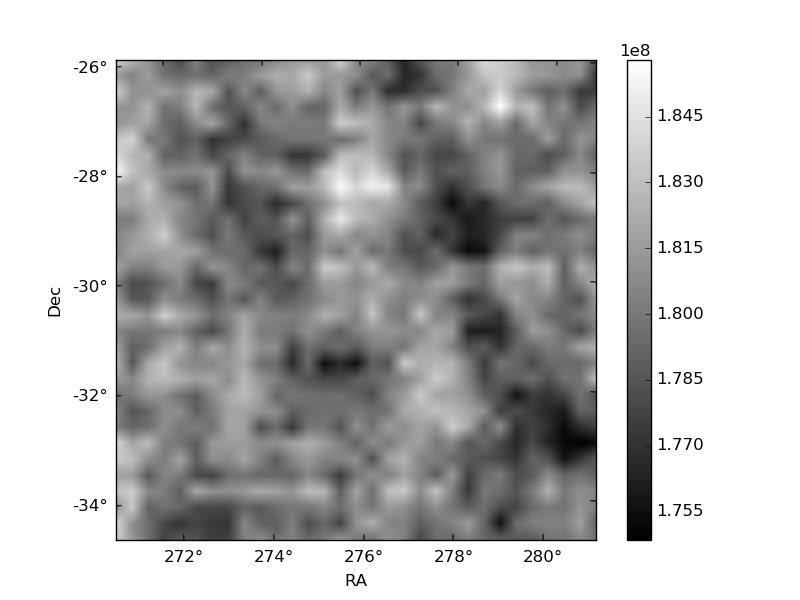 |
| Module-wise count rates for Quadrant C Data is divided into 100 sec bins |
 |
 |
| Module-wise count rates for Quadrant D Data is divided into 100 sec bins |
 |
 |
| Parameter | Plot |
|---|---|
| CZT HV Monitor | 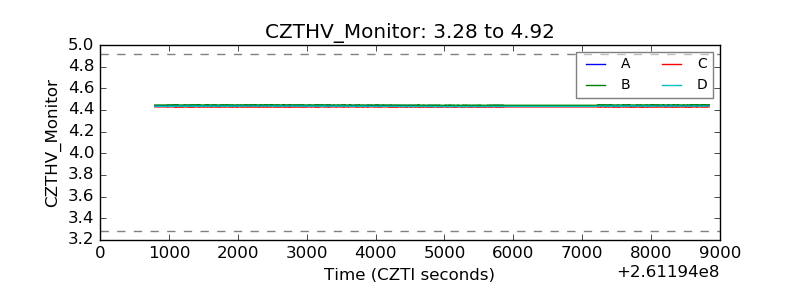 |
| D_VDD | 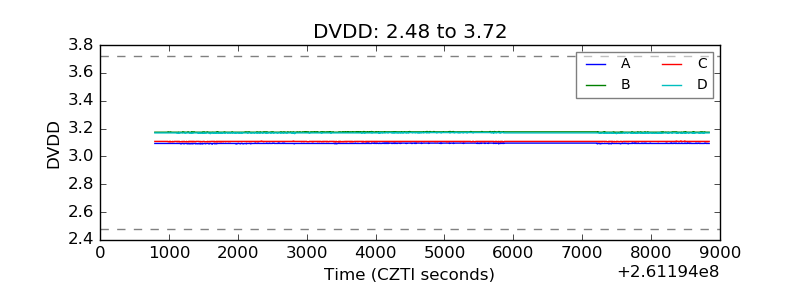 |
| Temperature 1 | 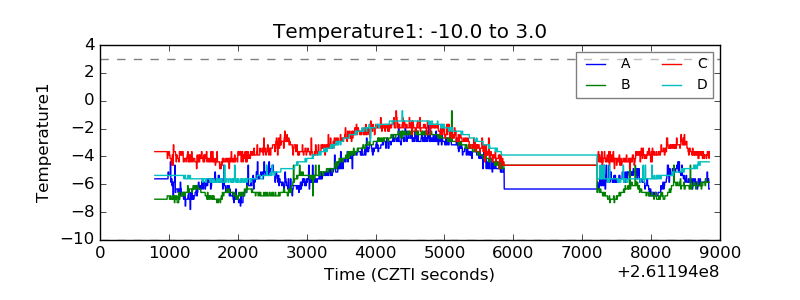 |
| Veto HV Monitor | 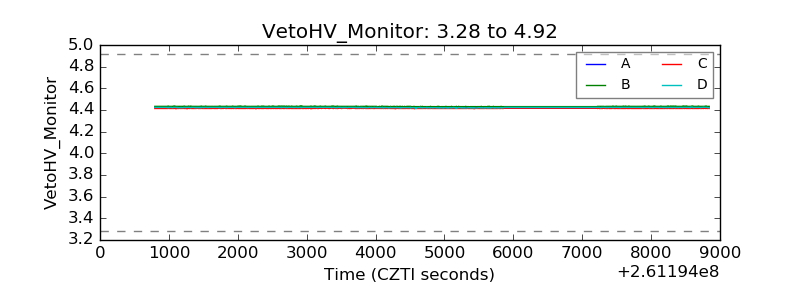 |
| Veto LLD | 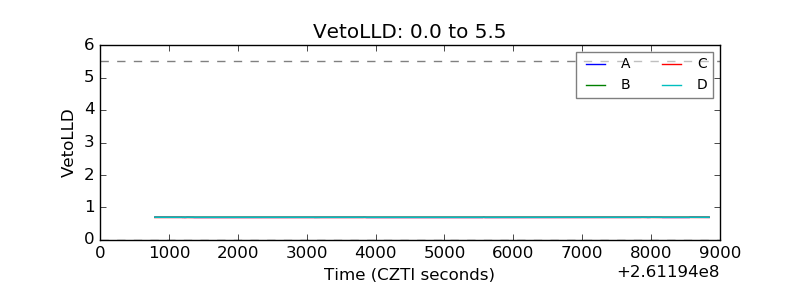 |
| Alpha Counter | 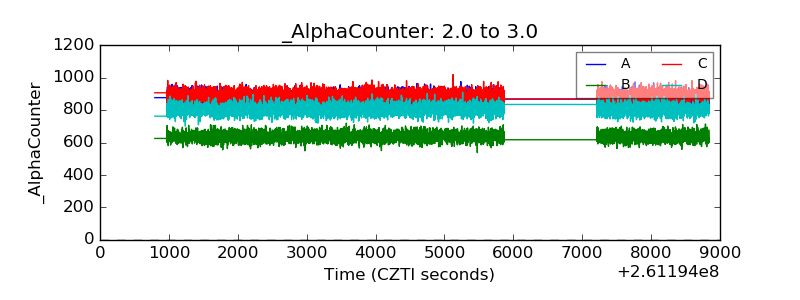 |
| _CPM_Rate |  |
| CZT Counter | 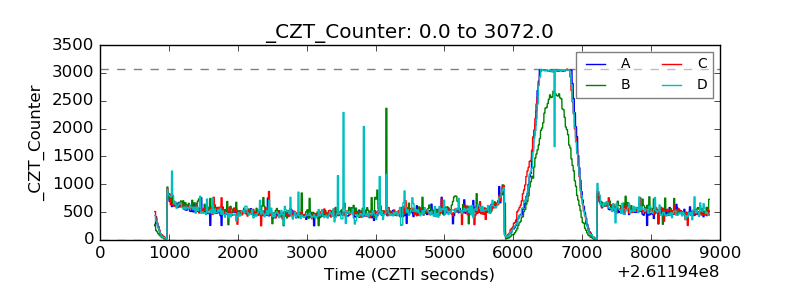 |
| +2.5 Volts monitor |  |
| +5 Volts monitor |  |
| _ROLL_ROT | 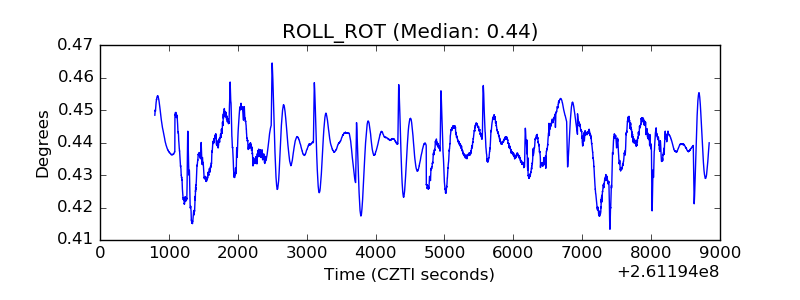 |
| _Roll_DEC |  |
| _Roll_RA | 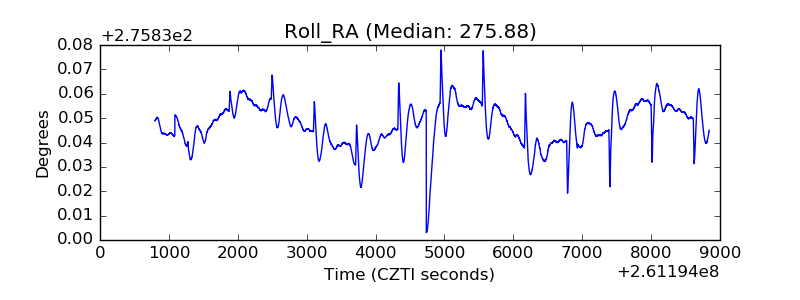 |
| Veto Counter | 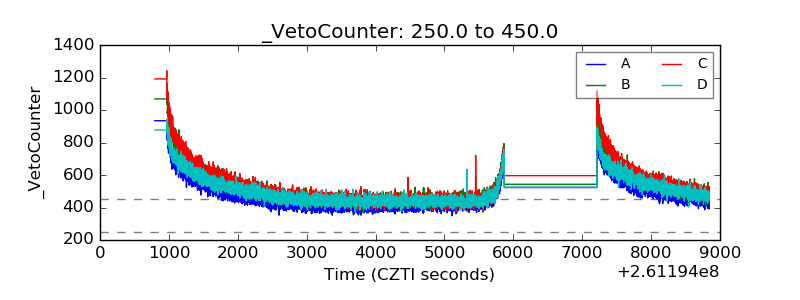 |