| Param | Original file | Final file |
|---|---|---|
| Filename | modeM0/AS1G08_036T01_9000002034_13722cztM0_level2.evt | modeM0/AS1G08_036T01_9000002034_13722cztM0_level2_quad_clean.evt |
| Size (bytes) | 391,639,680 | 74,093,760 |
| Size | 373.5 MB | 70.7 MB |
| Events in quadrant A | 2,637,086 | 478,738 |
| Events in quadrant B | 3,233,386 | 492,522 |
| Events in quadrant C | 2,693,899 | 461,089 |
| Events in quadrant D | 2,937,603 | 441,660 |
| Mode M9 | |||
|---|---|---|---|
| Quadrant | BADHDUFLAG | Total packets | Discarded packets |
| A | 0 | 13 | 0 |
| B | 0 | 13 | 0 |
| C | 0 | 13 | 0 |
| D | 0 | 13 | 0 |
| Mode M0 | |||
|---|---|---|---|
| Quadrant | BADHDUFLAG | Total packets | Discarded packets |
| A | 0 | 10947 | 2 |
| B | 0 | 12925 | 1 |
| C | 0 | 10992 | 1 |
| D | 0 | 11932 | 1 |
| Mode SS | |||
|---|---|---|---|
| Quadrant | BADHDUFLAG | Total packets | Discarded packets |
| A | 0 | 108 | 0 |
| B | 0 | 108 | 0 |
| C | 0 | 108 | 0 |
| D | 0 | 108 | 0 |
| Quadrant | Total seconds | Saturated seconds | Saturation percentage |
|---|---|---|---|
| A | 5276 | 22 | 0.416983% |
| B | 5276 | 67 | 1.269901% |
| C | 5276 | 11 | 0.208491% |
| D | 5276 | 15 | 0.284306% |
Noise dominated data is calculated using 1-second bins in cleaned event files. If a bin has >2000 counts, and if more than 50% of those come from <1% of pixels, then it is considered to be noise-dominated and hence unusable.
| Quadrant | # 1 sec bins | Bins with >0 counts | Bins with >2000 counts | High rate bins dominated by noise | Noise dominated (total time) | Noise dominated (detector-on time) | Marked lightcurve |
|---|---|---|---|---|---|---|---|
| A | 6622 | 5278 | 0 | 0 | 0.00% | 0.00% | 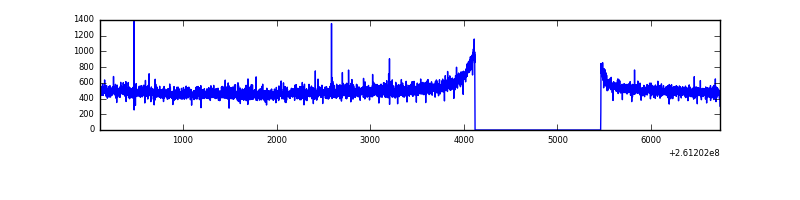 |
| B | 6622 | 5278 | 6 | 6 | 0.09% | 0.11% | 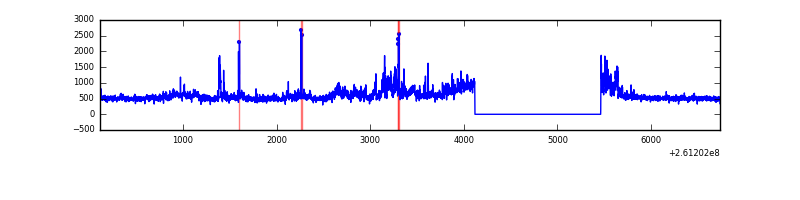 |
| C | 6622 | 5278 | 0 | 0 | 0.00% | 0.00% | 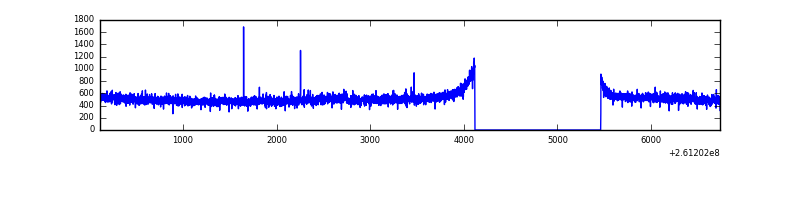 |
| D | 6622 | 5278 | 4 | 4 | 0.06% | 0.08% | 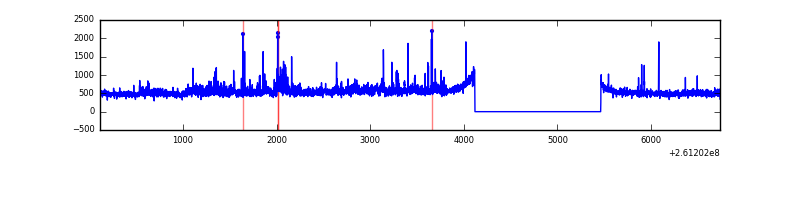 |
Top three noisy pixels from each quadrant. If the there are fewer than three noisy pixels in the level2.evt file, extra rows are filled as -1
| Pixel properties | Quadrant properties | ||||||
|---|---|---|---|---|---|---|---|
| Quadrant | DetID | PixID | Counts | Sigma | Mean | Median | Sigma |
| A | 1 | 162 | 7010 | 46.0 | 683 | 670 | 137.8 |
| A | 0 | 226 | 6163 | 39.86 | 683 | 670 | 137.8 |
| A | 12 | 194 | 5216 | 32.99 | 683 | 670 | 137.8 |
| B | 10 | 244 | 351299 | 2758.25 | 680 | 668 | 127.1 |
| B | 8 | 250 | 155147 | 1215.22 | 680 | 668 | 127.1 |
| B | 0 | 214 | 44918 | 348.09 | 680 | 668 | 127.1 |
| C | 3 | 233 | 85170 | 552.35 | 664 | 669 | 153.0 |
| C | 4 | 254 | 14831 | 92.57 | 664 | 669 | 153.0 |
| C | 13 | 61 | 4785 | 26.9 | 664 | 669 | 153.0 |
| D | 5 | 222 | 198033 | 1150.8 | 658 | 644 | 171.5 |
| D | 8 | 195 | 92162 | 533.56 | 658 | 644 | 171.5 |
| D | 1 | 52 | 72342 | 418.01 | 658 | 644 | 171.5 |
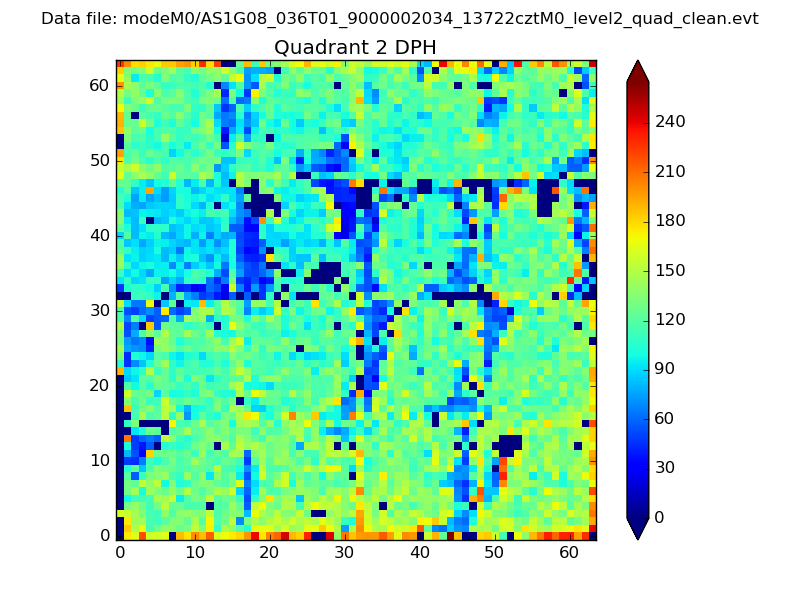
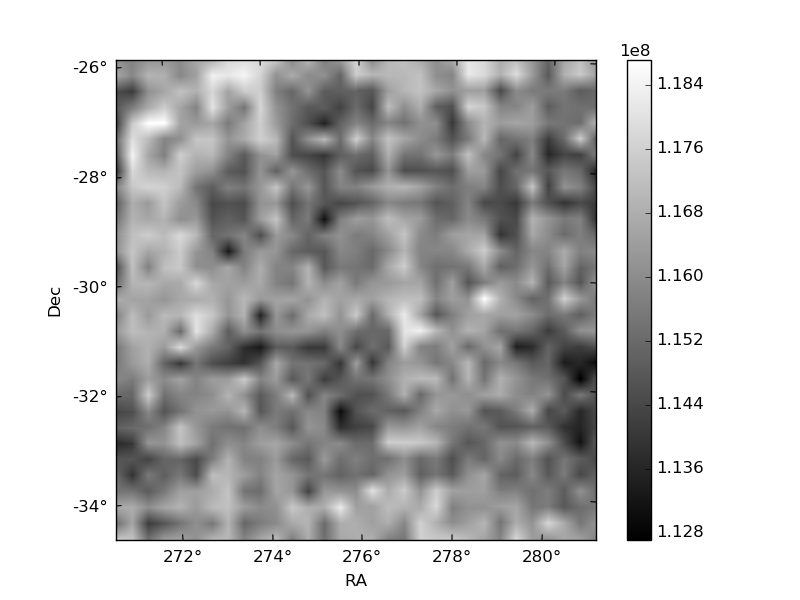
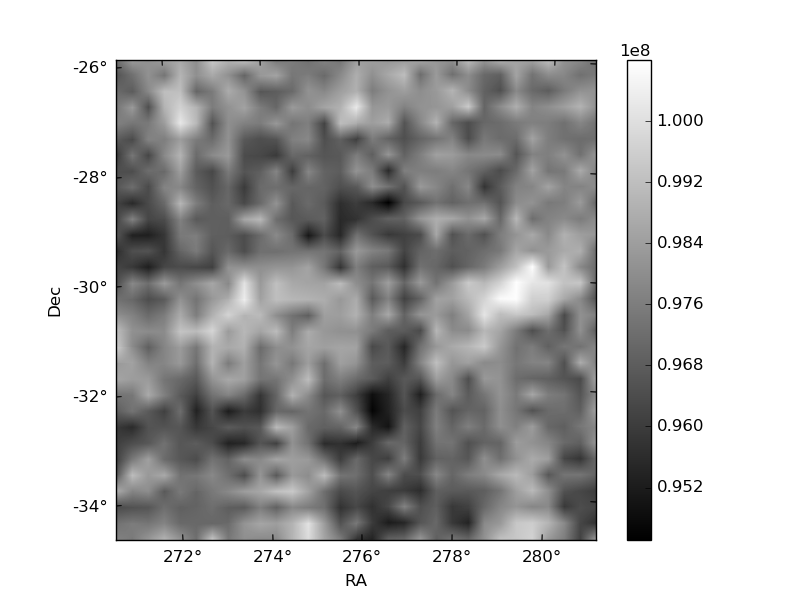
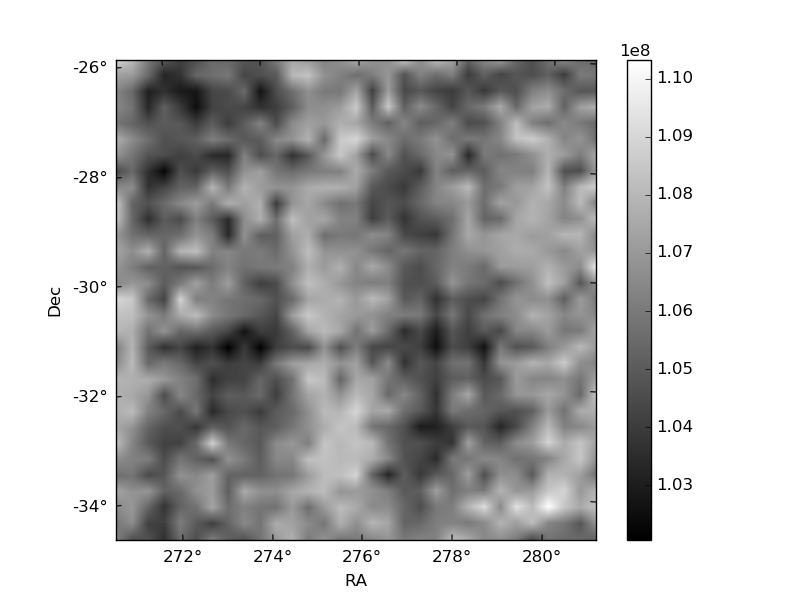
Histogram calculated using DETX and DETY for each event in the final _common_clean file
| Quadrant A | 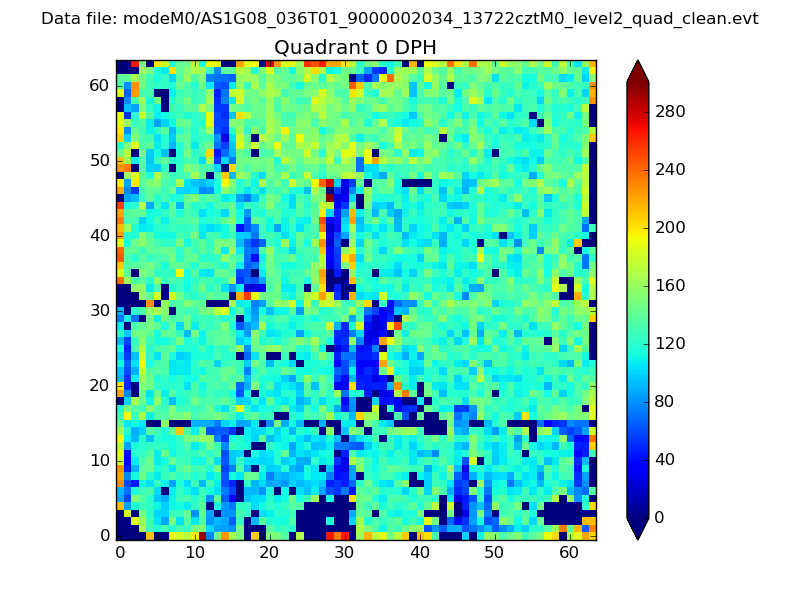 |
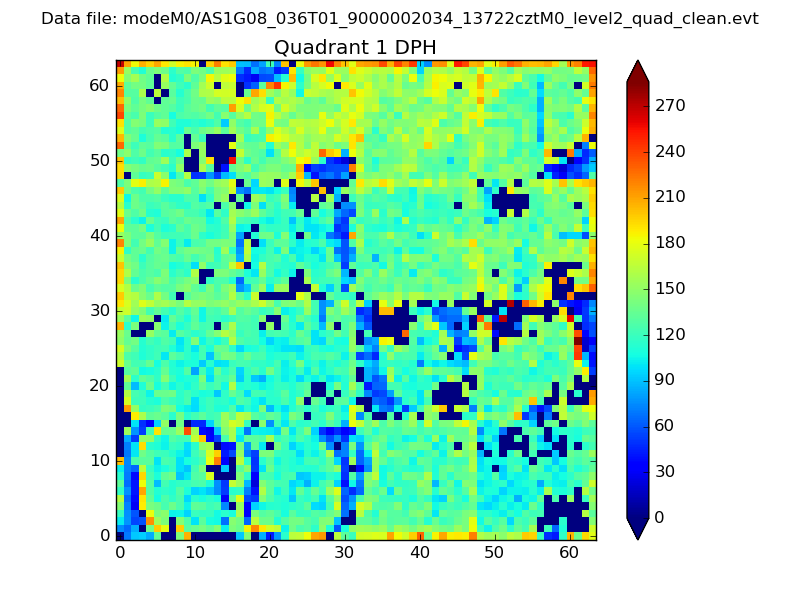 |
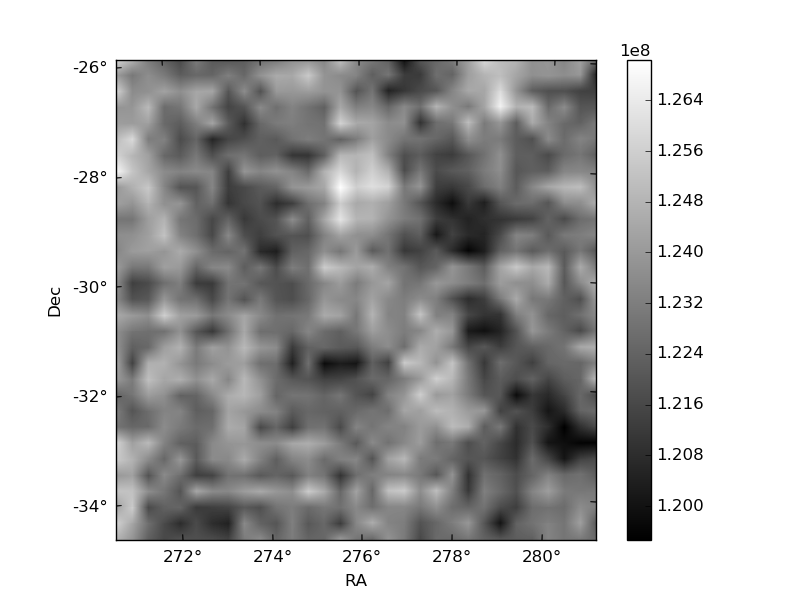
Quadrant B |
|---|---|---|---|
| Quadrant D | 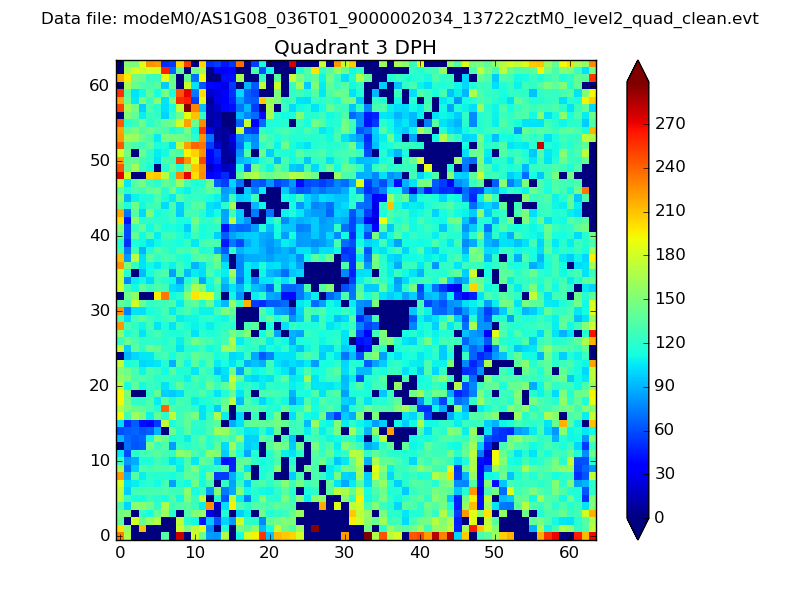 |
 |
Quadrant C |
| Plot type | Count rate plots | Images |
|---|---|---|
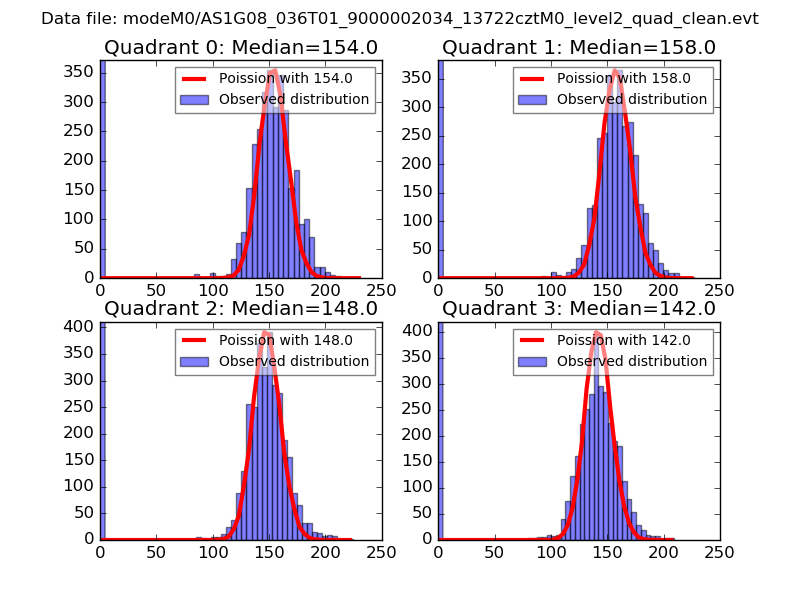
| Comparison with Poisson distribution Blue bars denote a histogram of data divided into 1 sec bins. Red curve is a Poisson curve with rate = median count rate of data. |
 |
 |
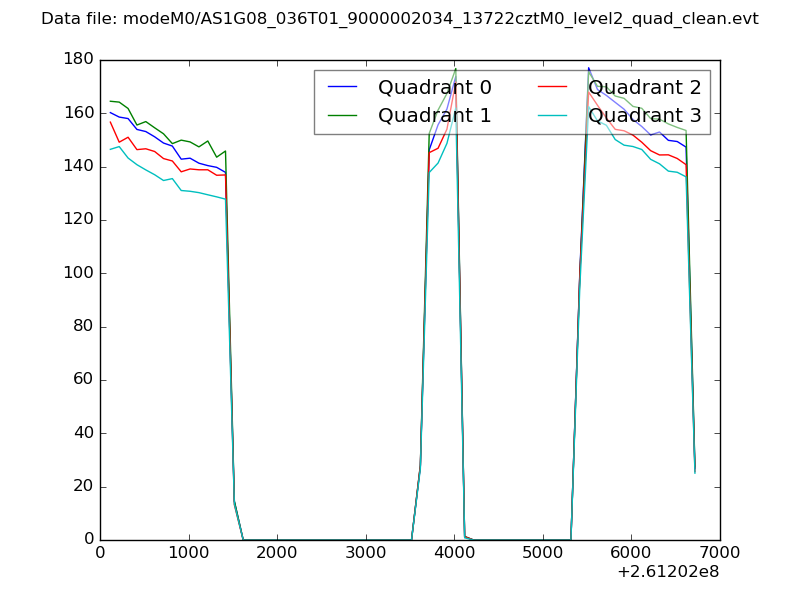
| Quadrant-wise count rates Data is divided into 100 sec bins |
 |
|
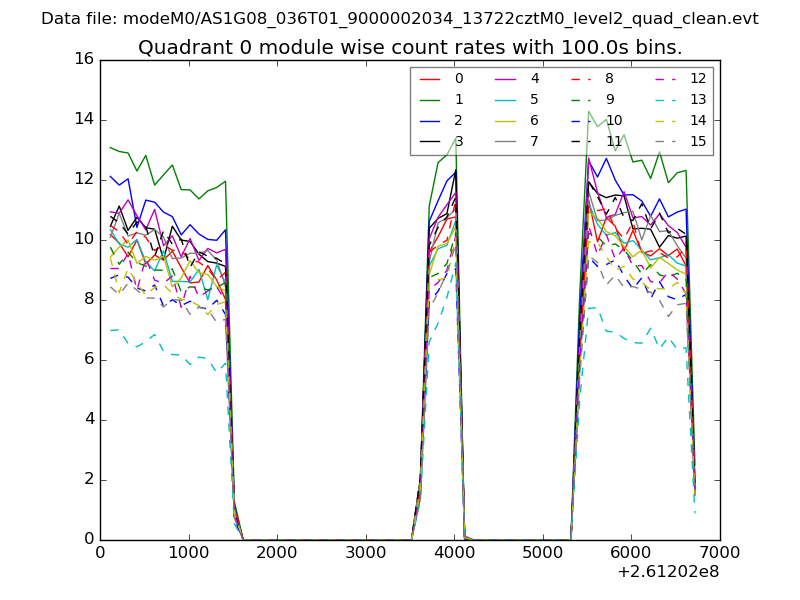
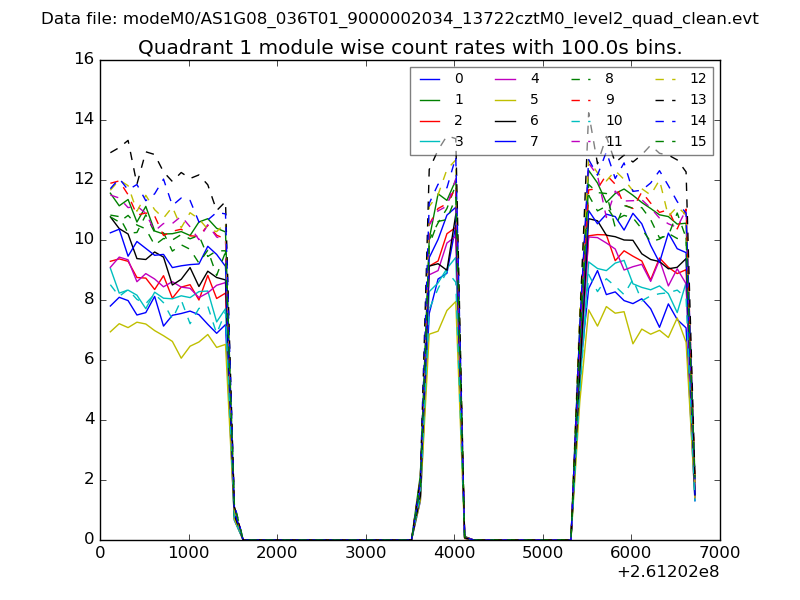
| Module-wise count rates for Quadrant A Data is divided into 100 sec bins |
 |
 |
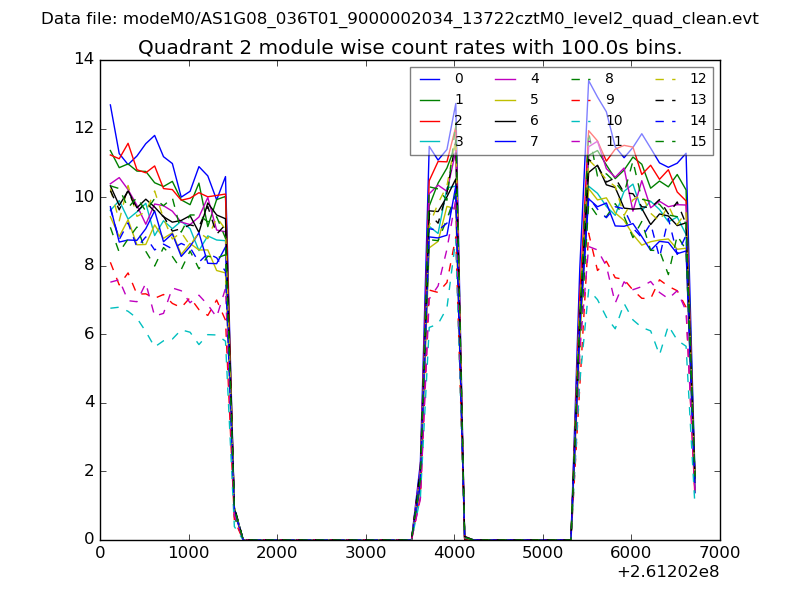
| Module-wise count rates for Quadrant B Data is divided into 100 sec bins |
 |
 |
| Module-wise count rates for Quadrant C Data is divided into 100 sec bins |
 |
 |
| Module-wise count rates for Quadrant D Data is divided into 100 sec bins |
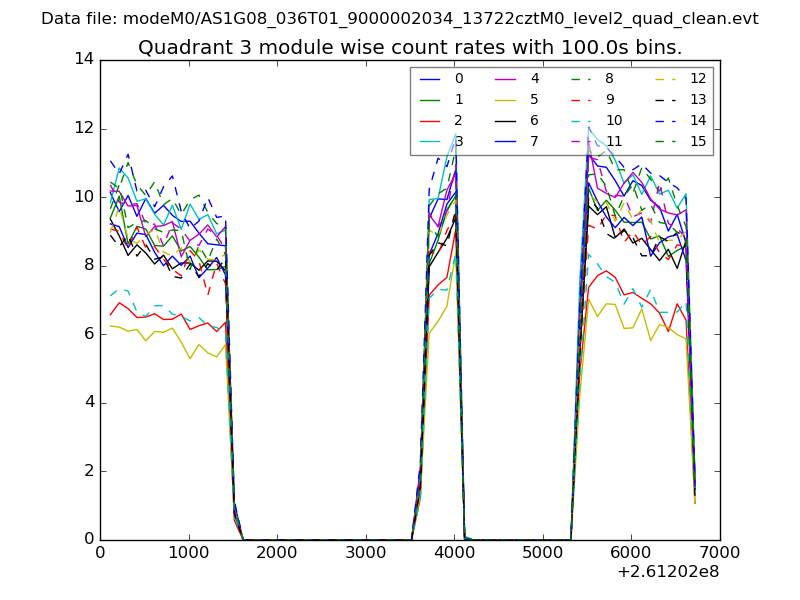 |
 |
| Parameter | Plot |
|---|---|
| CZT HV Monitor | 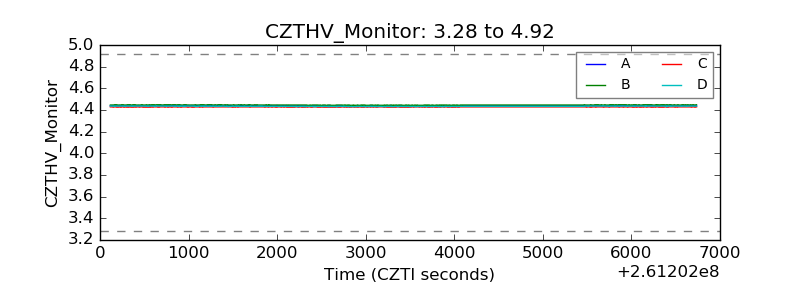 |
| D_VDD | 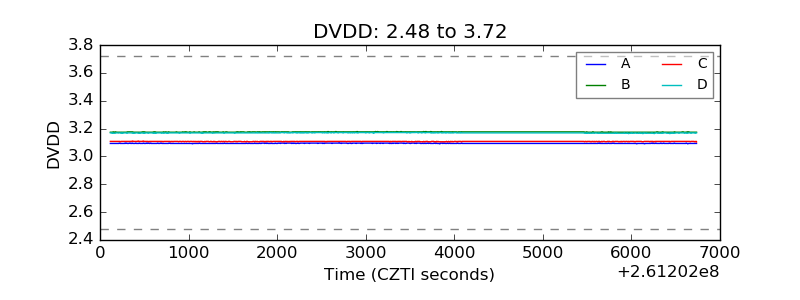 |
| Temperature 1 | 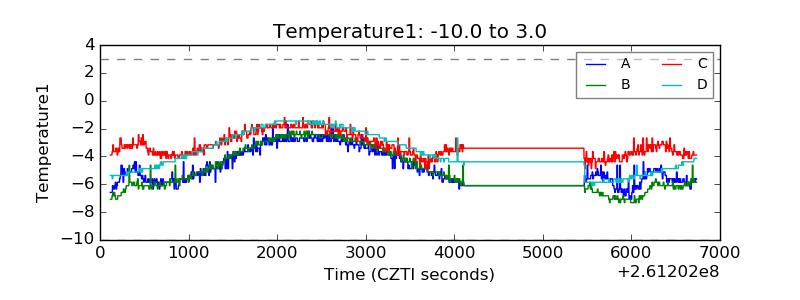 |
| Veto HV Monitor | 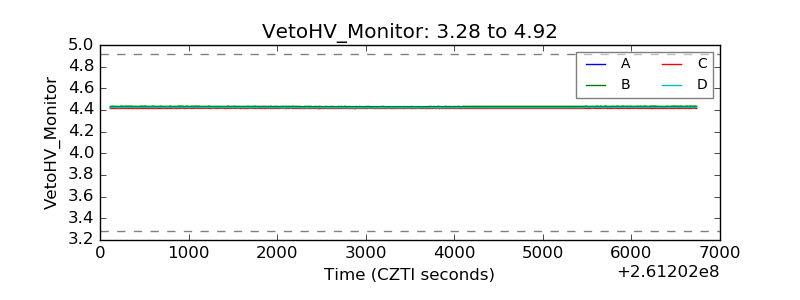 |
| Veto LLD |  |
| Alpha Counter | 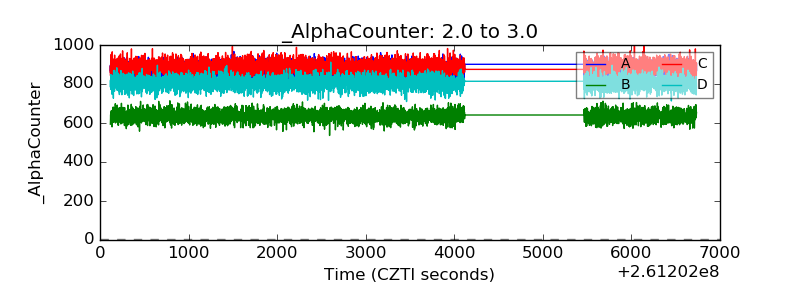 |
| _CPM_Rate | 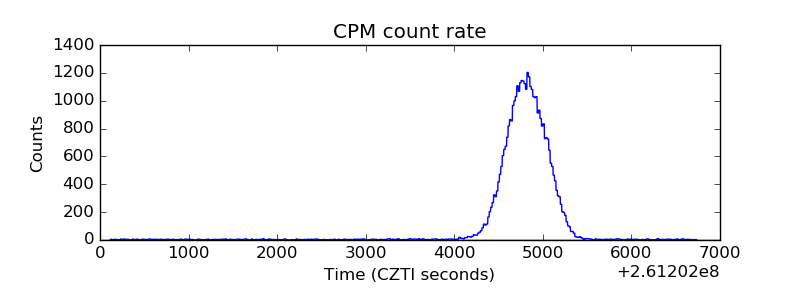 |
| CZT Counter | 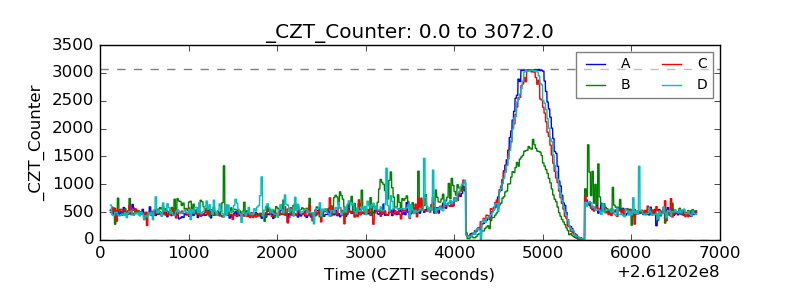 |
| +2.5 Volts monitor |  |
| +5 Volts monitor | 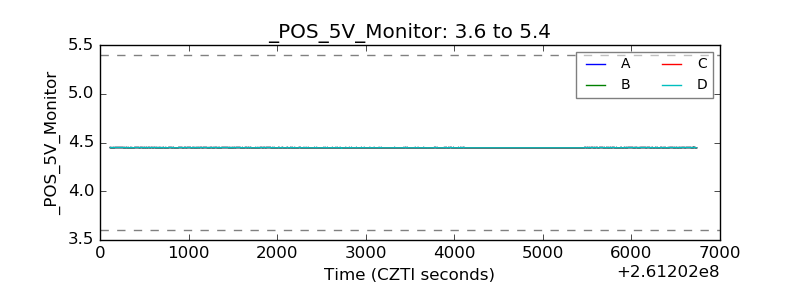 |
| _ROLL_ROT | 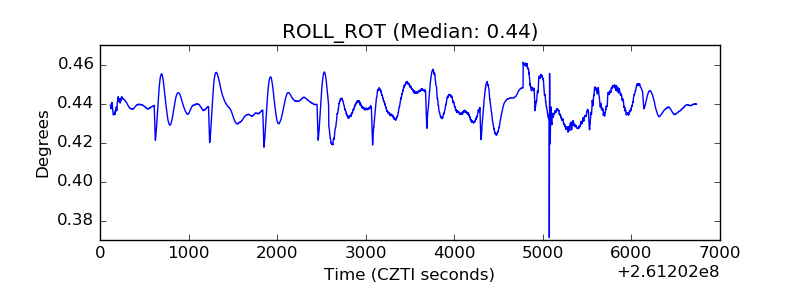 |
| _Roll_DEC | 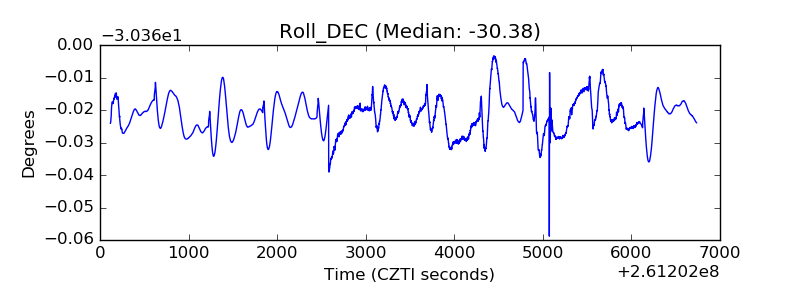 |
| _Roll_RA | 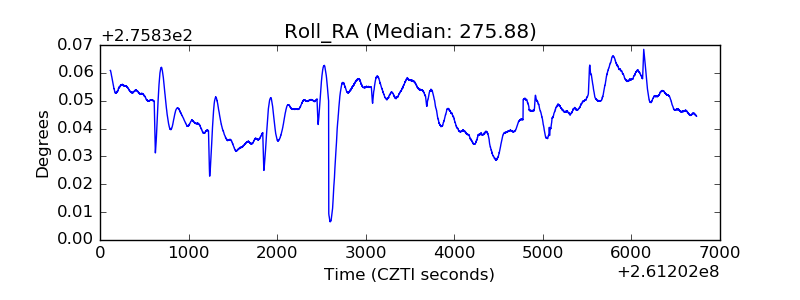 |
| Veto Counter | 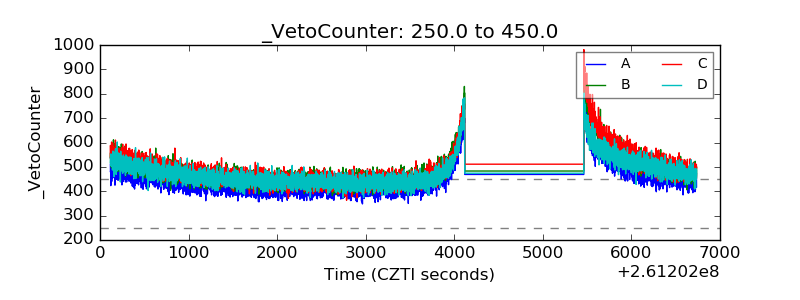 |